

(All data & visualisations by ChartMill.com)
Daily Market Trend Analysis – May 30, 2025 (After Market Close)
Initially it looked like the major US index ETFs would close significantly lower on Friday. Eventually, financial markets were partially reassured by a message from President Trump about an upcoming meeting with Chinese President Xi Jinping.
The indices remain close to their next resistance.
Short Term Trend
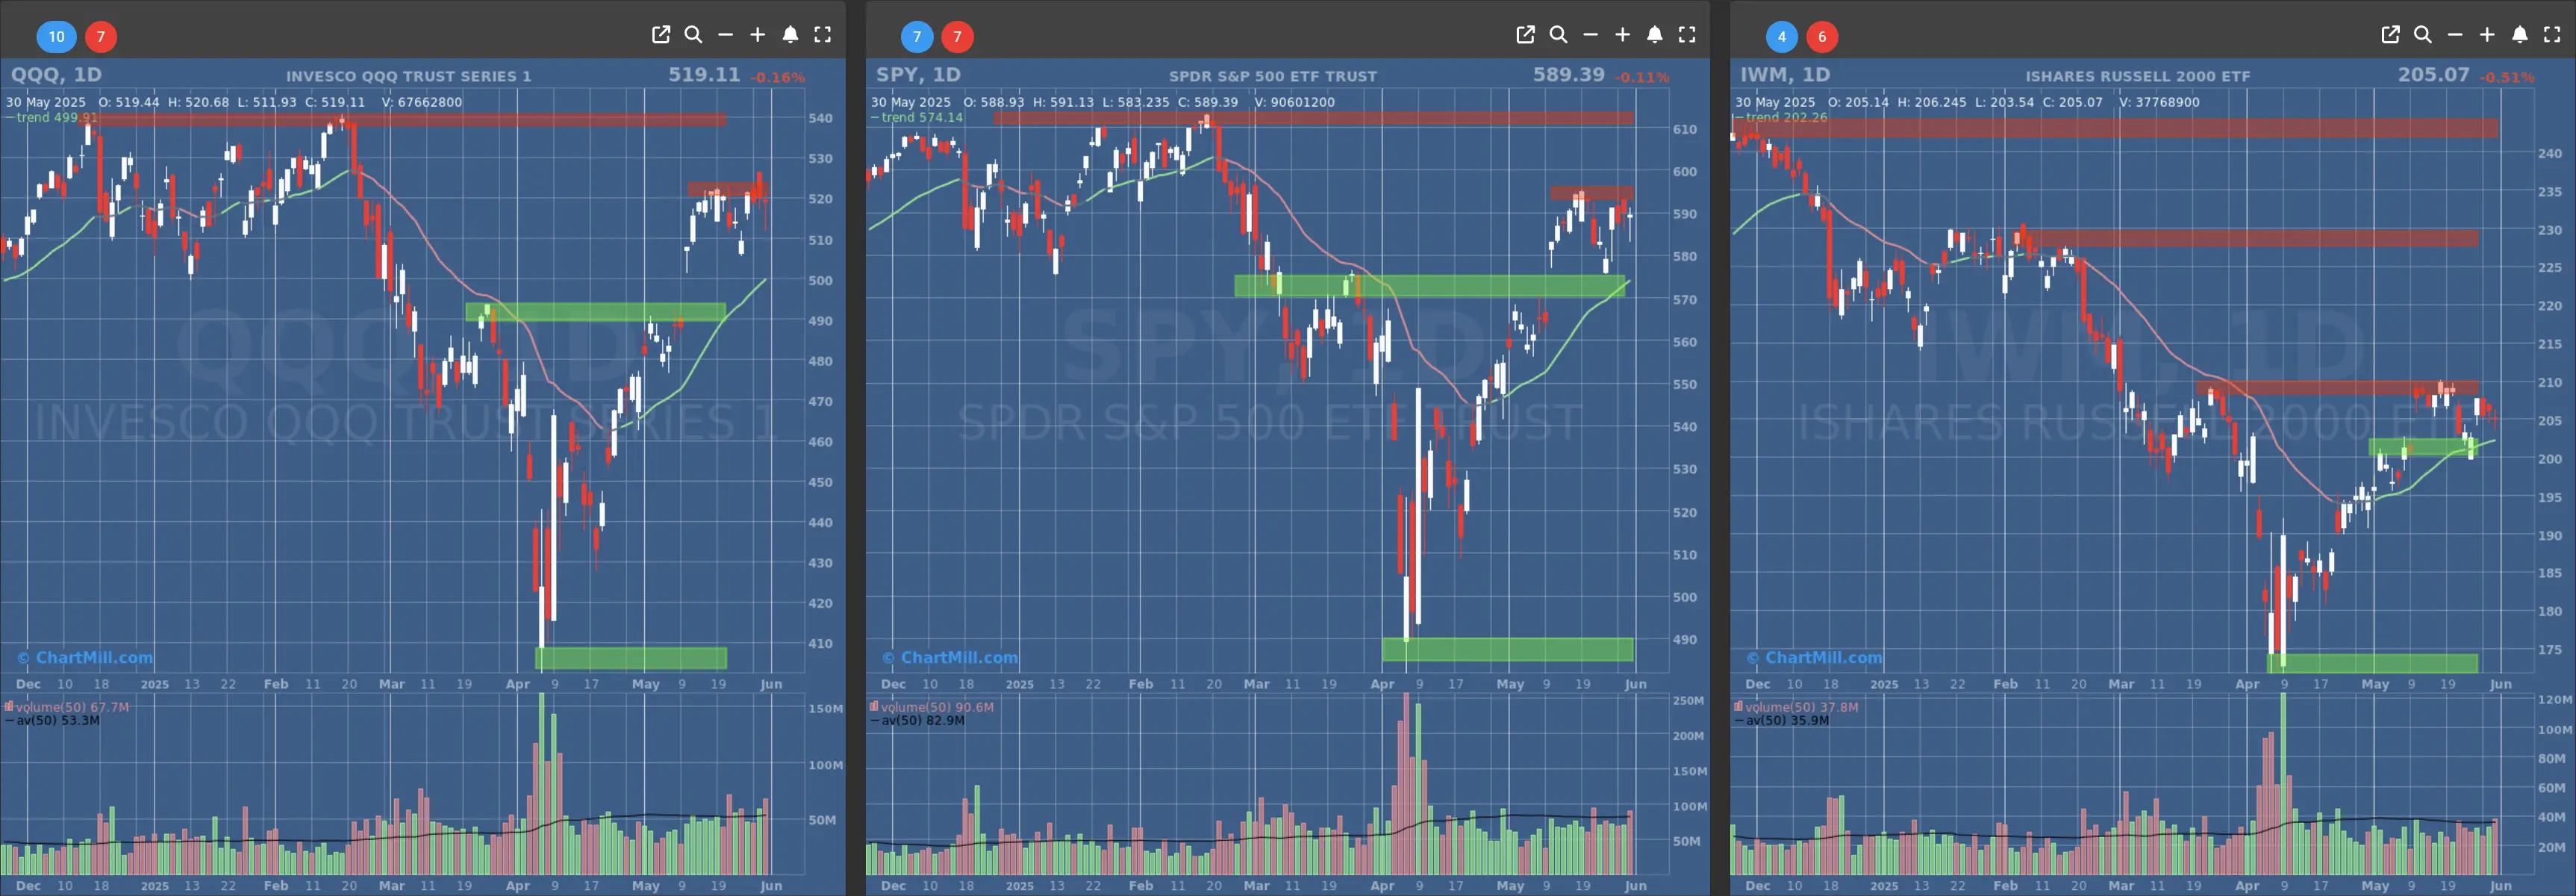
- Short-Term Trend: Bullish (no change)
- Next Support at $570
- Next Resistance at $595
- Volume: Slightly Above Average (50)
- Pattern: Doji Candle, Down Day
- Short-Term Trend: Bullish (no change)
- Next Support at $490
- Next Resistance at $520
- Volume: Above Average (50)
- Pattern: Doji Candle, Down Day
- Short-Term Trend: Bullish (no change)
- Next Support at $200
- Next Resistance at $205 & $210
- Volume: Slightly Above Average (50)
- Pattern: Doji Candle, Down Day
Long Term Trend
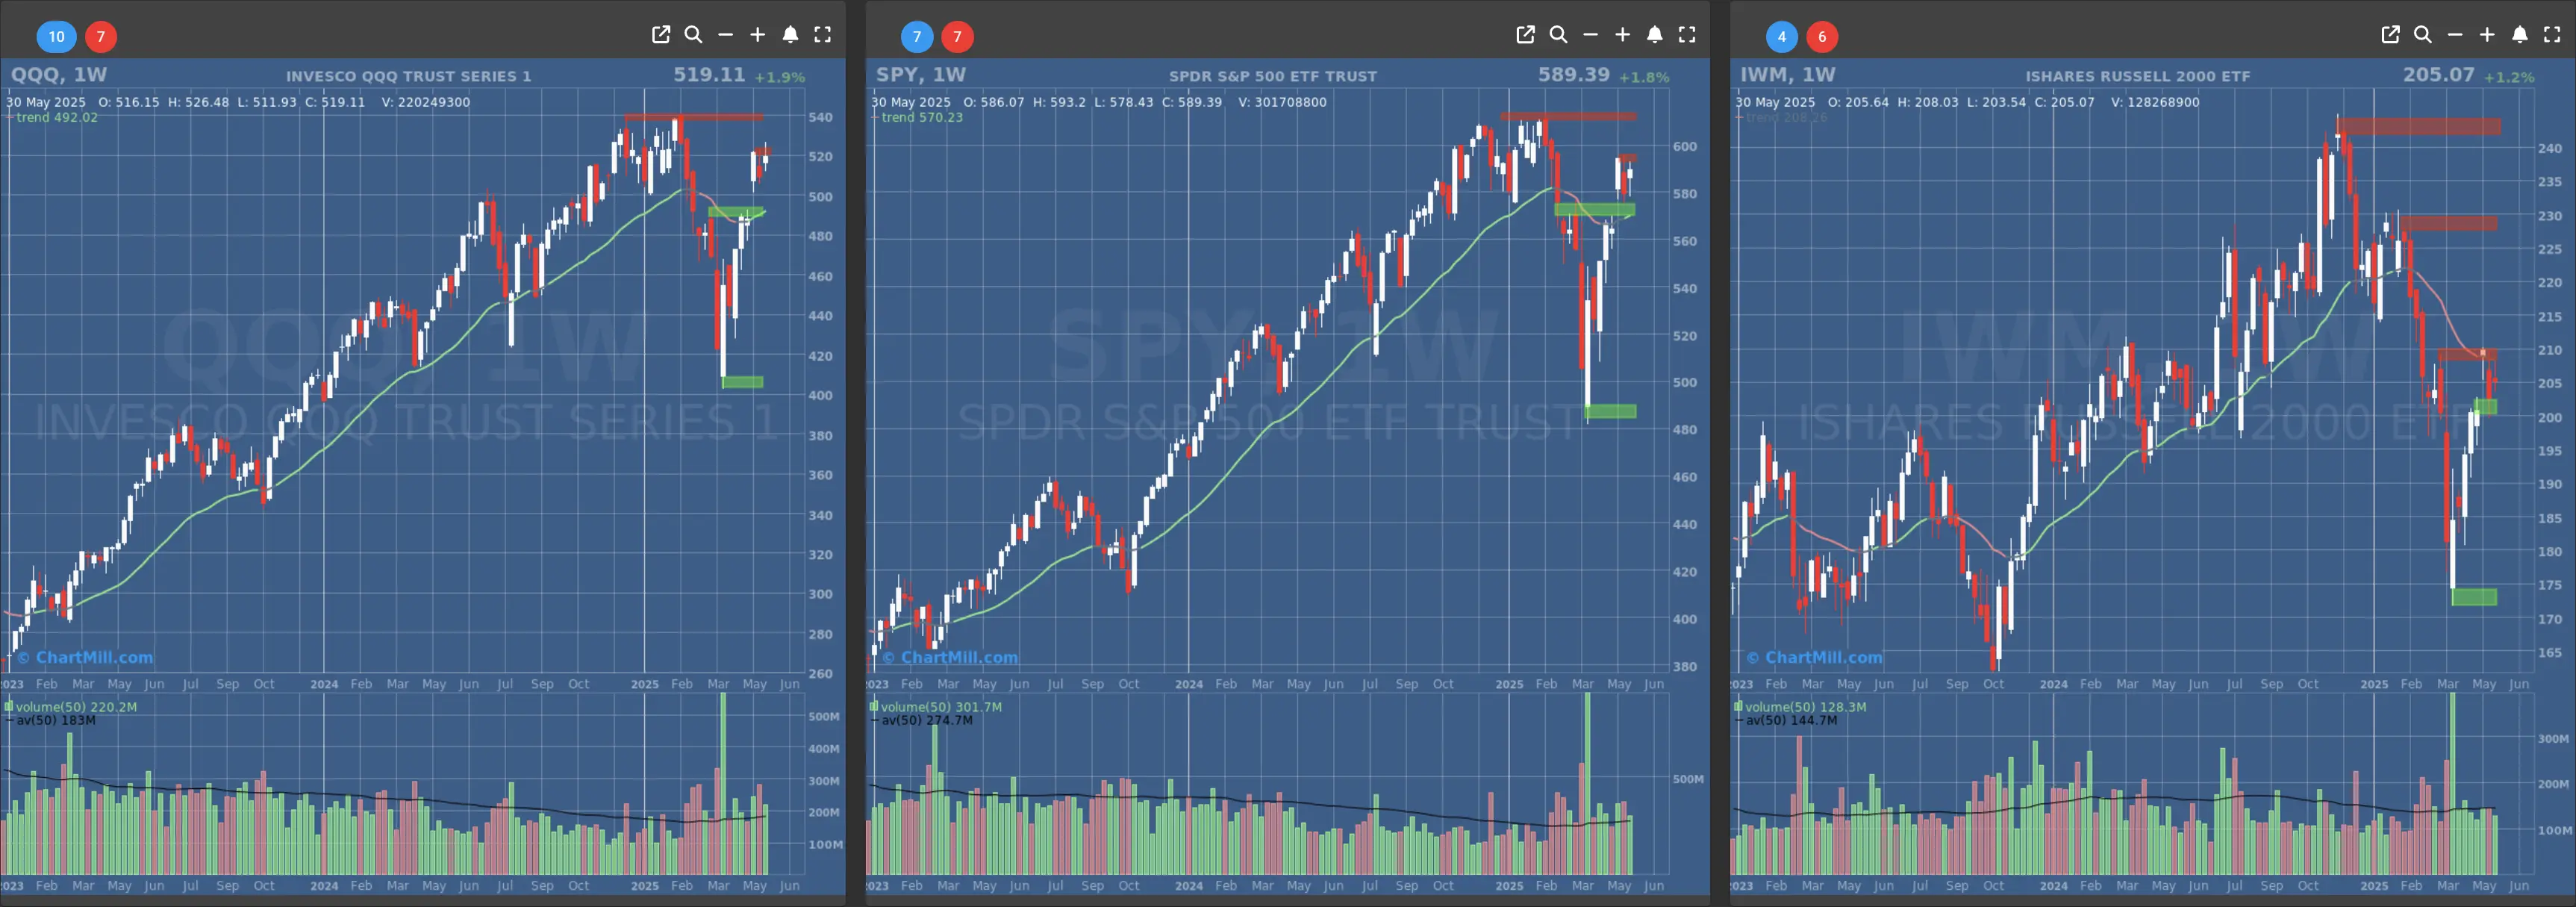
- Long-Term Trend: Confirmed Positive (weekly candle), final result on Friday after market close. (from neutral)
- Long-Term Trend: Positive (no change)
- Long-Term Trend: Neutral (no change)
Daily Market Breadth Analysis – May 30, 2025 (After Market Close)
Market Breadth Analysis: Conditions Weaken to Close Out May
The final trading week of May 2025 ended with a noticeable decline in market breadth, reflecting broad-based weakness despite strong index-level performance earlier in the month.
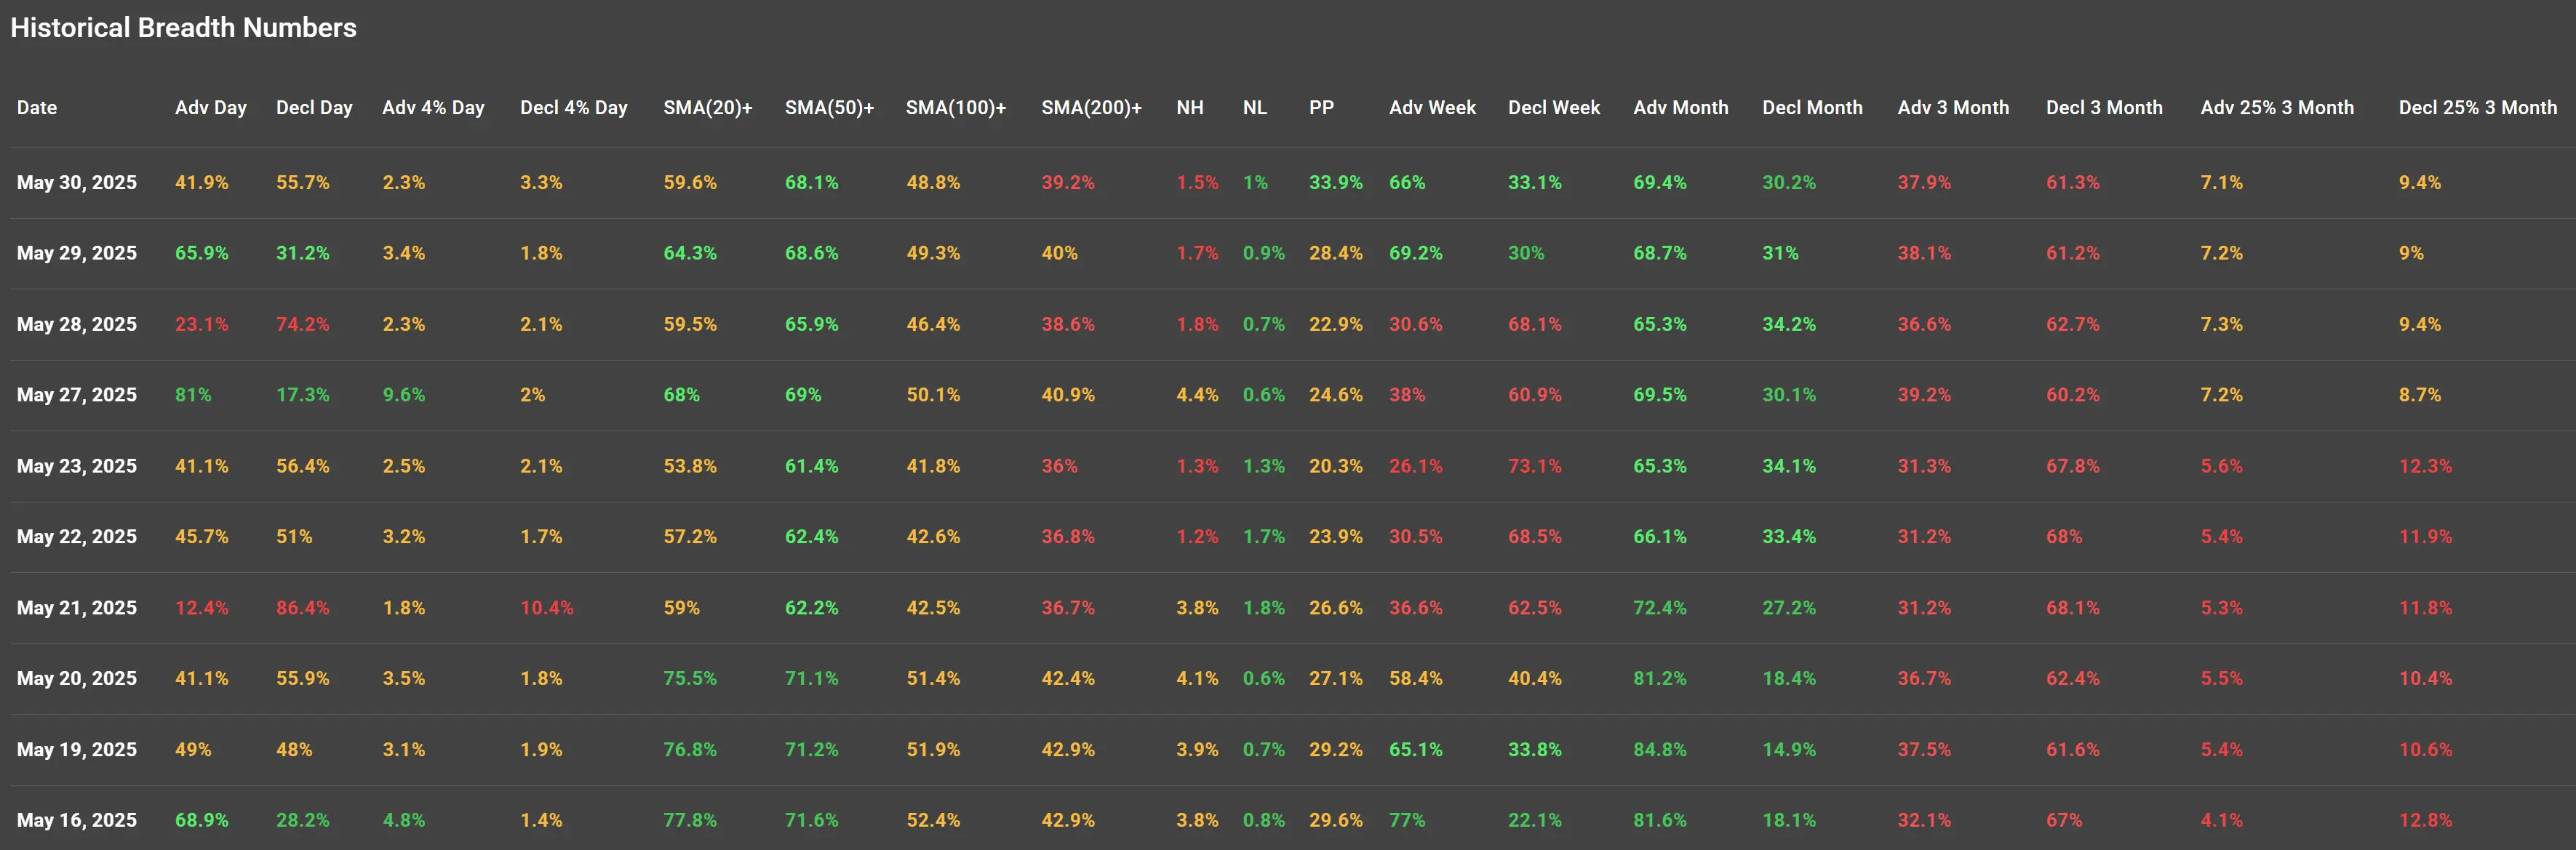
Decliners Outpaced Advancers
On May 30, only 41.9% of stocks advanced, while 55.7% declined.
This imbalance was more negative than the previous session (May 29) when advancers stood at a strong 65.9%. The shift highlights a loss of momentum heading into the new month, with selling pressure returning to the broader market.
Fewer Breakouts, More Breakdowns
The number of stocks gaining or losing more than 4% stayed modest. On May 30:
-
2.3% of stocks rose more than 4% (similar to previous days),
-
But 3.3% fell more than 4%, the highest daily downside volatility since May 21.
This indicates an uptick in high-magnitude declines, suggesting that sellers are becoming more aggressive.
Fading Strength Across Moving Averages
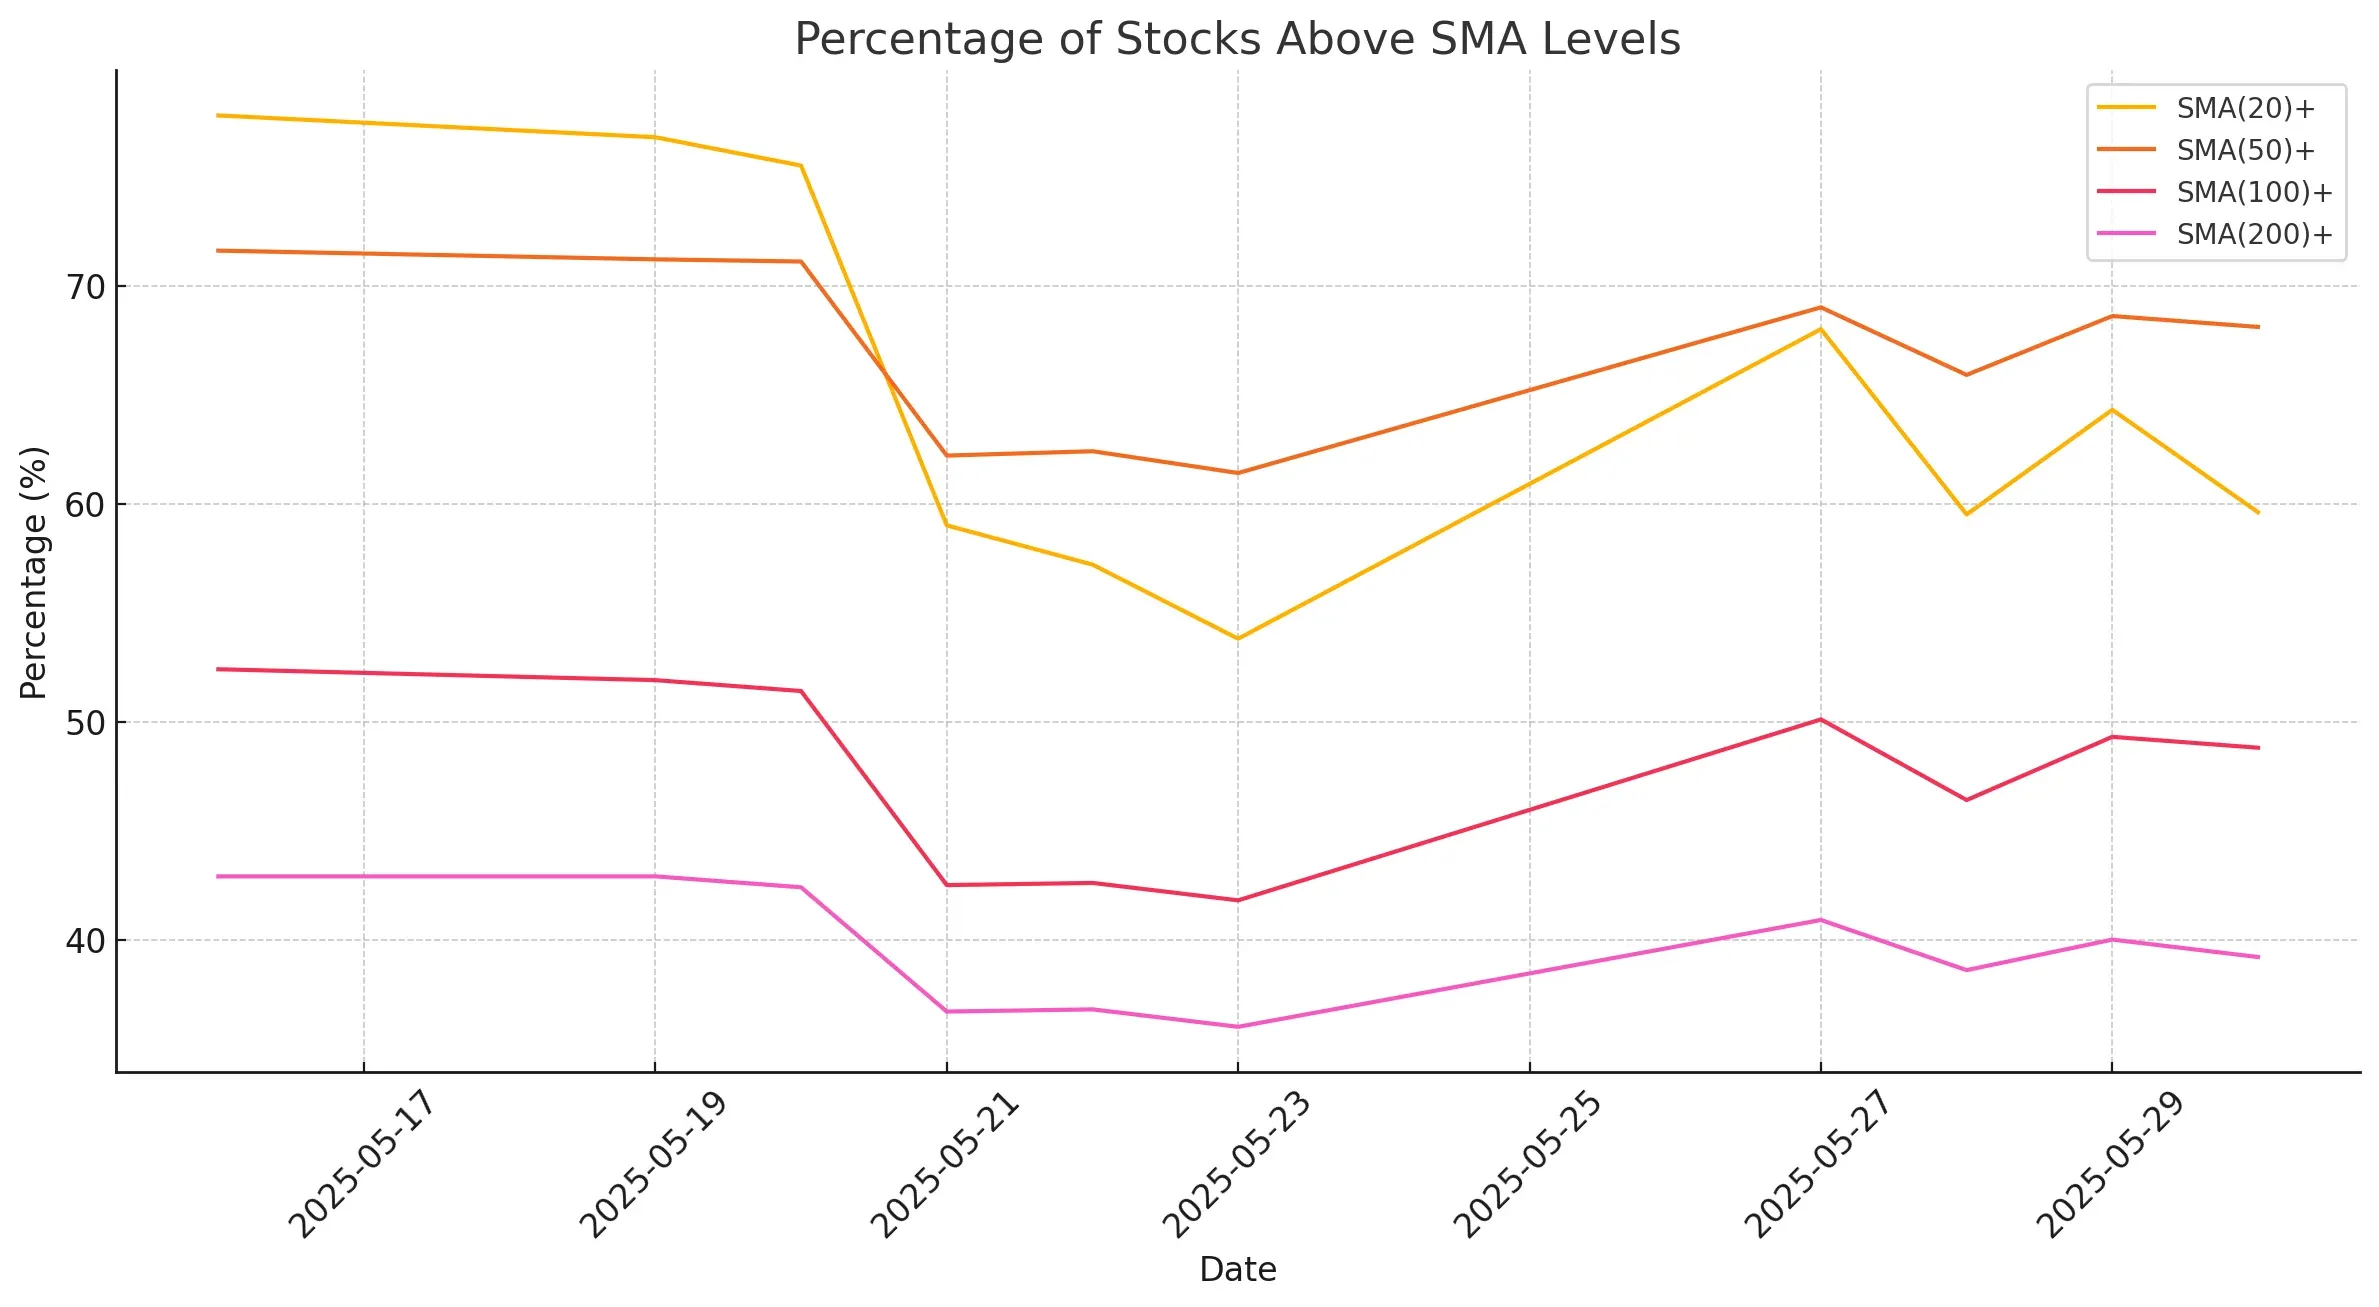
The chart above illustrates a key trend: fewer stocks are trading above their short- and long-term moving averages.
-
The percentage of stocks above the 20-day SMA dropped to 59.6% from a high of 77.8% earlier in the month.
-
The 50-day SMA readings remained relatively stable around 68%, but failed to improve further.
-
The 100-day and 200-day SMA levels continue to show weaker participation, with only 48.8% and 39.2% of stocks above these thresholds, respectively.
This decline is a cautionary signal, showing that fewer stocks are supporting the uptrend seen in the major indices.
Long-Term Breadth Still Positive, But Eroding
Over a 3-month view, advancing stocks (37.0%) still outnumber decliners (61.3%), but the gap is narrowing. Additionally, only 7.1% of stocks are up 25% or more over the past three months, while 9.4% are down at least 25%.
This distribution suggests waning bullish leadership and a slow creep in deeper losses.
Conclusion: Cracks Under the Surface
While headline indices may show only minor daily fluctuations, the underlying breadth data paints a more fragile picture.
Declining participation, reduced breakout activity, and weakening support from long-term moving averages all hint at potential market exhaustion, or at the very least, a short-term pause in upward momentum.
Traders should be cautious about overly bullish positioning, particularly if the technical support from broader breadth metrics continues to deteriorate.
Next to read: Market Monitor News, June 02