
Return on Capital Employed (ROCE) Explained

Profitability ratios
Profitability ratios come in different forms. For example, in addition to the ROCE discussed in this article, there is also ROE, ROA and ROIC.
All four ratios focus on the term "profitability," an important parameter that should not be underestimated when evaluating investment opportunities.
Profitability ratios look more closely at the difference between costs and revenues in relation to the resources deployed.
What does the Return On Employed Capital (ROCE) tell us?
Return on Capital Employed or ROCE is a key figure that estimates the amount of profit a company can generate with the capital it uses.
It is calculated by dividing earnings before interest and taxes (EBIT) by capital employed. The higher a company's ROCE, the more efficiently it uses its capital.
This ratio is important for the management. Companies that can consistently increase their ROCE year after year clearly show that they are creating value for their investors, making them attractive investment options.
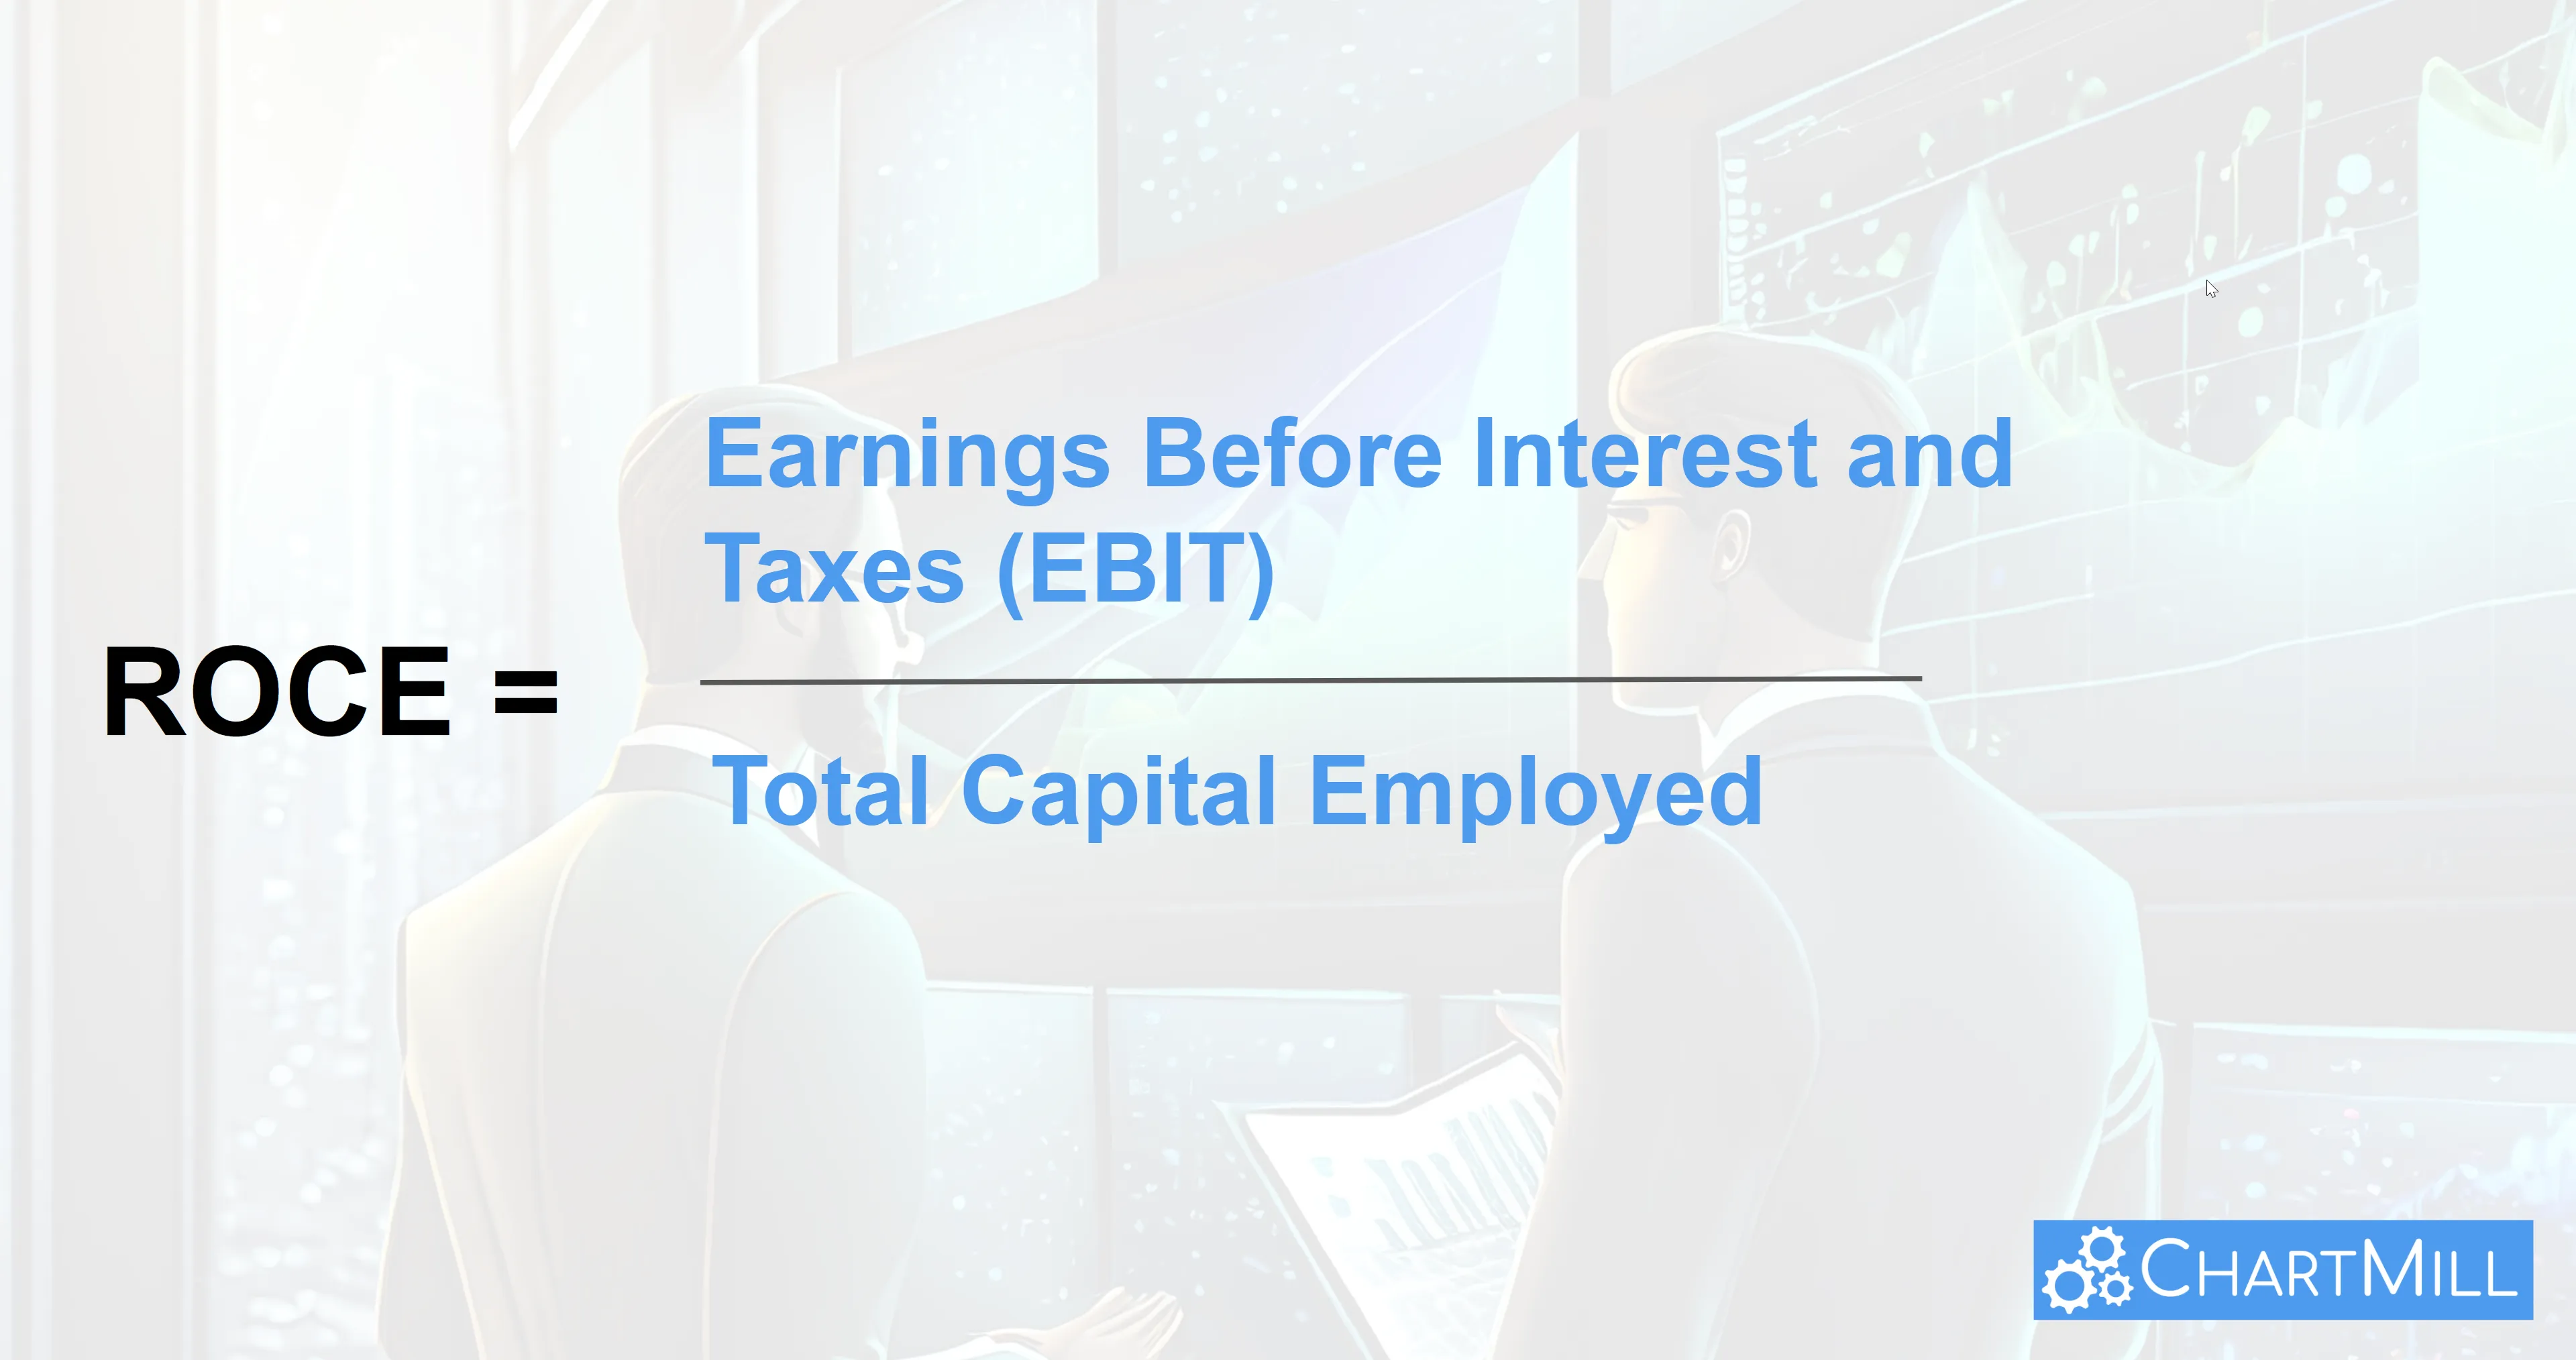
Where:
-
EBIT = Revenue - Cost Of Goods Sold (COGS) - Operating Expenses
-
Capital Employed = Total assets − Current liabilities
Example Microsoft
1. Calculating EBIT
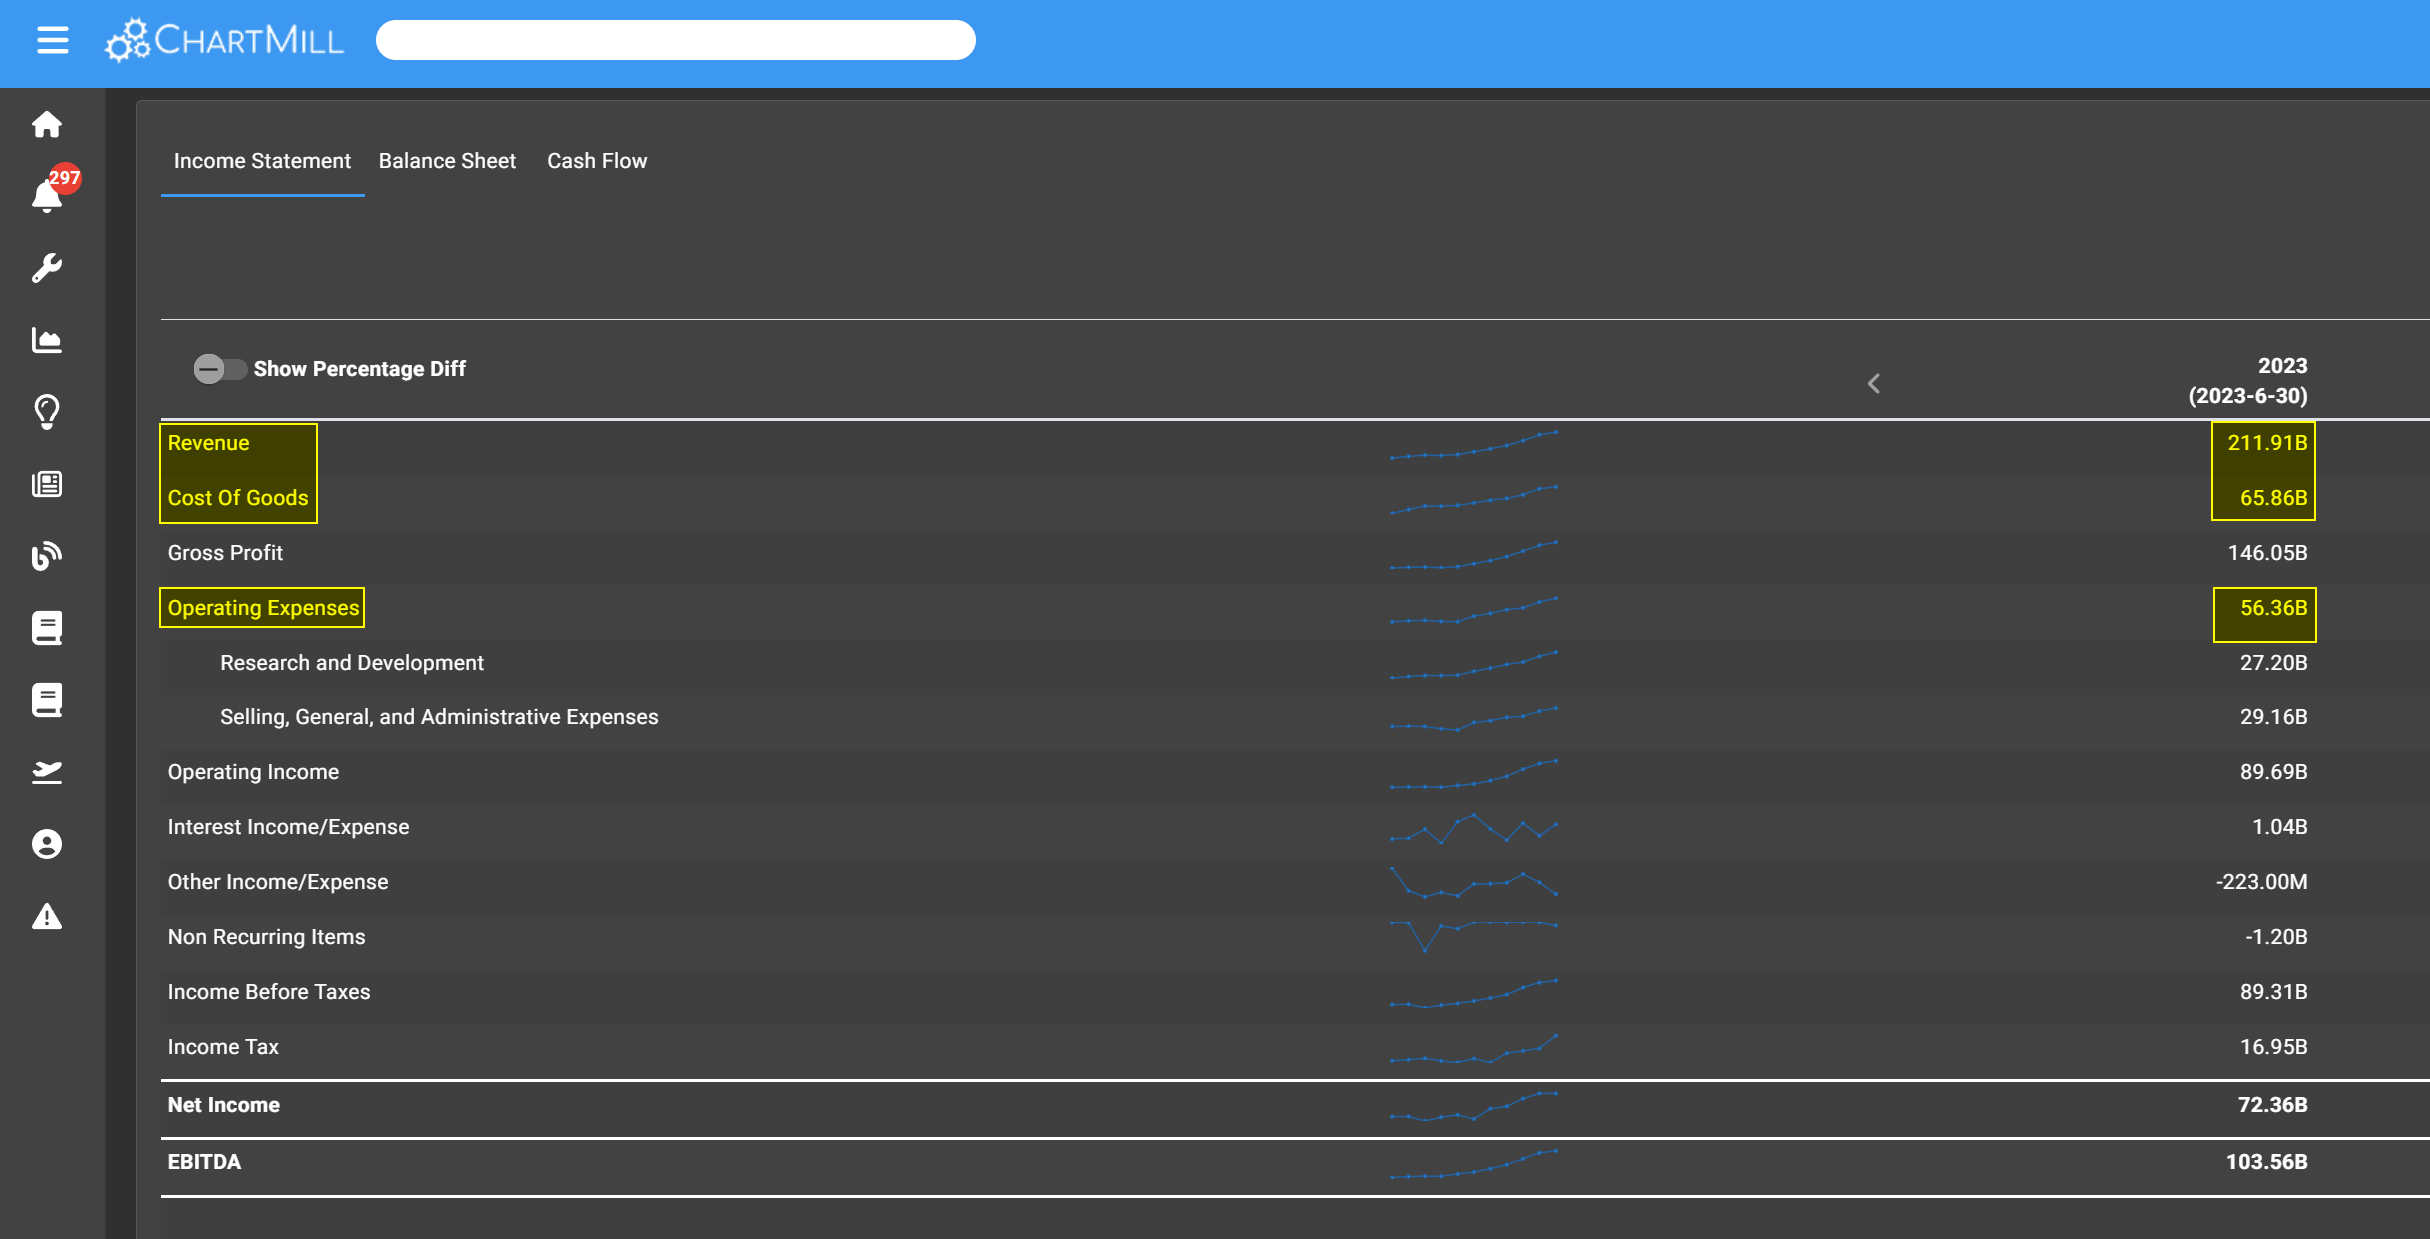
-
EBIT = 211.91 - 65.86 - 56.36
-
EBIT = 89.69
2. Calculating Total Capital Employed
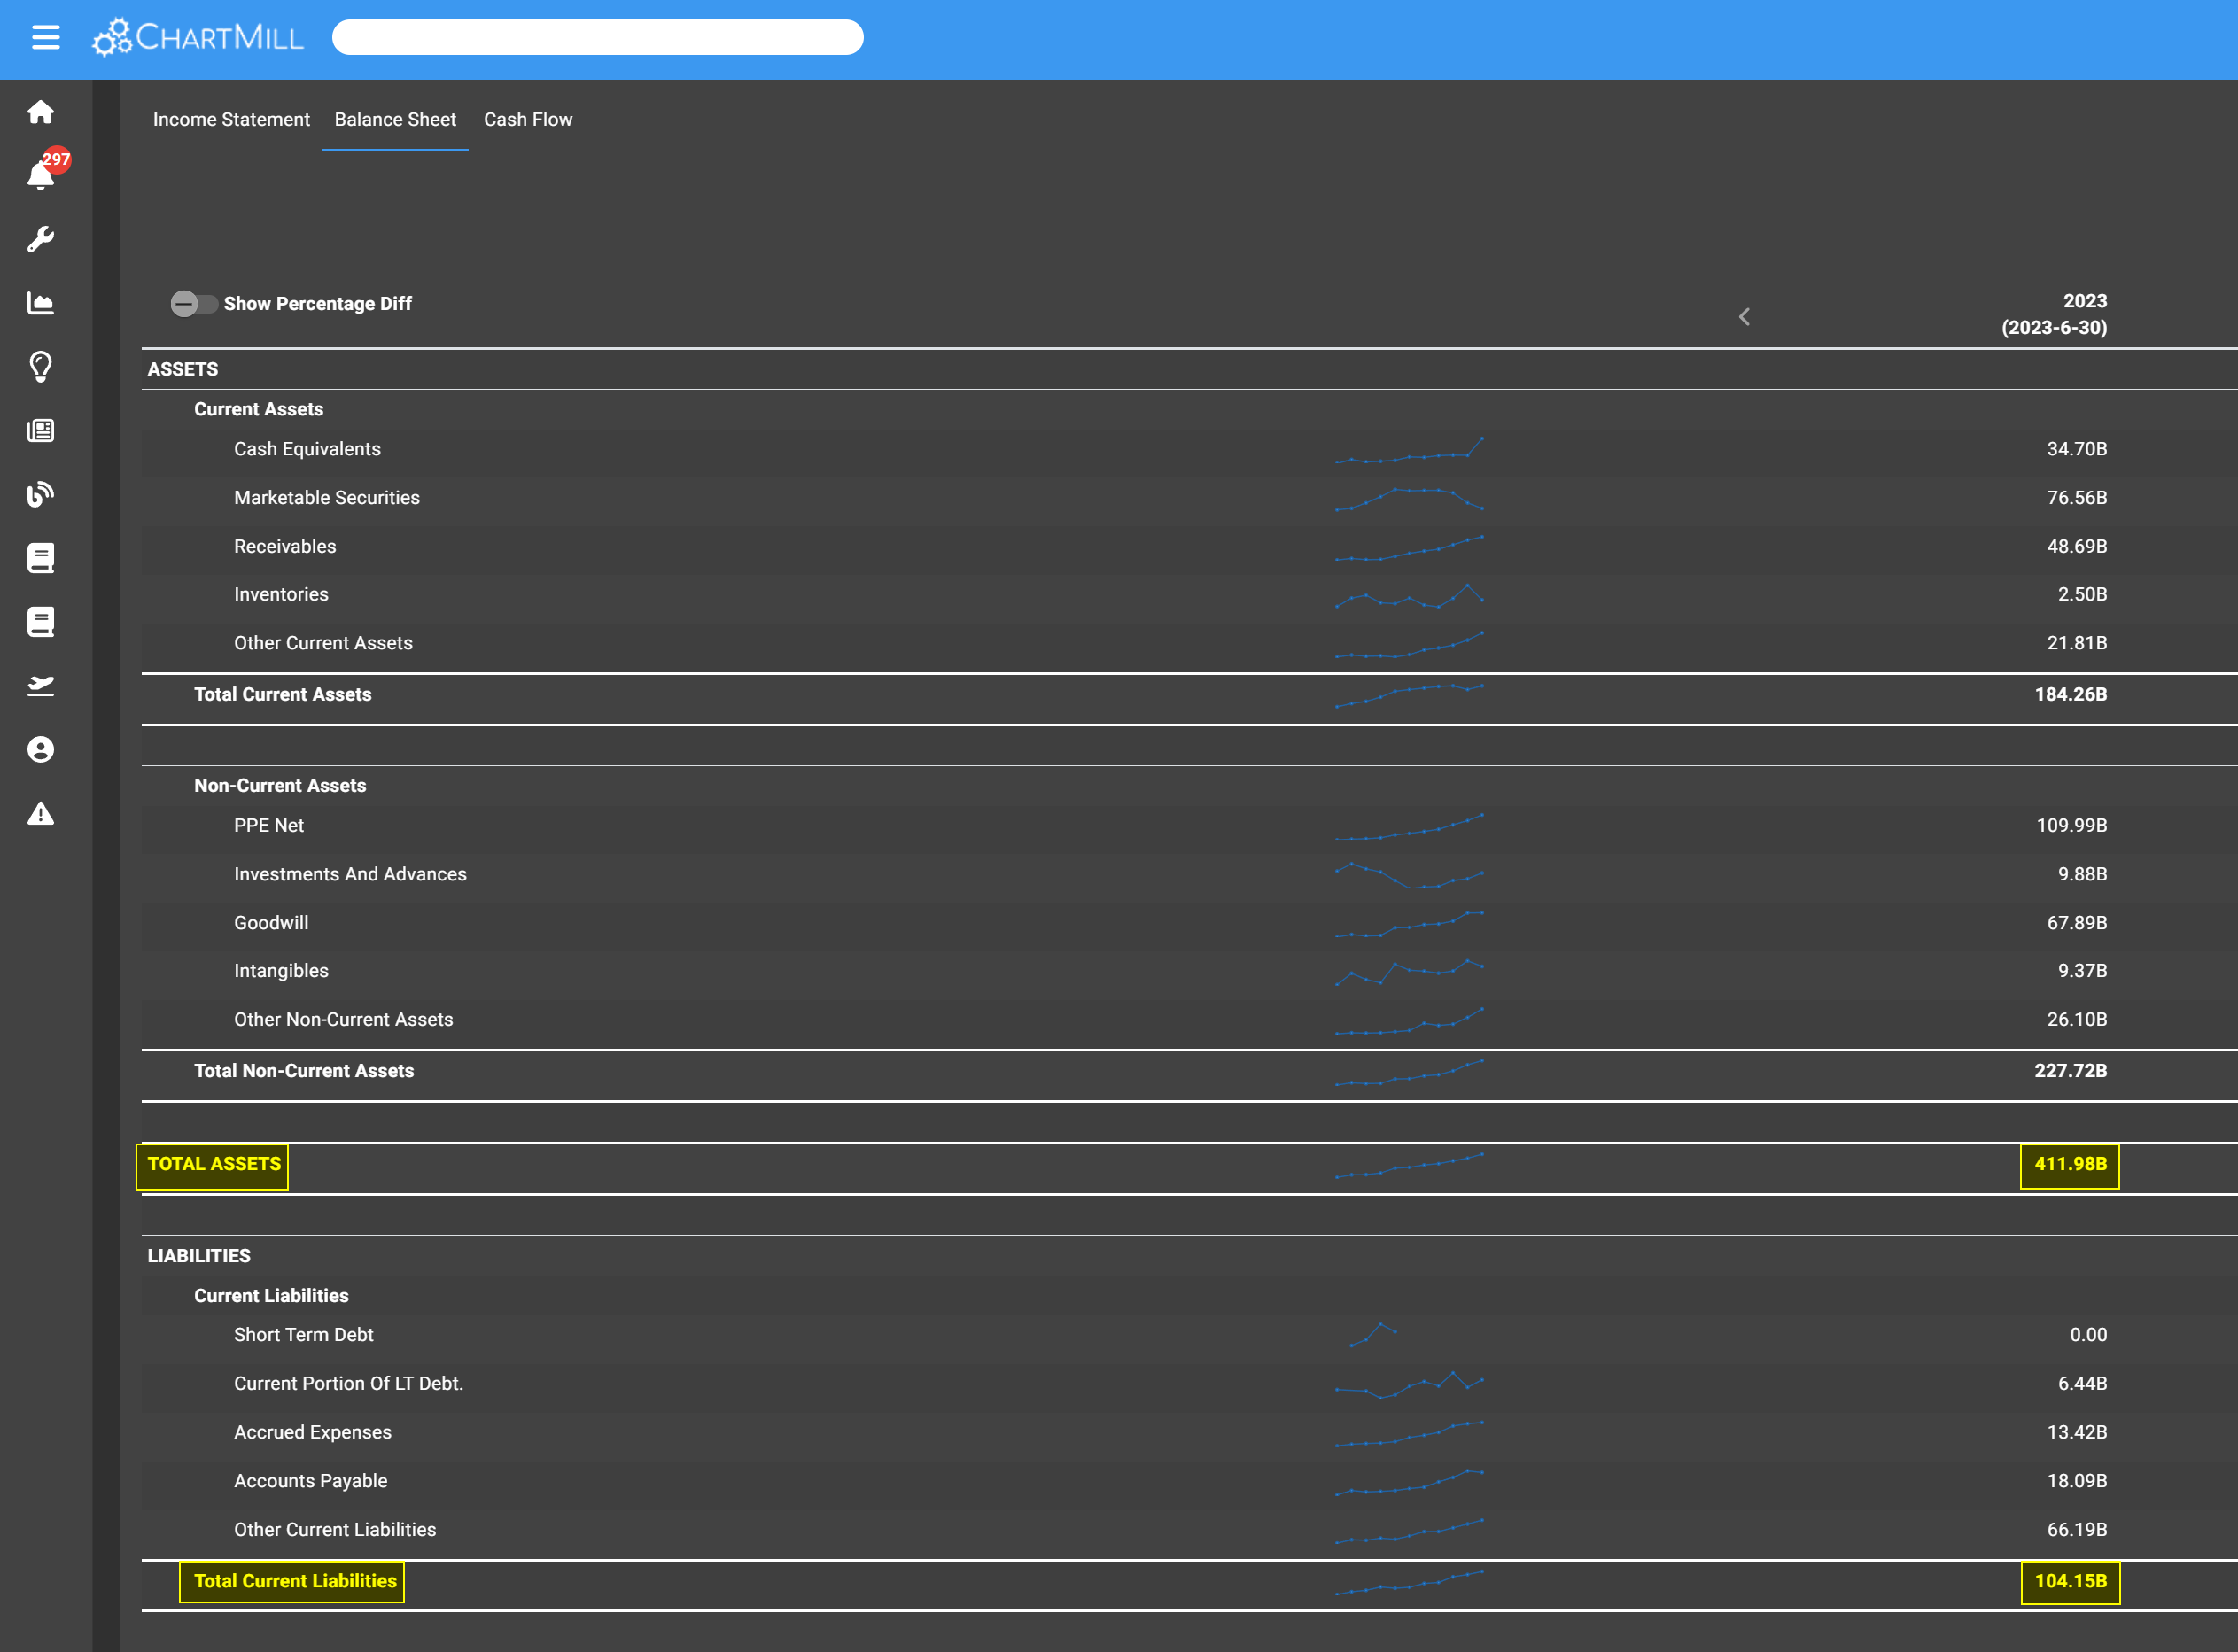
-
Total Capital Employed = 411.98 - 104.15
-
Total Capital Employed = 307.83
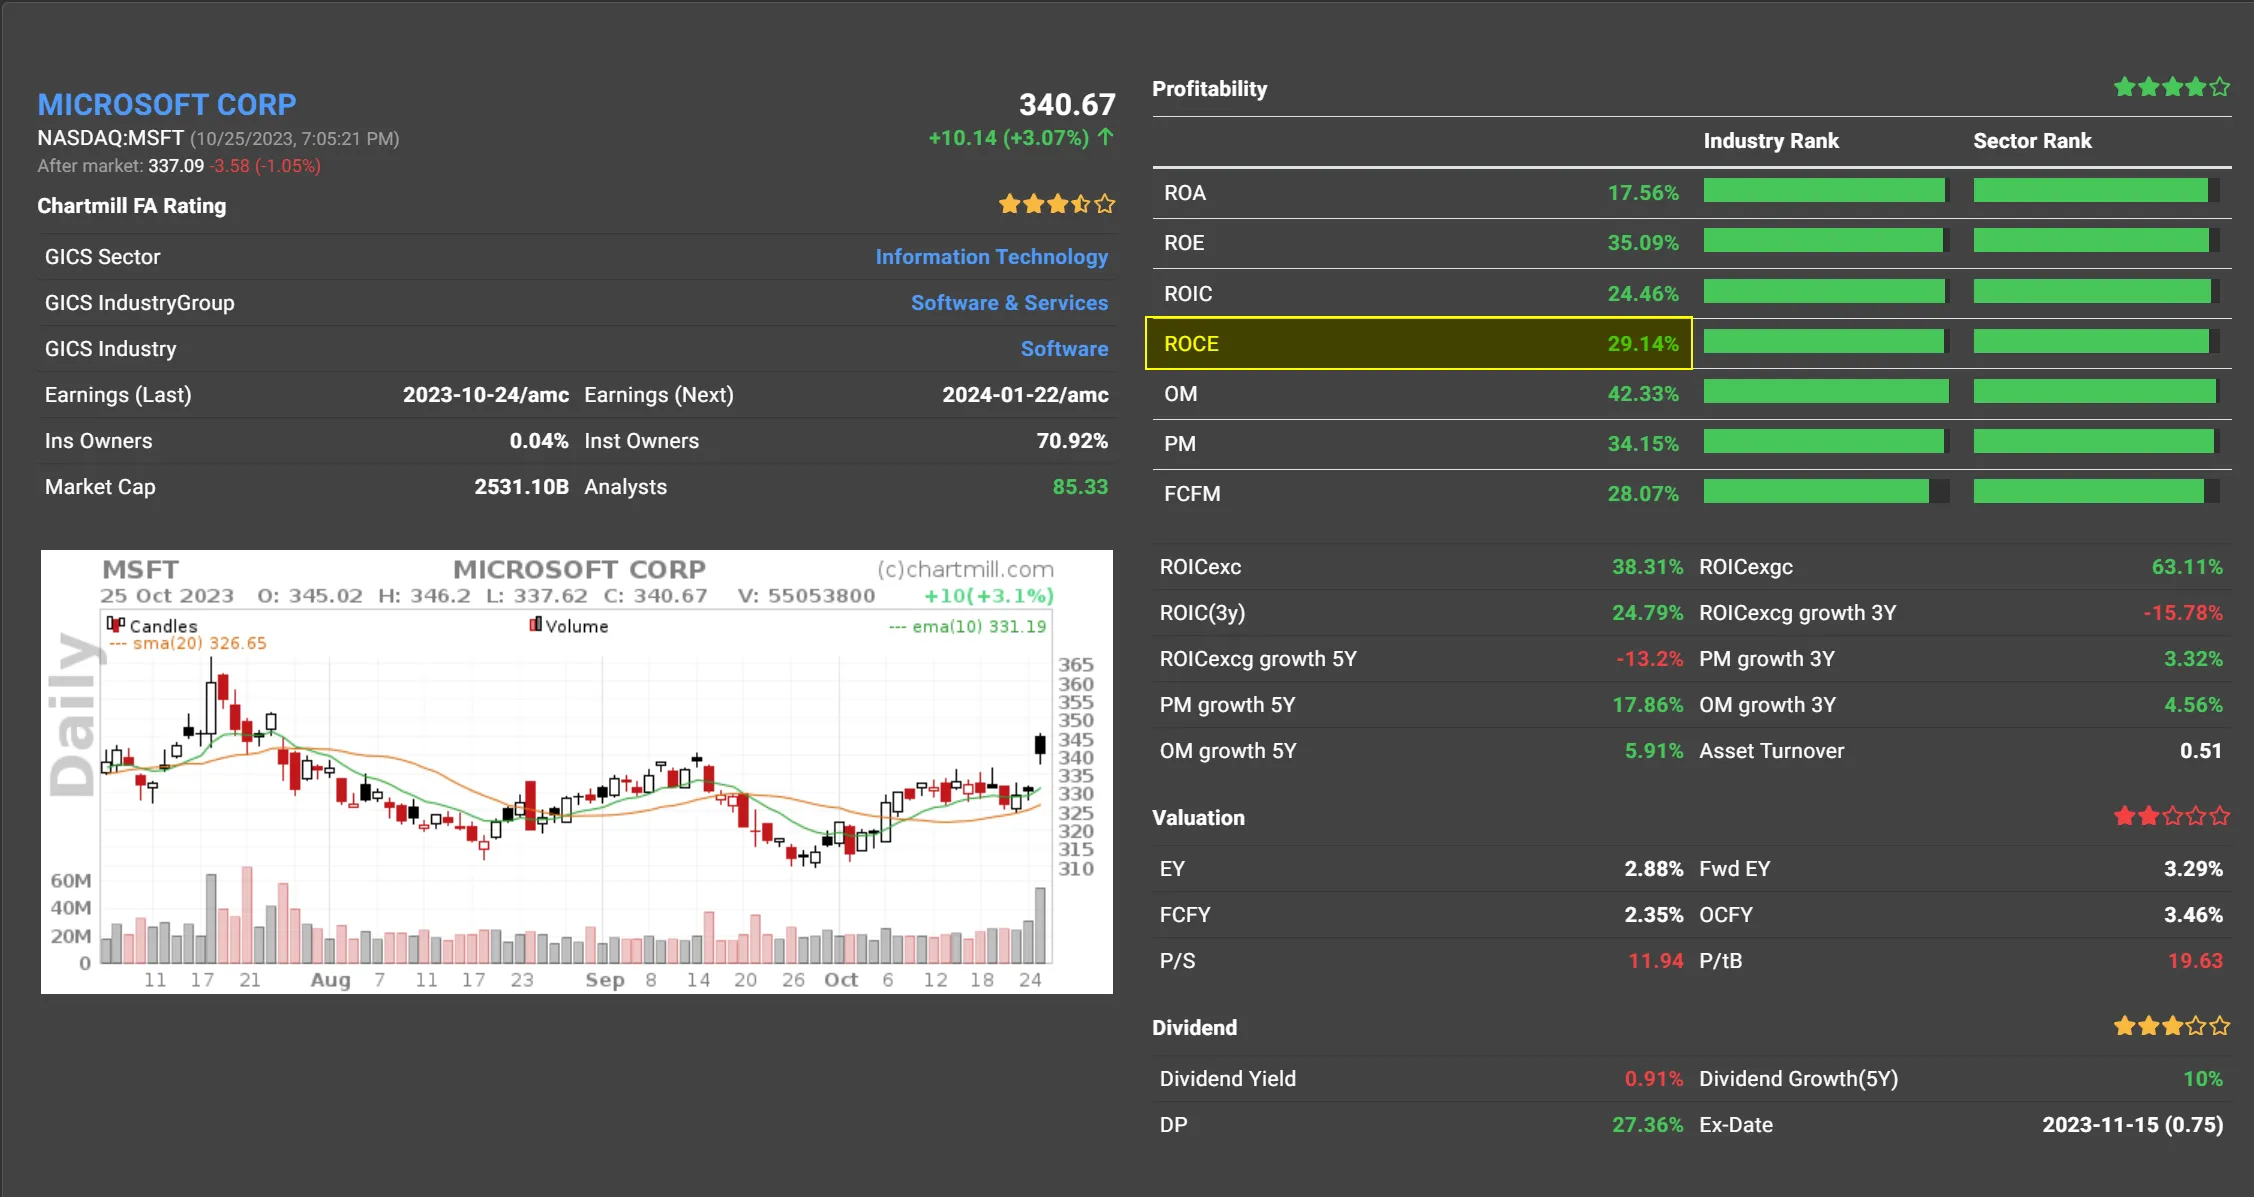
3. Calculating ROCE
89.69 / 307.83 = 0.29136 = 29.14%
When to Use this Fundamental Ratio?
ROCE is particularly interesting when companies need to be compared that have debt in addition to equity. These will mainly be the more capital-intensive sectors, such as automobile manufacturers, airlines or utilities. A rising trend in the ROCE ratio is evidence that company management is succeeding in putting capital employed (including debt) to good use.
If it appears that the ROCE can be kept consistently high, more investors will be inclined to buy shares of the company because of its attractive returns.
What ROCE should companies achieve?
In general, the higher the ROCE the better. An ROCE of 15% is a good standard. However, do not stare blindly at the figure alone, also check what the industry and sector average is. That's the only way to make an objective comparison.
Moreover, a single period figure says very little. Much more important is the trend. An ROCE of 10% may seem too low at first, but if the company started much lower a number of years ago and was then able to improve its ROCE year after year, that is a strong indication that management is succeeding in becoming more efficient with the capital employed.
What about Cash?
Companies that have a significant amount of cash on their balance sheet will have a lower ROCE. That's because that cash is part of capital employed (total assets minus current liabilities).
However, a large amount of cash has a number of benefits that should not be underestimated. Perhaps the most important; the company is more resilient in economically volatile times just because it has sufficient cash reserves. It will also be able to invest more quickly with its own funds without having to raise additional capital through debt when the market eventually recovers and new opportunities arise.
So if you compare competitors A and B and A's ROCE is somewhat lower than company B, be sure to look at the cash position and debt ratio of both companies. It may well be that company A with a lower ROCE is still the most interesting option.
The bottom line - as with all ratios - is not to rely solely on one ratio but to consider other key metrics as well and consult quarterly and annual financial statements in order to adequately screen the company.
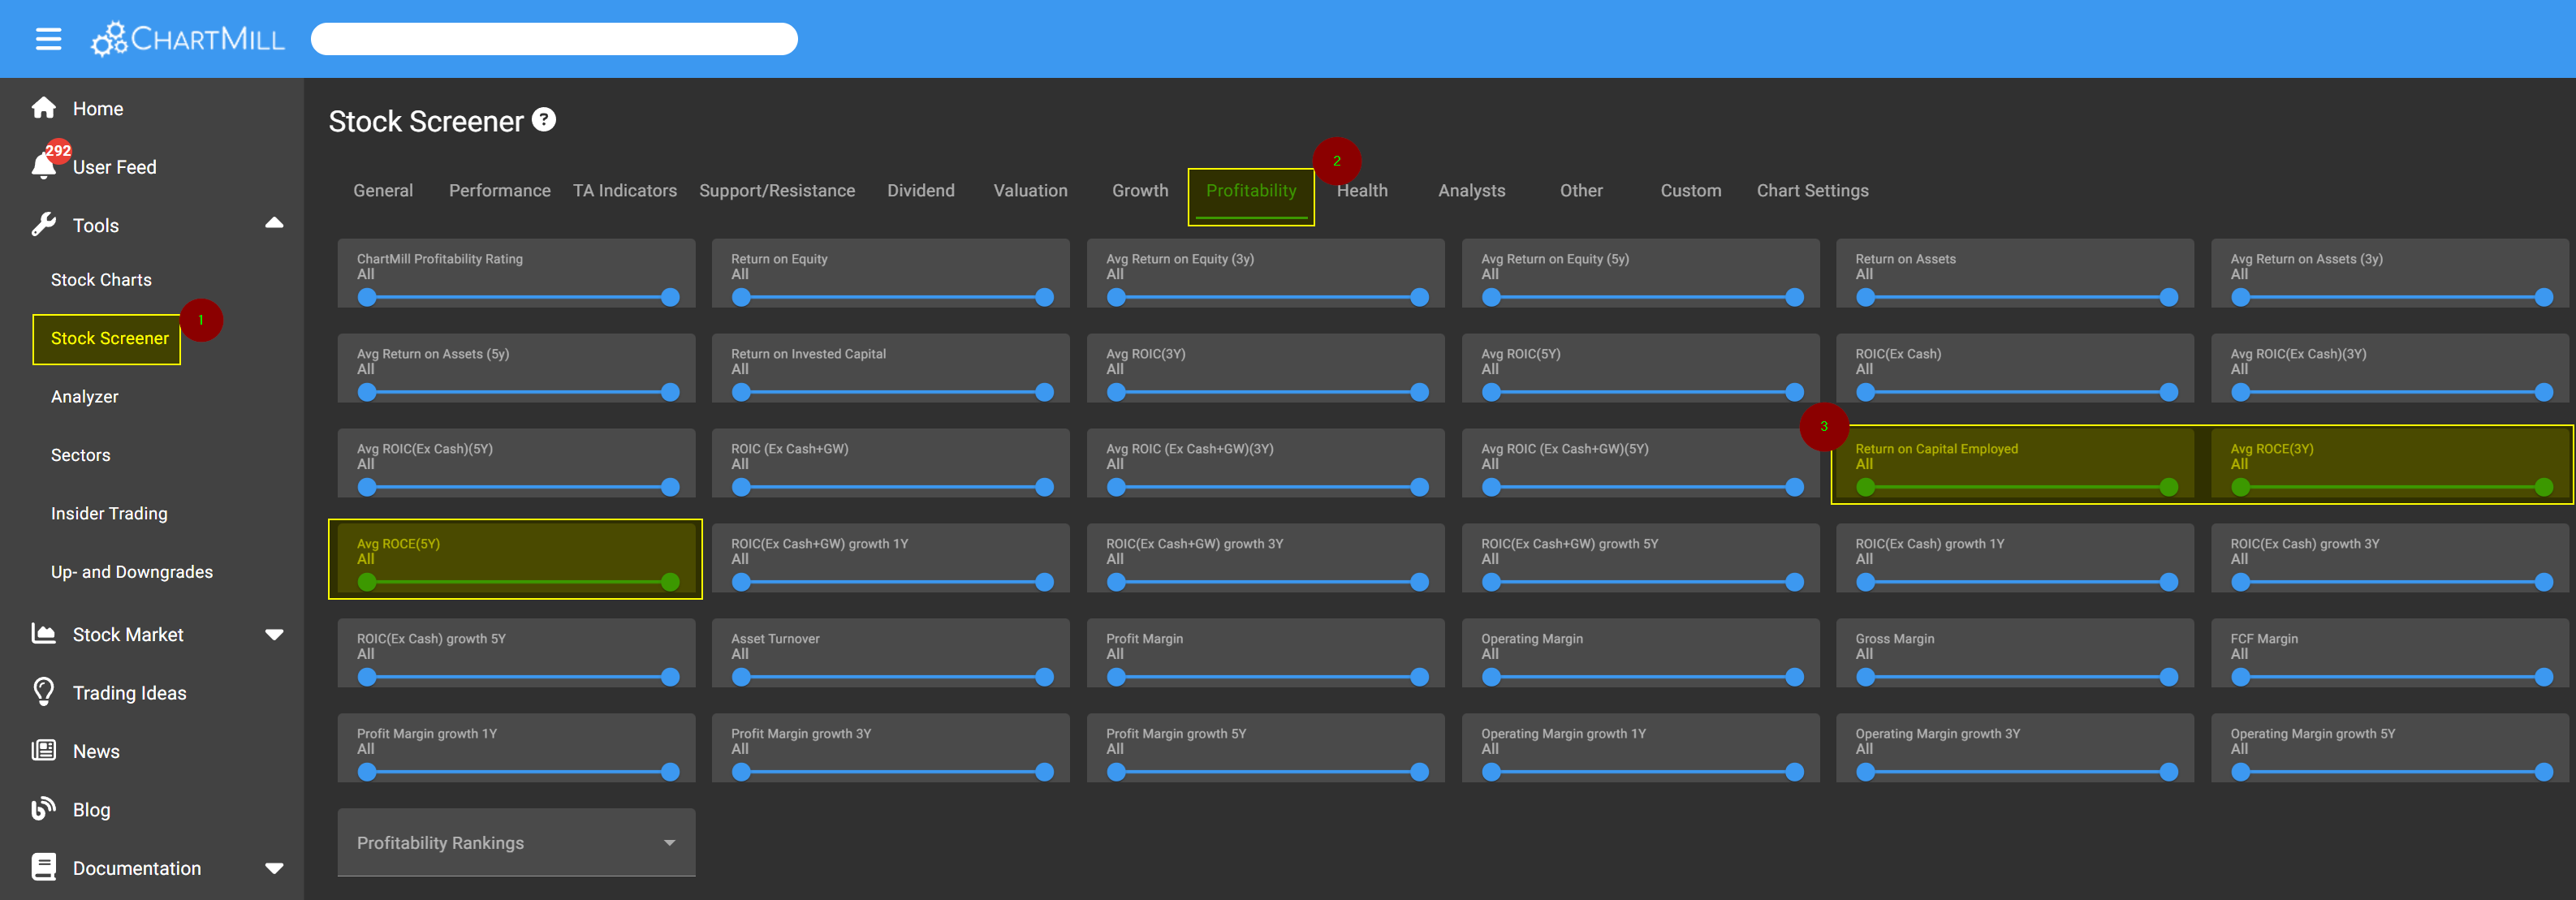
ROCE screening filter in ChartMill
Selecting companies based on their ROCE-result is available in ChartMill. To do so, go to the stock screener page (1) and select the ‘Profitability' tab (2) where the ROCE filter is visible in three variants (curent, 3Y and 5Y average) (3).
For example, this screen shows a list of US stocks (minimumprice $5 and excluding financials) with a minimum daily trading volume of 200k and whose ROCE is higher than 15% (average over the last 3 years).
Other Profitability ratios You Might Be Interested In...
Return on Assets Ratio (ROA) Explained
Return on Assets looks at returns from the perspective of total assets, not just equity as is the case with ROE. text
Return on Equity Ratio (ROE) Explained
Return on Equity approaches profitability from the perspective of equity. Read more...
Return on Invested Capital (ROIC) Explained
This Return on Invested Capital ratio provides insight into the extent to which a company efficiently allocates capital to profitable investments or projects, thereby generating returns. Read more...
Fundamental Profitability Filters
In this article we will discuss the fundamental filters related to the Profitability of a stock. Read more...