Piotroski F-score explained
INTRO
Are you a fundamental investor who focuses primarily on the long term and prefers to work methodically and objectively when researching and selecting the right stocks? Are you mainly interested in finding financially sound quality stocks that are listed at affordable prices?
Then this article is definitely worth reading!
In fact, in this article I will take a closer look at the Piotroski F-score, a proven strategy for investing in Value stocks. These are stocks that are believed to be undervalued when comparing the current stock price to a number of fundamental ratios such as sales, earnings growth, price-to-book value...
The score itself was developed by Professor Piotroski, an expert in fundamental analysis and financial reporting. He became best known for his 2000 paper, published by the University of Chicago (2002), entitled "Value Investing: The Use of Historical Financial Statement Information to Separate Winners from Losers." This describes a method that distinguishes the strongest financial companies from the rest and allows for significantly better returns than the S&P500.
A striking title, especially in academic circles. To claim that with a self-developed method you can structurally distinguish winners from losers is a bold statement that will make you vulnerable as a researcher.
The strategy itself is a sort of classification system, based exclusively on fundamental analysis, which results in a final score (1 to 9) indicating whether a share is worth buying or not (the higher the score the better). The strategy assumes that in this way stocks can be identified that will rise in the future as soon as their true potential is discovered.
The fact that we are publishing this article now is no coincidence. For the past 10 years, we have been enormously spoiled with ever-rising prices. This has made the market relatively expensive and the search for real bargains damned difficult. But the (succession of) recent events (Corona, the war in Ukraine, rising inflation, etc.) have also caused some high quality companies to suffer serious price drops. Price declines that cannot always be rationally explained if you consider the solid financial figures of the company. It is a fact that market uncertainty leads to sentiment-driven decisions and corresponding market volatility. And as a value investor, you can try to capitalize on that. Using the Piotroski F-score as a guide is definitely worth considering!
As icing on the cake, at the end of this article we will take a quick look at some recent purchases by perhaps the greatest bargain hunter of all time, Warren Buffet, and how his buying decision relates to the Piotroski F-score.
THE VALUATION CRITERIA
Without a doubt one of the great advantages of this score is the simplicity with which it is generated. After all, it is based on 9 criteria that can be used to score exactly 9 points. Either a company meets the condition and gets a point, or it doesn't and then the score for that specific part is zero.
The general starting point that companies must meet has to do with the price/book value. Piotroski stipulated that the formula should be applied only to the 20% of shares with the lowest price-to-book ratio. Now, it is true that a low price/book value is certainly not always an indication of an undervalued share; on the contrary, it could perfectly well be that the low price/book value is due to the fact that the company is in bad papers. That is precisely what Piotroski's 9 criteria are for. In addition to the low price/book value, the criteria serve to get a picture of the financial strength of the company. According to the author, companies that score high on the Piotroski scale in addition to their low price/book value are the only truly undervalued stocks that will outperform the rest in time.
The nine different criteria can be divided into three groups:
- Profitability, a measure of an organization's profit relative to its expenses (4 points)
- The liquidity, source of funds and the extent to which leverage is used (3 points)
- The degree of operating efficiency - (2 points)
Profitability (4)
- Positive return on assets in the current year (1 point).
- Positive operating cash flow in the current year (1 point).
- Higher return on assets (ROA) in the current period compared to the ROA in the previous year (1 point).
- Cash flow from operations are greater than Net Income (1 point)
The first three points indicate the extent to which a company is able to generate income through its operations, the positive cash flow ensures that the company can continue to meet all its obligations. The last point is a measure to find out if a company is sufficiently able to finance future growth.
Liquidity, source of funds and the extent to which leverage is used (3)
- Lower ratio of long term debt in the current period compared to the value in the previous year (1 point).
- Higher current ratio this year compared to the previous year (1 point).
- No new shares were issued in the last year (1 point).
These three elements serve to monitor any changes in a company's capital structure.
Item 1 says something about the long-term debt compared to the previous year.
The 'current ratio' in point 2 indicates to what extent a company can pay off its debts in the short term with the available cash. The higher the current ratio the more liquid a company is.
Item 3 verifies that there is no dilution due to the emission of new shares in the last year. If that is the case, you should in any case ask yourself what the underlying reason is. After all, shares are emitted to attract capital. Equity that can be used to grow faster and harder (positive) or to pay off already existing debt (negative).
Operating Efficiency (2)
- A higher gross margin compared to the previous year (1 point)
- A higher asset turnover ratio compared to the previous year (1 point)
These are used to measure the degree of efficiency in business operations. A higher gross margin can mean two things. Either the company is simply making more profit or it has found a way to reduce costs. Of course, a higher sales ratio is also positive because it means that the company has generated more revenue with the same assets which in itself means higher efficiency.
INTERPRETATION OF RESULTS
Companies with an F-score of 2 or lower are considered very weak and may even be potential short candidates. In contrast, companies scoring 8 or 9 are very strong and are considered buy candidates. Keep in mind that the F-score is not applied to insurers and banks.
As previously addressed in this article, the valuation criteria were applied to stocks that met the low price/book value requirement. However, it was later found that even without this exclusion filter, the F-score was still useful.
Piotroski himself tested his method on financial figure data between 1976 and 1996 and was thus able to show that stocks with an F-score of more than 8 - which were consequently identified as undervalued - produced a return that exceeded the index by about 7.5% each year
1996 is quite a while ago but later Piotroski F-score backtests between 1999 and 2011 have also shown that the F-score leads to significantly better results. Despite this period only covering 12 years, it should not be forgotten that it was a very turbulent period with the dotcom bubble in 2000 and two negative market periods (2001-2003 and 2007-2009).
And again, through the site of the American Association of Individual Investors (AAII) you can get an overview of the results for both the past year, the past five years as well as 10 years and even since the F-score saw its birth. The F-score is, by the way, one of the rare methods that also managed to achieve a positive return in 2008 (credit crisis).
If you look at the results of the last 10 to 15 years, you will notice that the F-score method has done significantly worse than the index. This in itself is not surprising. The current bull market has lasted for more than 12 years and in those circumstances it is mainly growth stocks that flourish.
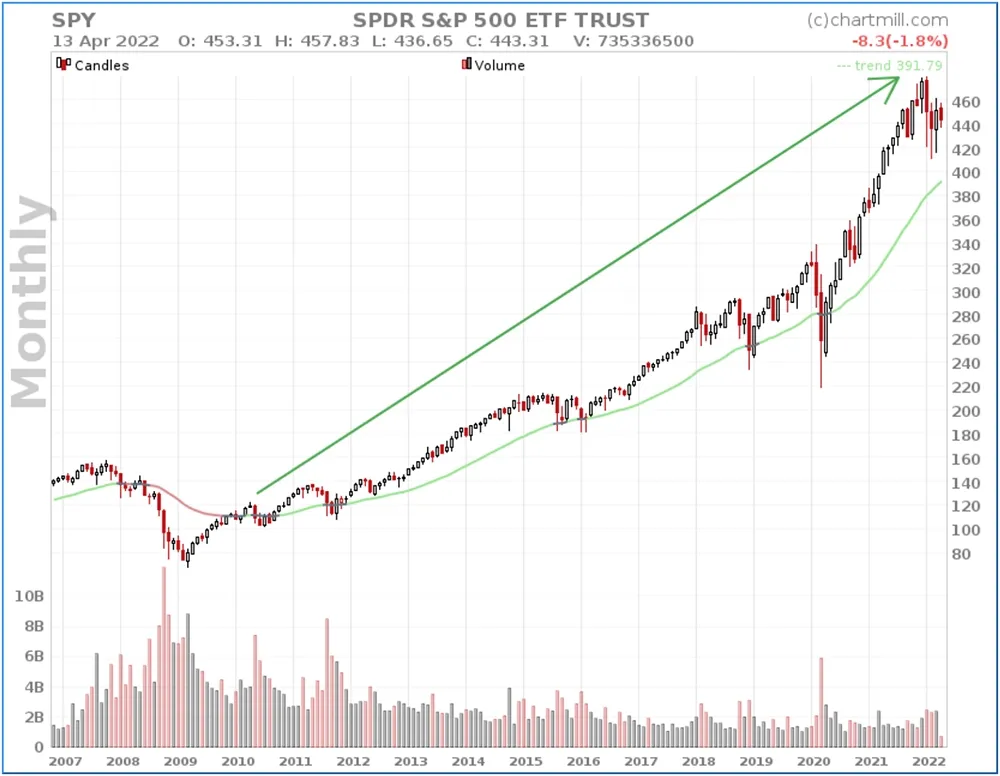
However, if you look at the performance over the longer term, it is the value stocks that emerge as clear winners.
Whether growth stocks will continue to outperform in the future is anyone's guess; the least one can say is that market conditions have changed significantly in recent years and are of such a nature that the price levels of some value stocks - mainly due to recent price declines - are once again attracting the attention of bargain hunters.
ADVANTAGES OF THE PIOTROSKI F-SCORE
- Without question the objective nature of the score, either a company meets the specific criteria or it does not. There is no need for subjective interpretation of the data.
- Moreover, the F-score can also be applied in emerging markets and to companies of different sizes, making its coverage considerable.
POSSIBLE PITFALLS
- One of the advantages is at the same time a disadvantage when using this F-score. It excludes the use of more subjective elements. Think for example of the quality of management or the interpretation of the evolution of financial ratios over several years. The issue of new shares in the last fiscal year, for example, leads inevitably to a zero score. The model therefore does not take into account the reason why this happens, and this nuance can be important.
- Very capital-intensive companies that have to take on huge debts anyway in order to remain efficient will generally achieve low scores in the Piotroski model.
Although the model is very strictly defined, you can always set additional filters yourself or exclude them.
HEWLETT PACKARD (HPQ), OXIDENTAL PETROLEUM (OXY) AND WARREN BUFFET (BRK.A)
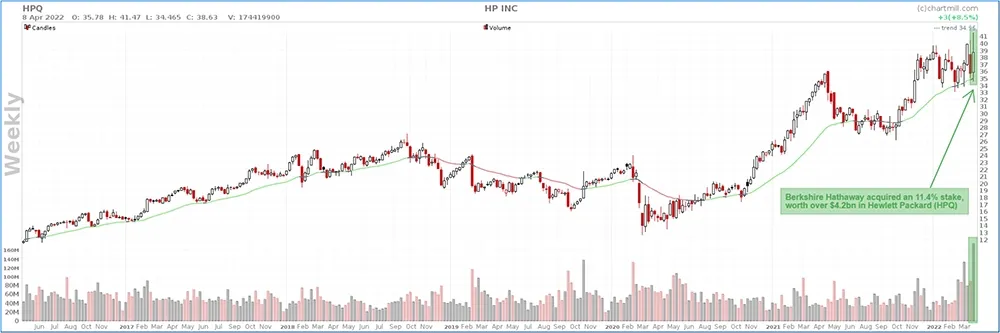
Thursday, April 07, 2022, it became public that investor Warren Buffet had taken a stake of more than 11% in HP stock (HPQ). This represents a value of over $4.2 billion.
The stock rose at market opening and closed the trading day 15% higher. However, this short-lived "Buffet effect" is not the reason we are referring to this example.
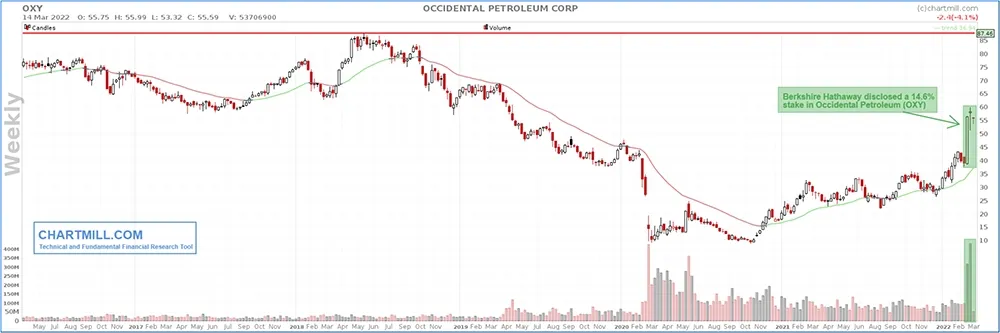
By the way, HP was not the only investment Berkshire Hathaway made recently. In March, sequential purchases were also made in Occidental Petroleum (OXY)...
Those who like to dig a little deeper to find out why Buffet invested money in just these two companies can best start their search online. Numerous articles are available in which that subject is addressed.
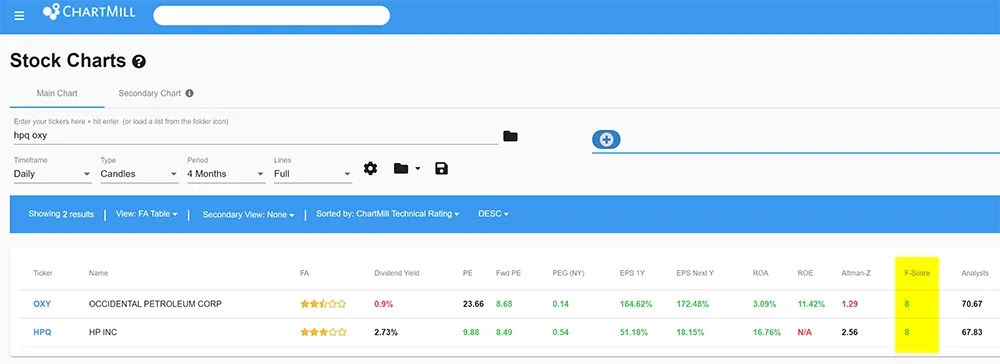
However, as a result of this article, we are particularly curious to know how these recent purchases relate to the Piotroski F-score method. Below are the two stocks with the corresponding financial ratios.
Below are the long-term charts showing the timing of Berkshire Hathaway's (BRK.A) recent purchases.
Being aware that high Piotroski F-scores of 8 to 9 are very exceptional, it is once again confirmed that the now 91-year-old Buffet continues to fish in the pond of value stocks considered cheap. On the other hand, the fact that the two selections achieve such high exceptional F-scores is a confirmation that the method is able to detect these types of shares at an early stage.
In this separate article, you will learn how to use ChartMill to find stocks based on their Piotroski F-score.