Market Monitor Trends (SPY, QQQ, IWM) and Breadth May 29
By Kristoff De Turck - reviewed by Aldwin Keppens
Last update: May 29, 2025
(All data & visualisations by ChartMill.com)
Daily Market Trend Analysis – May 28, 2025 (After Market Close)
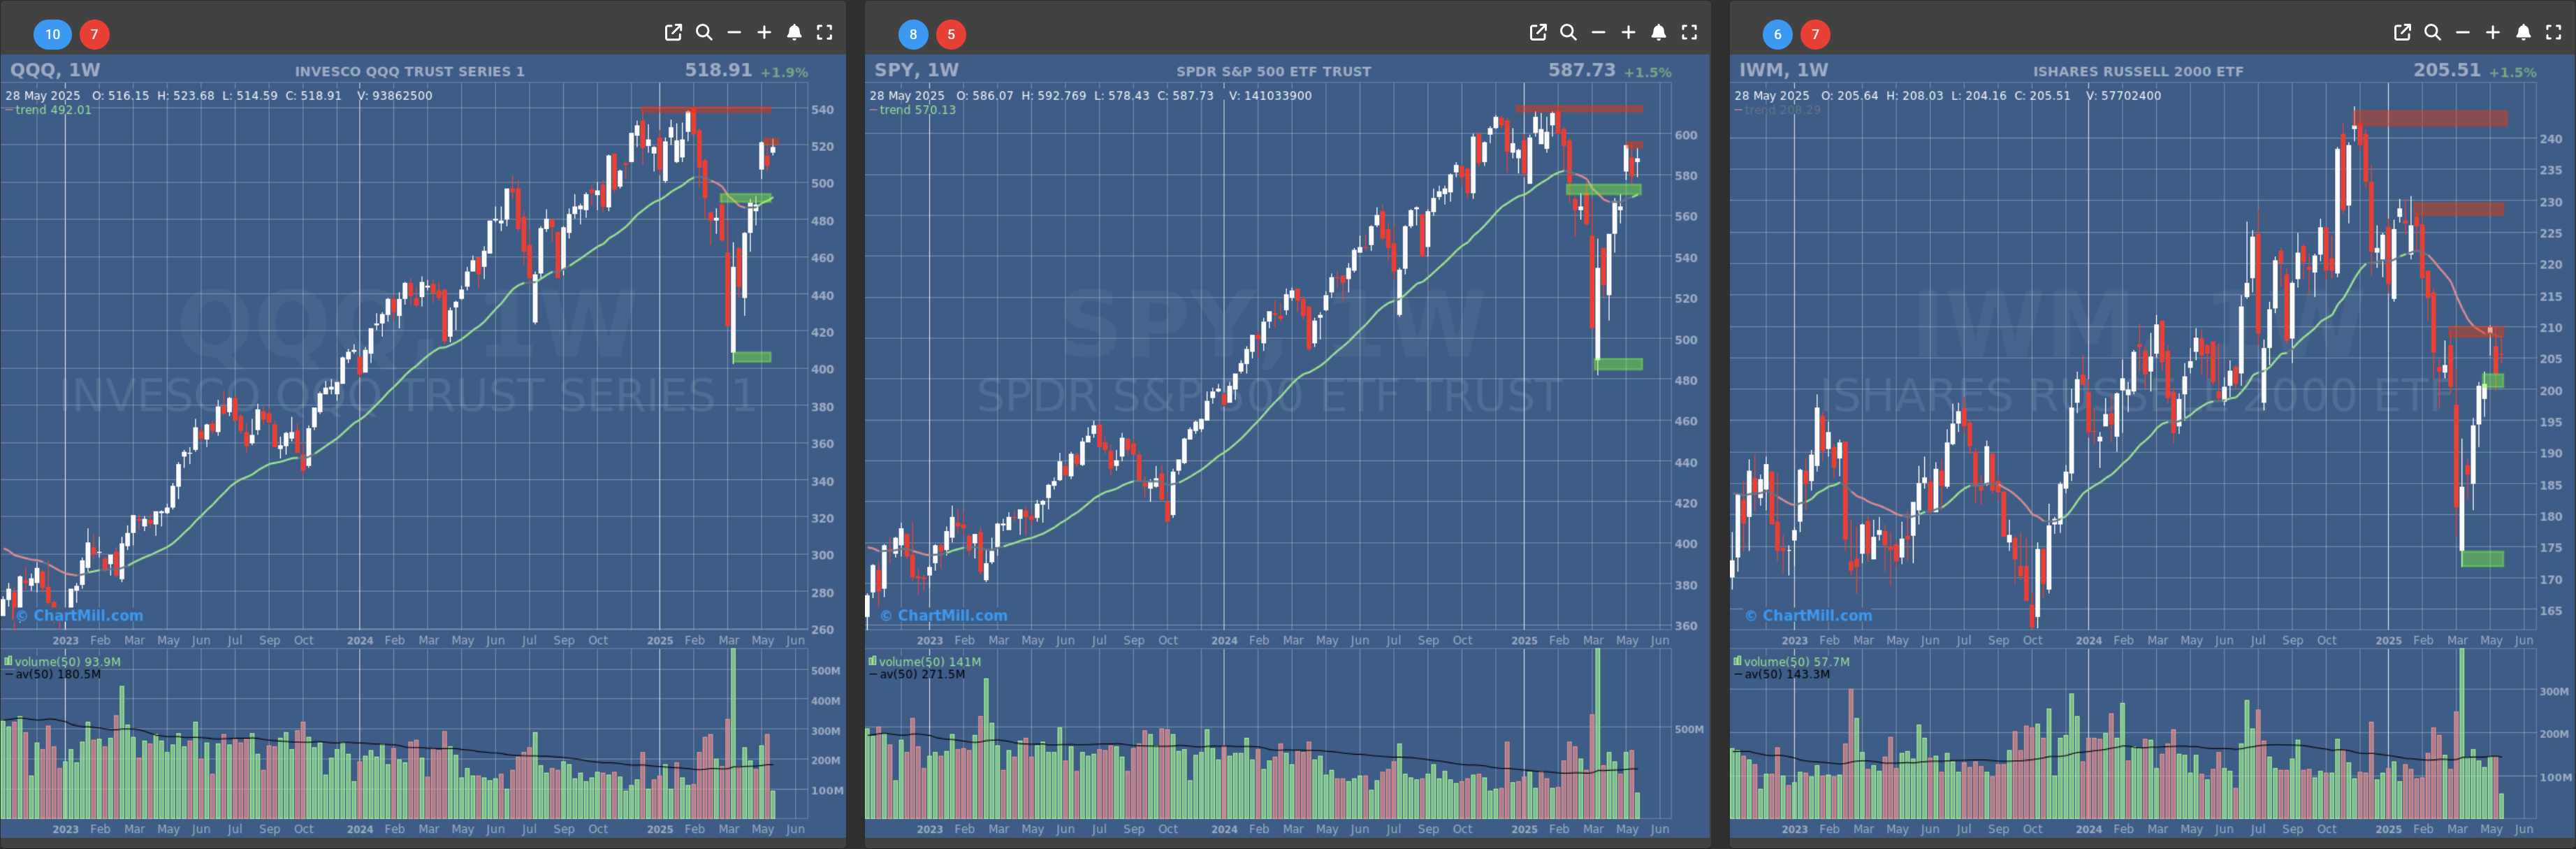
SPY and QQQ barely moved yesterday, ending slightly lower. A clear double top is visible on the daily chart. Curious to see if Nvidia's strong results today can give the markets a lift.
Short Term Trend

- Short-Term Trend: Bullish (no change)
- Next Support at $570
- Next Resistance at $595
- Volume: Slightly Below Average (50)
- Pattern: Double Top, Tight Down Day
- Short-Term Trend: Bullish (no change)
- Next Support at $490
- Next Resistance at $520
- Volume: Slightly Below Average (50)
- Pattern: Double Top, Tight Down Day
- Short-Term Trend: Bullish (no change)
- Next Support at $200
- Next Resistance at $205 & $210
- Volume: Below Average (50)
- Pattern: Down Day
Long Term Trend
- Long-Term Trend: Preliminary Positive (weekly candle), final result on Friday after market close. (from neutral)
- Long-Term Trend: Positive (no change)
- Long-Term Trend: Neutral (no change)
Daily Market Breadth Analysis – May 28, 2025 (After Market Close)
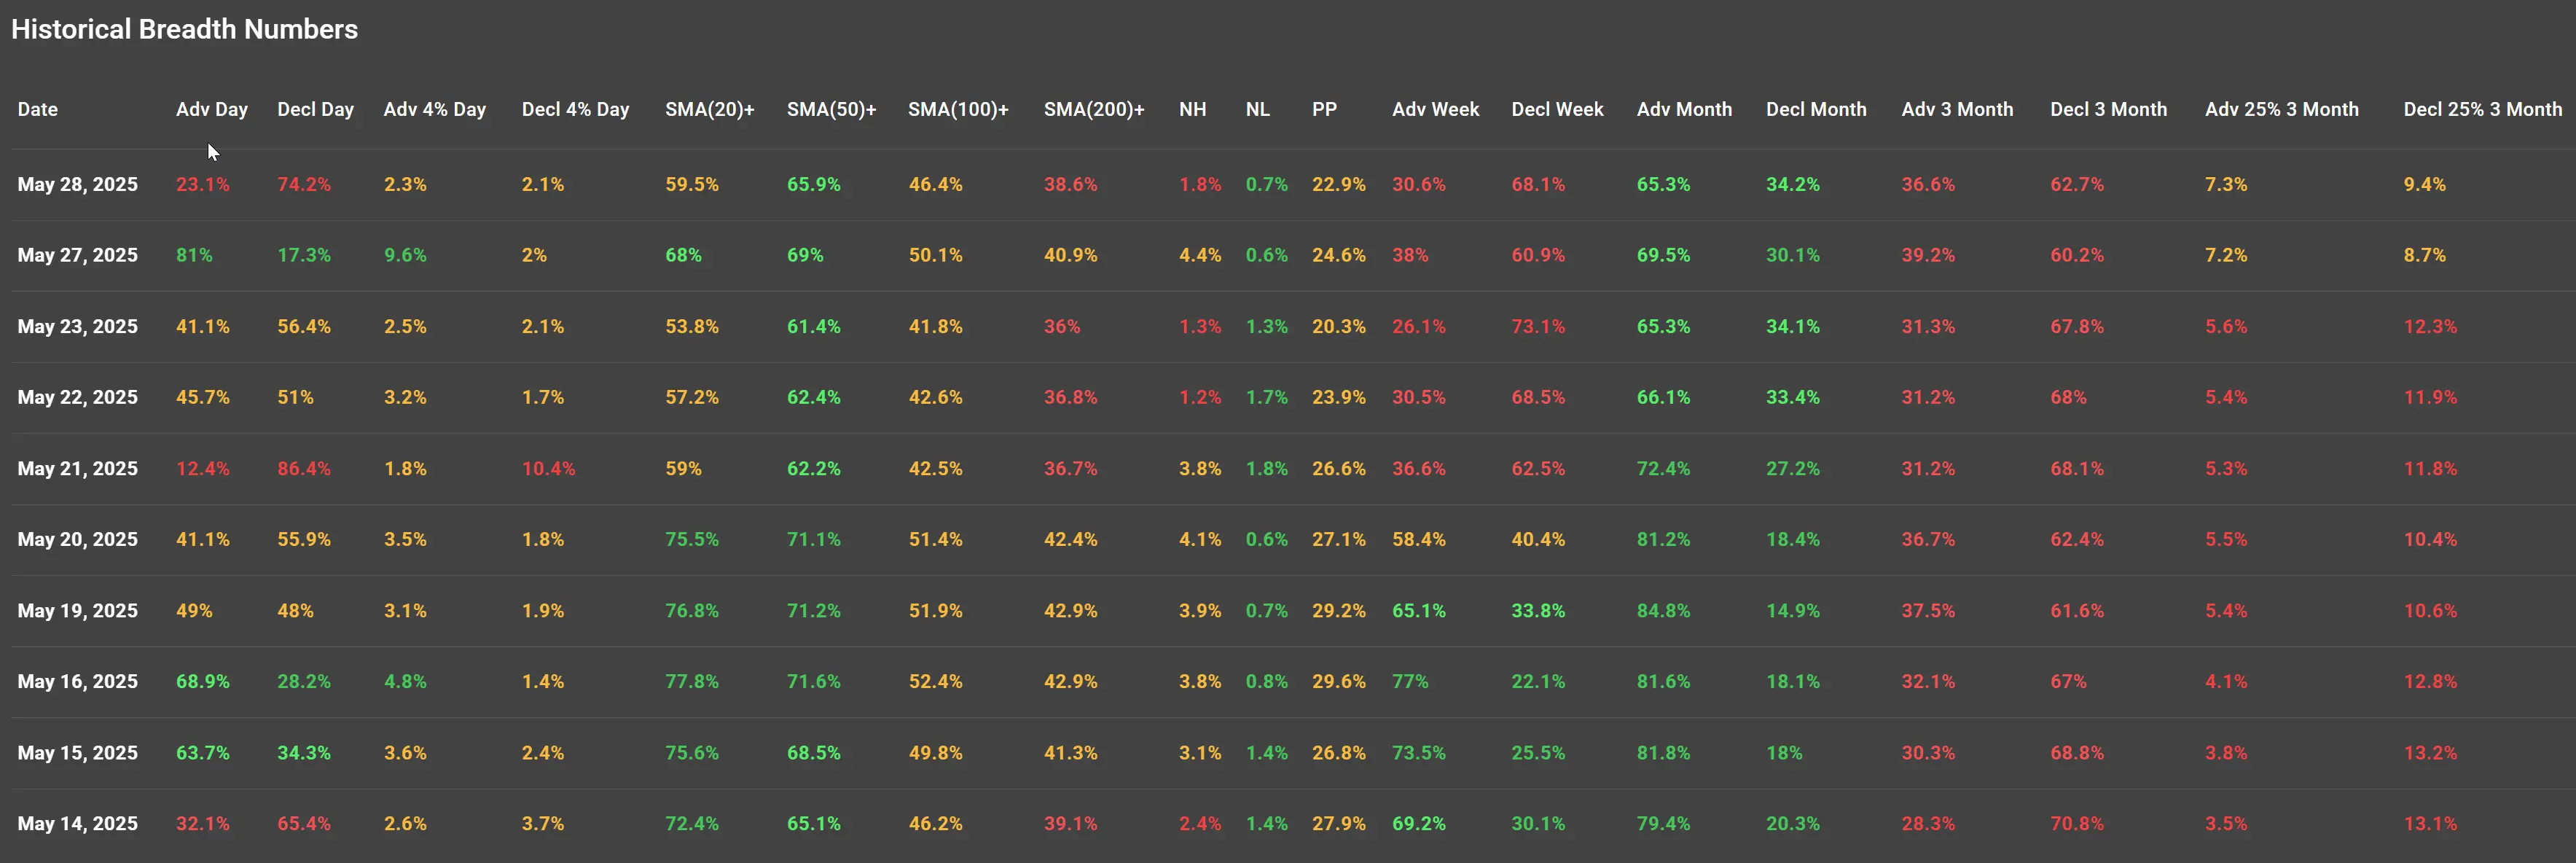
On May 28, just 23.1% of stocks advanced, while a significant 74.2% declined, indicating broad-based selling pressure. This marked a stark contrast from the previous session (May 27), when 81% of stocks had advanced. Such a reversal suggests increasing market indecisiveness and fragility.
Volatility in Breadth Participation
The percentage of advancing stocks has been fluctuating sharply in recent sessions, indicating unstable market sentiment:
- May 27: 81% Advancers
- May 28: 23.1% Advancers
- May 21: Just 12.4% of stocks advanced, while 86.4% declined, another major breadth washout.
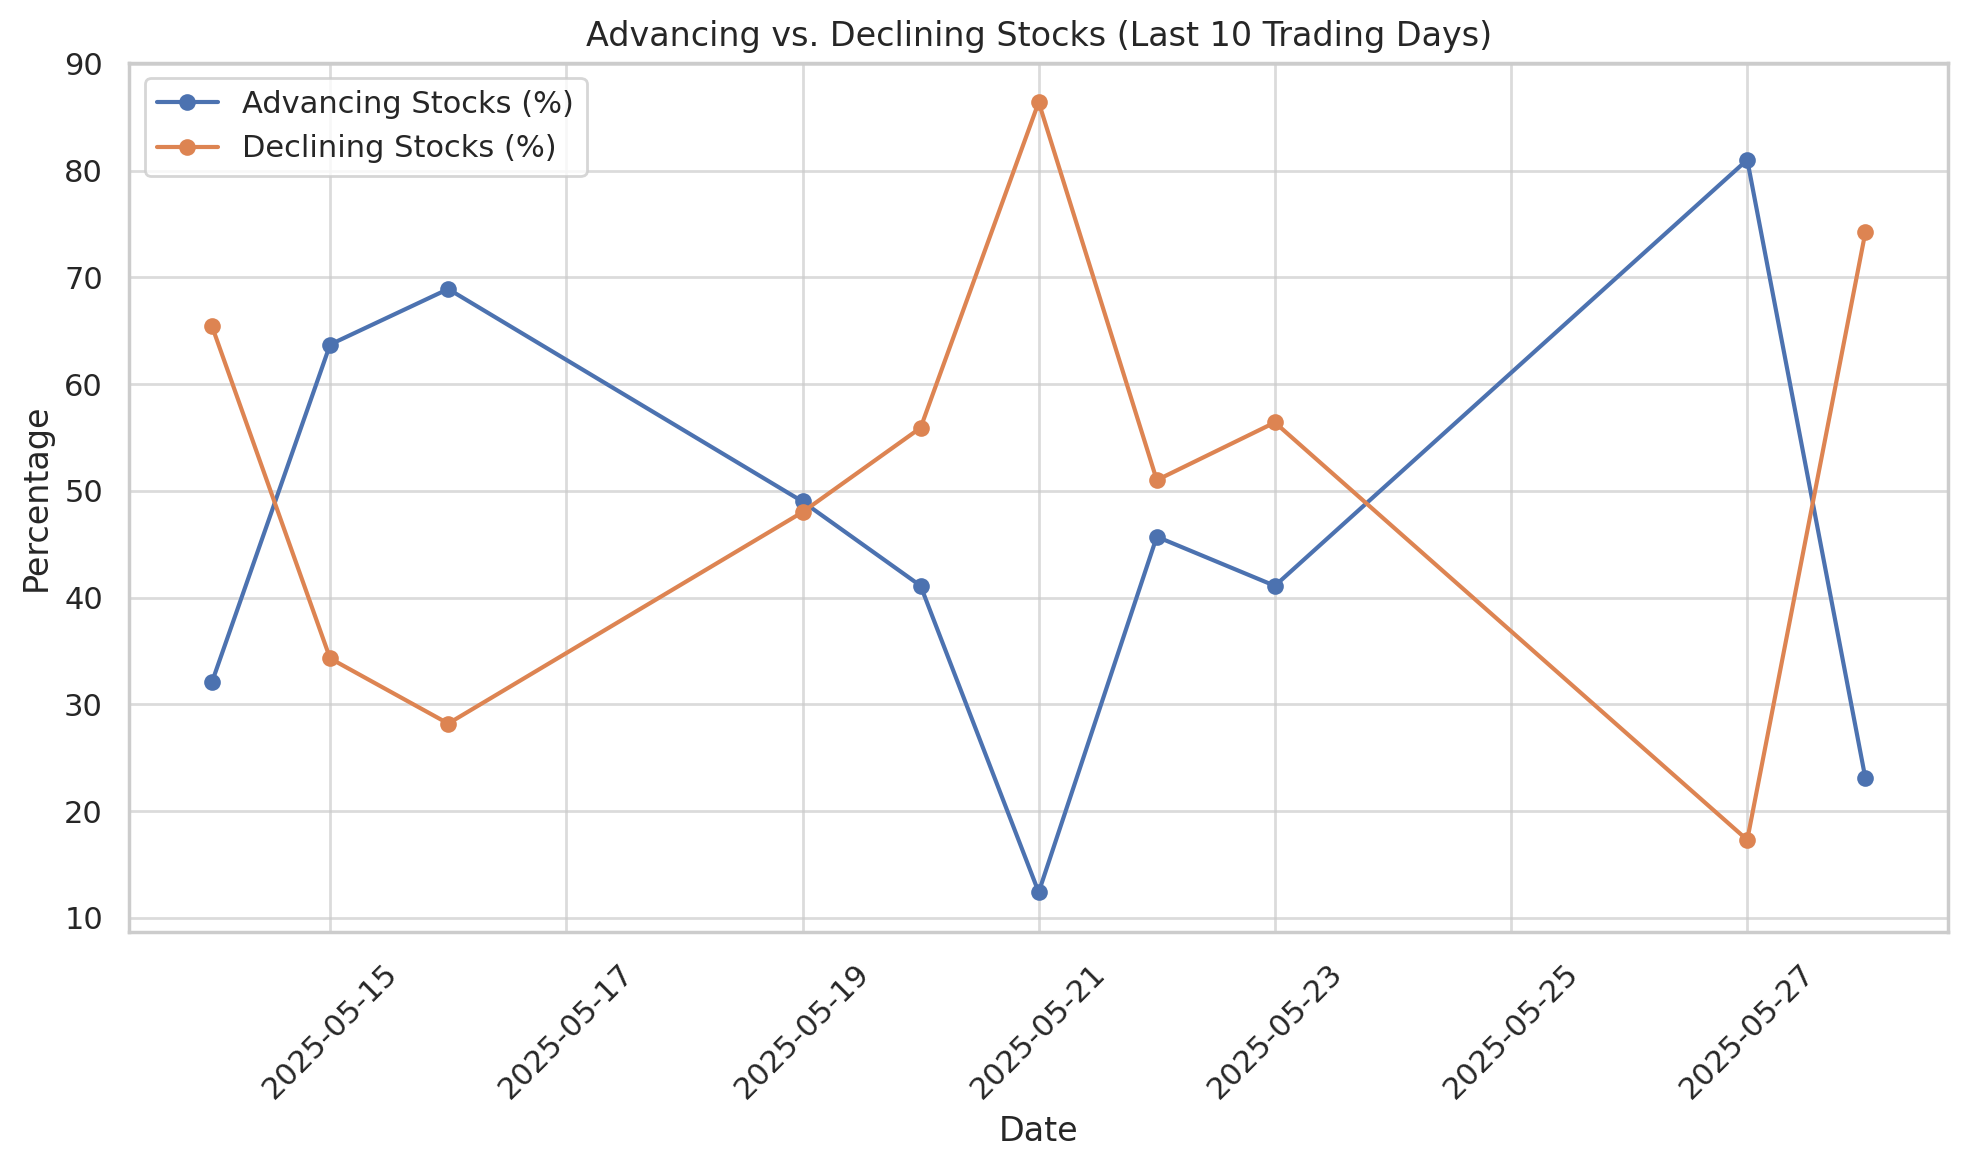
Visual 1 (above) shows how advancing vs. declining stocks have alternated between optimism and pessimism, reflecting investor uncertainty.
Breadth Internals: Fewer Stocks Above Key Moving Averages
- 65.9% of stocks were above their 50-day SMA
- Only 38.6% were above their 200-day SMA
These figures have been deteriorating slightly, particularly the 200-day SMA percentage, which remains stuck under 40%. This suggests that while some short-term momentum exists, longer-term technical strength is still lacking across the broader market.
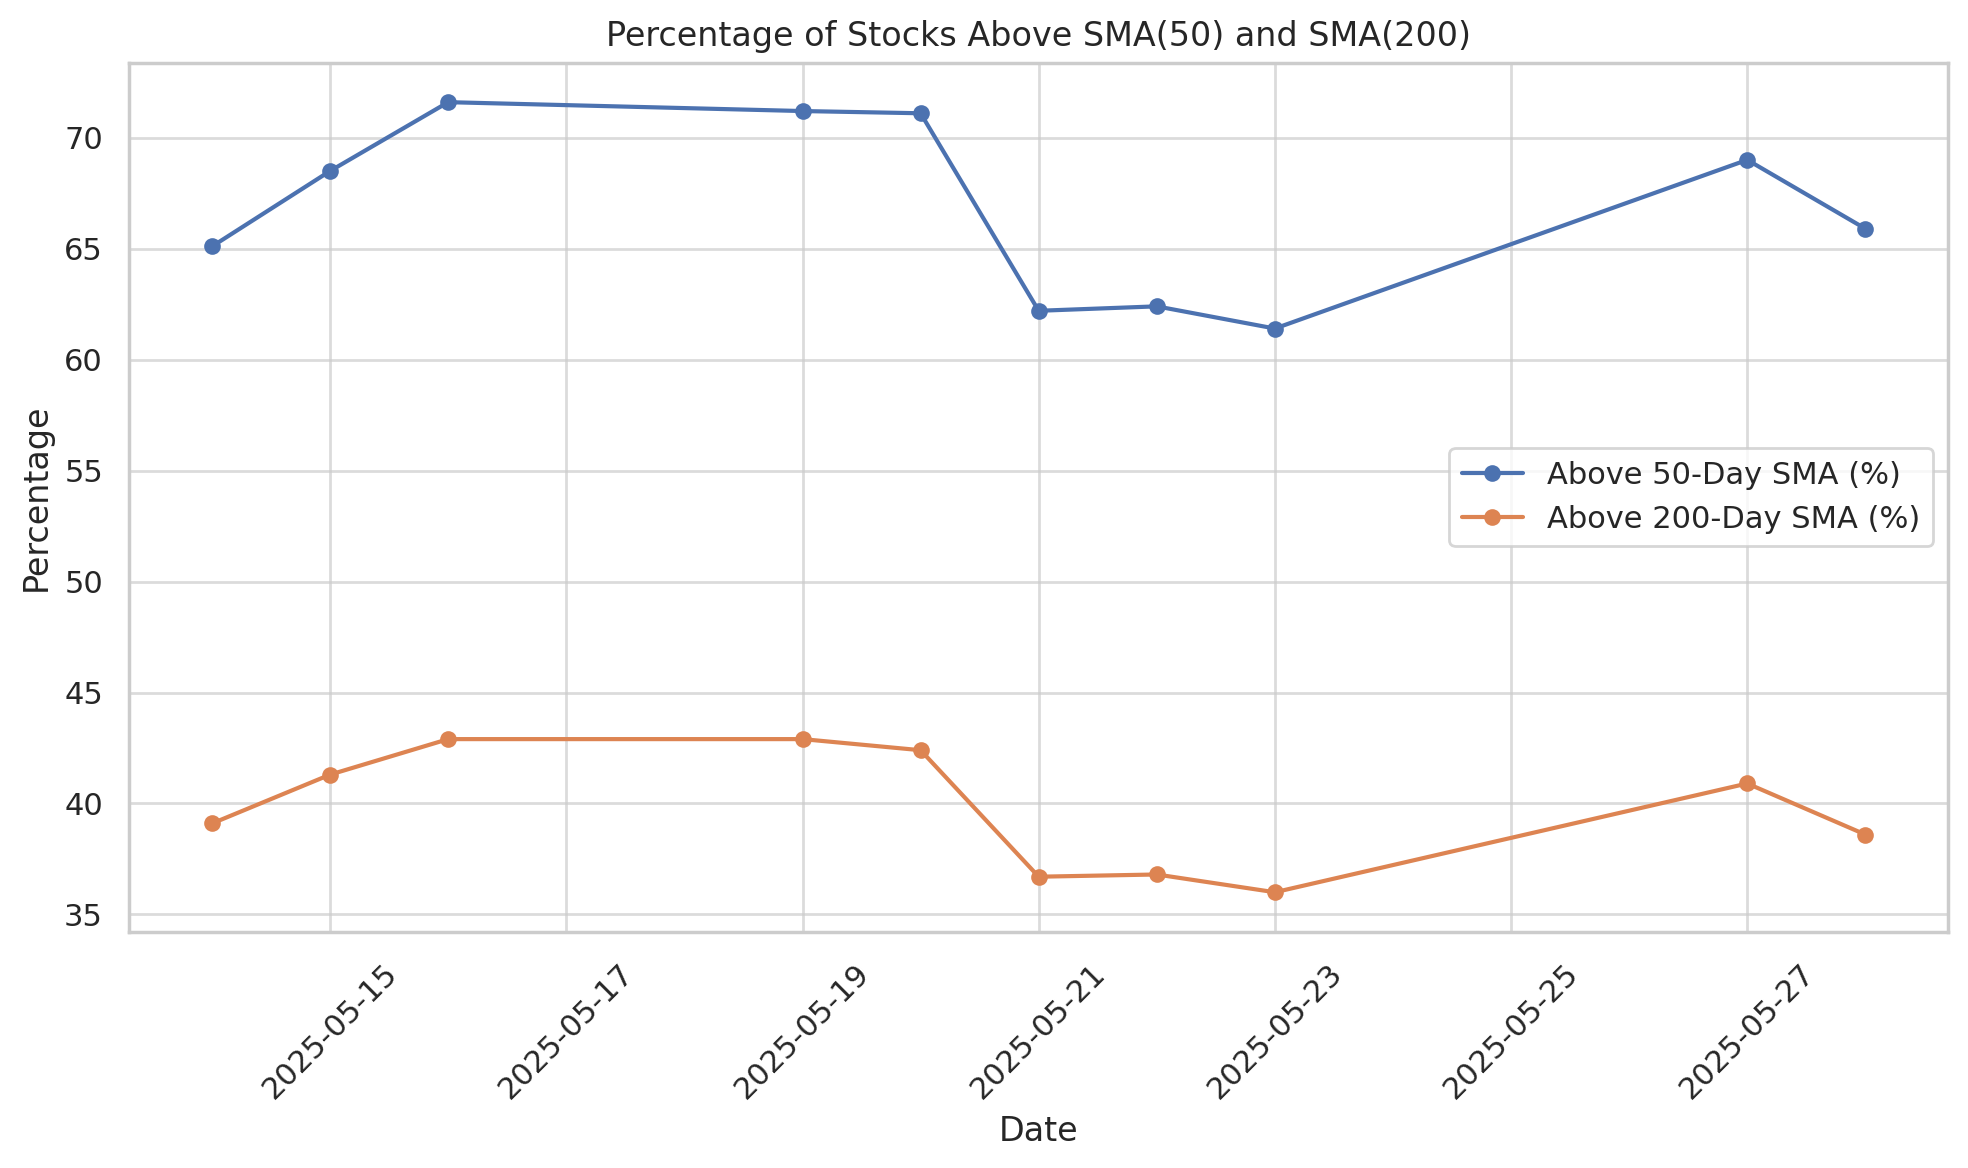
Visual 2 highlights this lag between short-term and long-term breadth strength.
Market Extremes: New Highs vs. New Lows
Another concerning signal is the sharp contraction in new highs (NH) and the persistent presence of new lows (NL):
- May 28: 1.8% NH, 0.7% NL
- Compared to May 27: 4.4% NH, 0.6% NL
While new lows are not exploding, the consistent lack of new highs, especially during volatile days, points to weak leadership and hesitancy among market participants to push stocks to fresh breakout levels.

Visual 3 captures the fading strength in new highs despite occasional bounce days.
Interpretation and Context
The May 28 sell-off came just one day after a strong session, confirming that bearish forces remain dominant and investors are quick to sell into strength.
Market participation remains fragile, as evidenced by the relatively small percentage of stocks above their 200-day SMAs.
New highs are not confirming any rally attempts, limiting upside conviction.
Conclusion
The breadth indicators signal a fragile and reactive market environment, prone to sharp swings and lacking sustained leadership. Bullish momentum may struggle to gain lasting traction.
Next to read: Market News, May 29
NYSEARCA:IWM (11/7/2025, 10:41:09 AM)
238.13
-2.22 (-0.92%)
NASDAQ:QQQ (11/7/2025, 10:41:09 AM)
603.48
-8.19 (-1.34%)
NYSEARCA:SPY (11/7/2025, 10:41:09 AM)
665.07
-5.24 (-0.78%)
Find more stocks in the Stock Screener
IWM Latest News and Analysis