

(All data & visualisations by ChartMill.com)
Daily Market Trend Analysis – September 23, 2025 (After Market Close)
Minor losses for all US index ETFs, new intraday high for IWM (Russell 2000 - small caps)
Short Term Trend

- Short-Term Trend: Positive (no change)
- Next Support at $660 - $650
- Next Resistance at ?
- Volume: Slightly Above Average (50)
- Pattern: Down Day - Inside Day Candle
- Short-Term Trend: Positive (no change)
- Next Support at $590
- Next Resistance at ?
- Volume: Well Above Average (50)
- Pattern: Down Day - Inside Day Candle
- Short-Term Trend: Positive (no change)
- Next Support at $235
- Next Resistance at $245
- Volume: At Above Average (50)
- Pattern: Down Day - Doji Candle - New Intraday High
Long Term Trend

- Long-Term Trend: Positive (no change)
- Long-Term Trend: Positive (no change)
- Long-Term Trend: Positive (from neutral)
Daily Market Breadth Analysis – September 23, 2025 (After Market Close)
The latest market breadth data for Tuesday, September 23, 2025, shows a noticeable pullback in participation compared to Monday’s session.

Declining stocks once again outnumbered advancers (57.1% vs. 39.7%), reversing the previous day’s positive tilt. Only 3.1% of stocks advanced more than 4%, while 2.6% declined by that margin, indicating muted large-cap leadership on both sides.

Looking at moving average participation, the broader trend remains intact: 61.5% of stocks are above their 20-day SMA, 69.5% above the 50-day, 70.9% above the 100-day, and 64.1% above the 200-day.
These levels are nearly unchanged from Monday and confirm that the medium- to long-term structure is holding steady despite short-term weakness.
New highs (10%) slightly edged up versus yesterday (9.5%), while new lows (1.5%) remained subdued, suggesting that selling pressure was controlled.
At the weekly level, advancing issues slipped to 54.3% against 44.4% decliners, while the monthly breadth picture remains supportive with 71.5% of stocks positive over the past three months.
Importantly, the percentage of stocks up more than 25% in that period (17.3%) held close to prior readings, showing resilience in leadership pockets.
Comparison to the previous session (Monday, Sept 22):
Yesterday’s data suggested a neutral stance with a positive bias, driven by a healthier balance of advancers (55.1%) versus decliners (41.8%).
Today’s reversal highlights how fragile this bias remains in the short term. However, because longer-term breadth indicators remain broadly stable, the pullback looks more like consolidation than a structural shift.
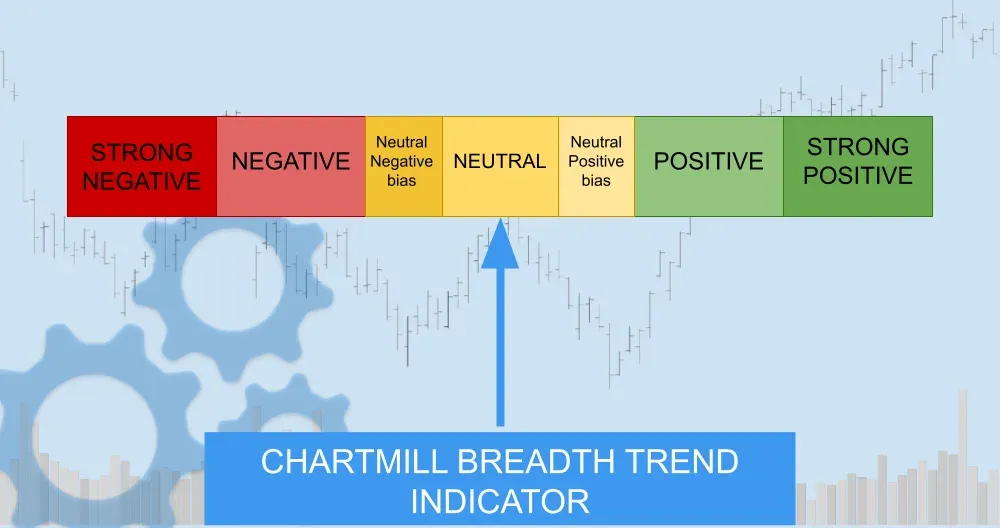
Breadth Trend Rating: Neutral
The market breadth trend slips back to neutral. Short-term weakness outweighs Monday’s brief positive momentum, but the medium- to long-term participation metrics continue to support a steady underlying trend.
Summary: Market breadth weakened on Tuesday as decliners once again outpaced advancers, undoing Monday’s positive tilt.
While short-term participation is fragile, the stability in longer-term breadth metrics signals that the overall market structure remains intact, keeping the trend neutral for now.
Kristoff - ChartMill
Next to read: AI Stocks Weigh on Wall Street as Fed Cautions on Risks