

(All data & visualisations by ChartMill.com)
Daily Market Trend Analysis – September 08, 2025 (After Market Close)
Narrow ranges for all US major index-ETF's
Short Term Trend
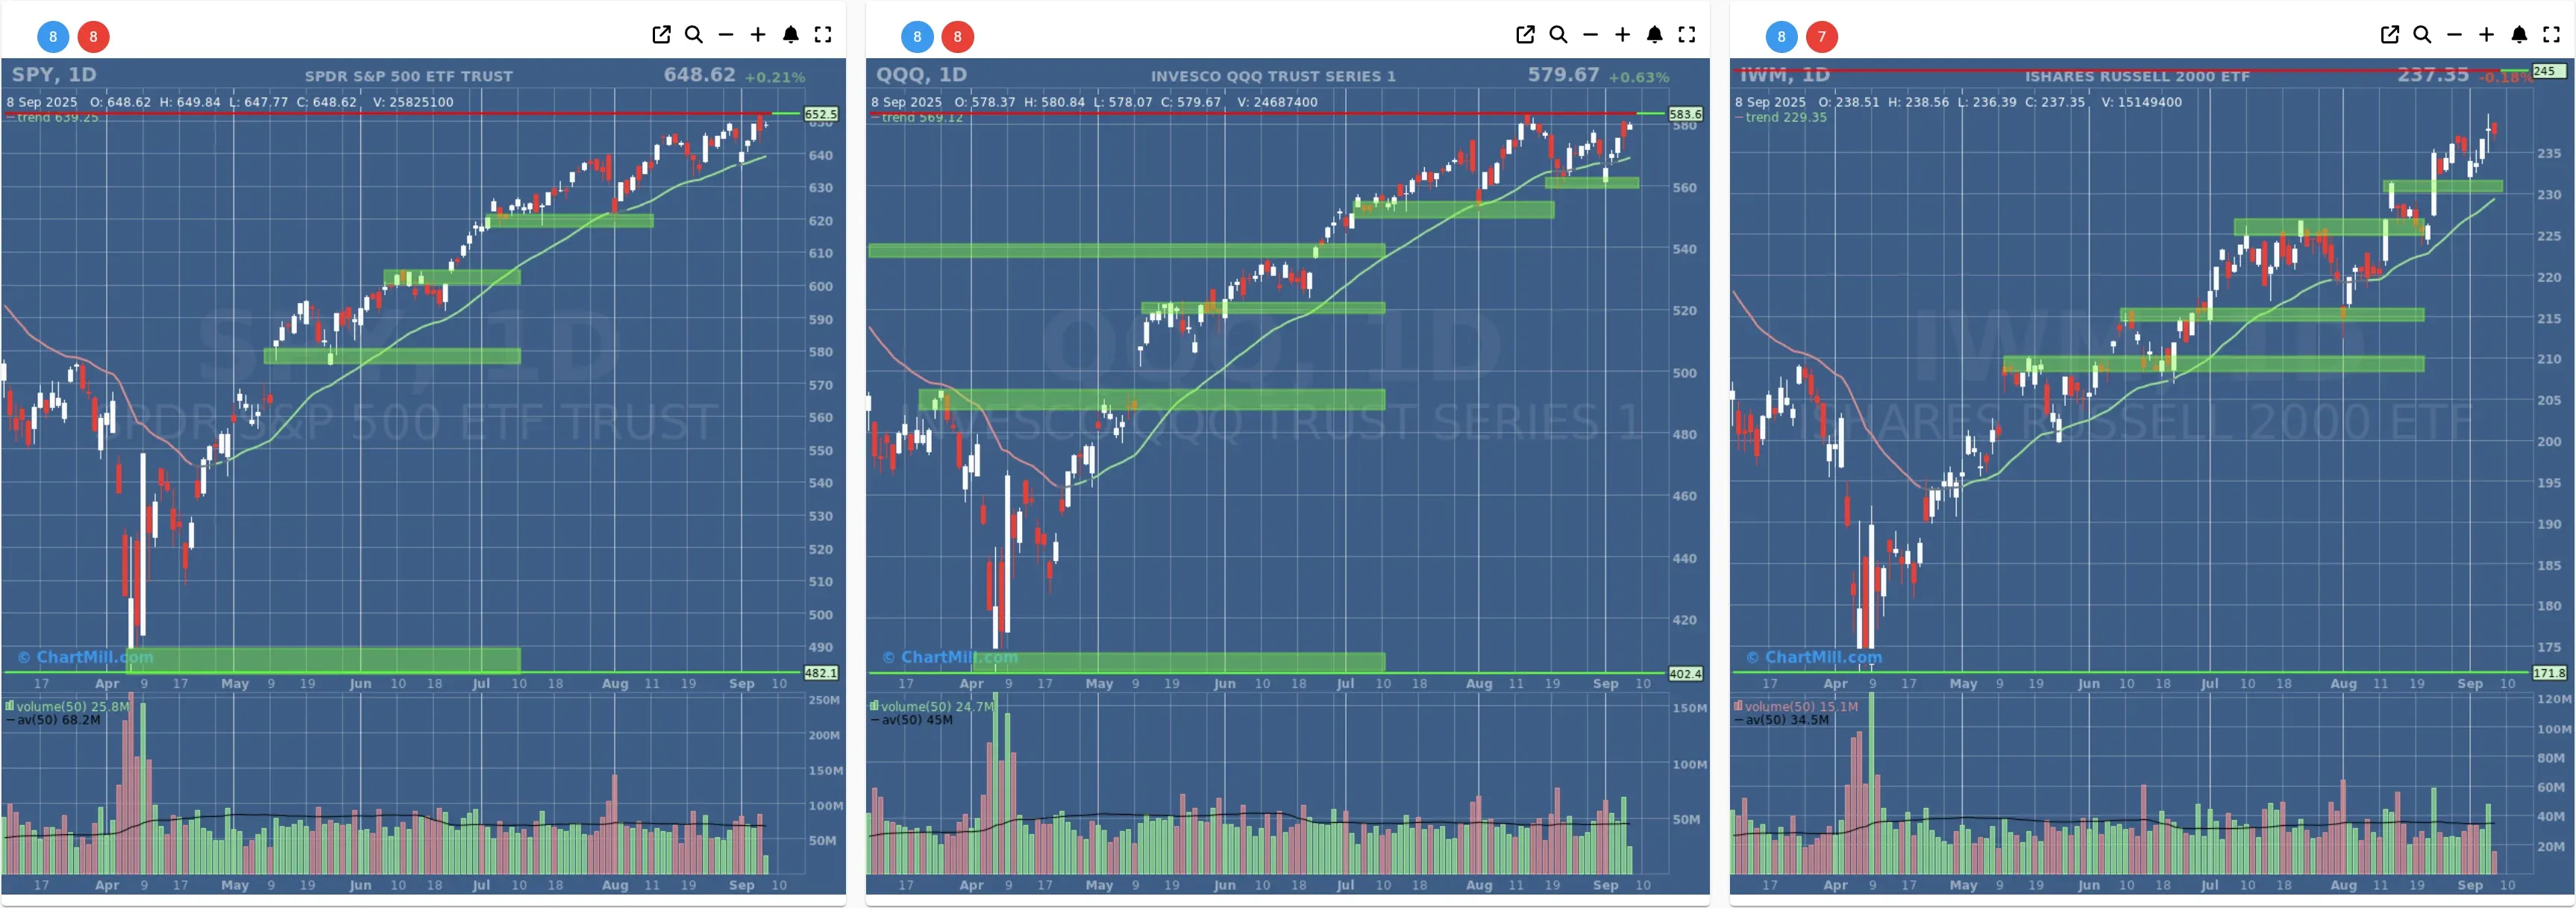
- Short-Term Trend: Positive (no change)
- Next Support at $640 - $630
- Next Resistance at $652
- Volume: Far Below Average (50)
- Pattern: Up Day - Inside Day Candle - Doji Candle
- Short-Term Trend: Positive (no change)
- Next Support at $560
- Next Resistance at $583
- Volume: Far Below Average (50)
- Pattern: Up Day - Inside Day Candle
- Short-Term Trend: Positive (no change)
- Next Support at $225 - $230
- Next Resistance at $237
- Volume: Far Below Average (50)
- Pattern: Down Day - Bearish Engulfing Candle
Long Term Trend
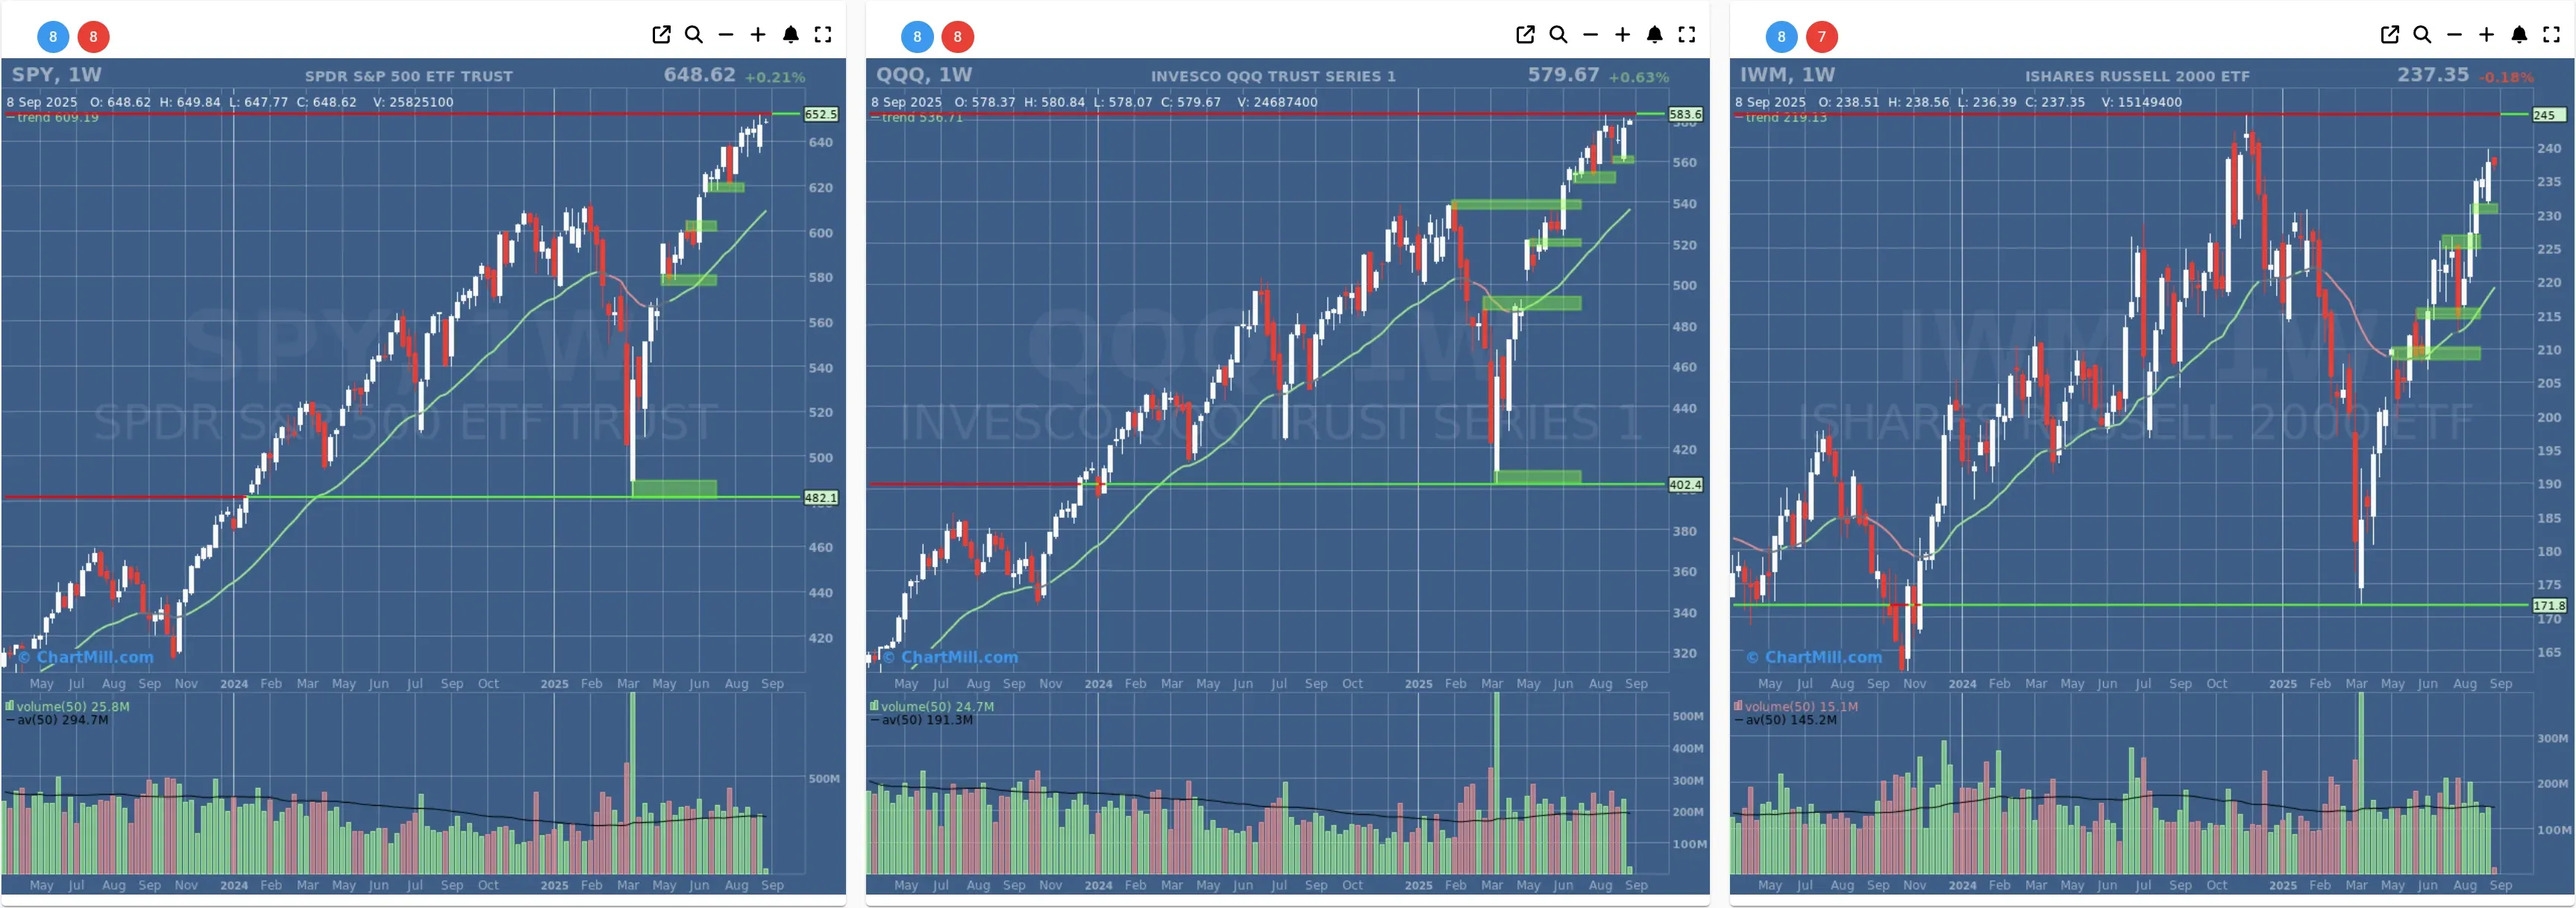
- Long-Term Trend: Positive (no change)
- Long-Term Trend: Positive (no change)
- Long-Term Trend: Positive (from neutral)
Daily Market Breadth Analysis – September 08, 2025 (After Market Close)
After a mixed week of volatile swings, market breadth on September 8, 2025, showed signs of stabilization. However, the narrow leadership and tepid momentum in key forward-looking metrics indicate that the rally lacks broad conviction. The trend remains cautiously neutral with an underlying need for stronger participation.
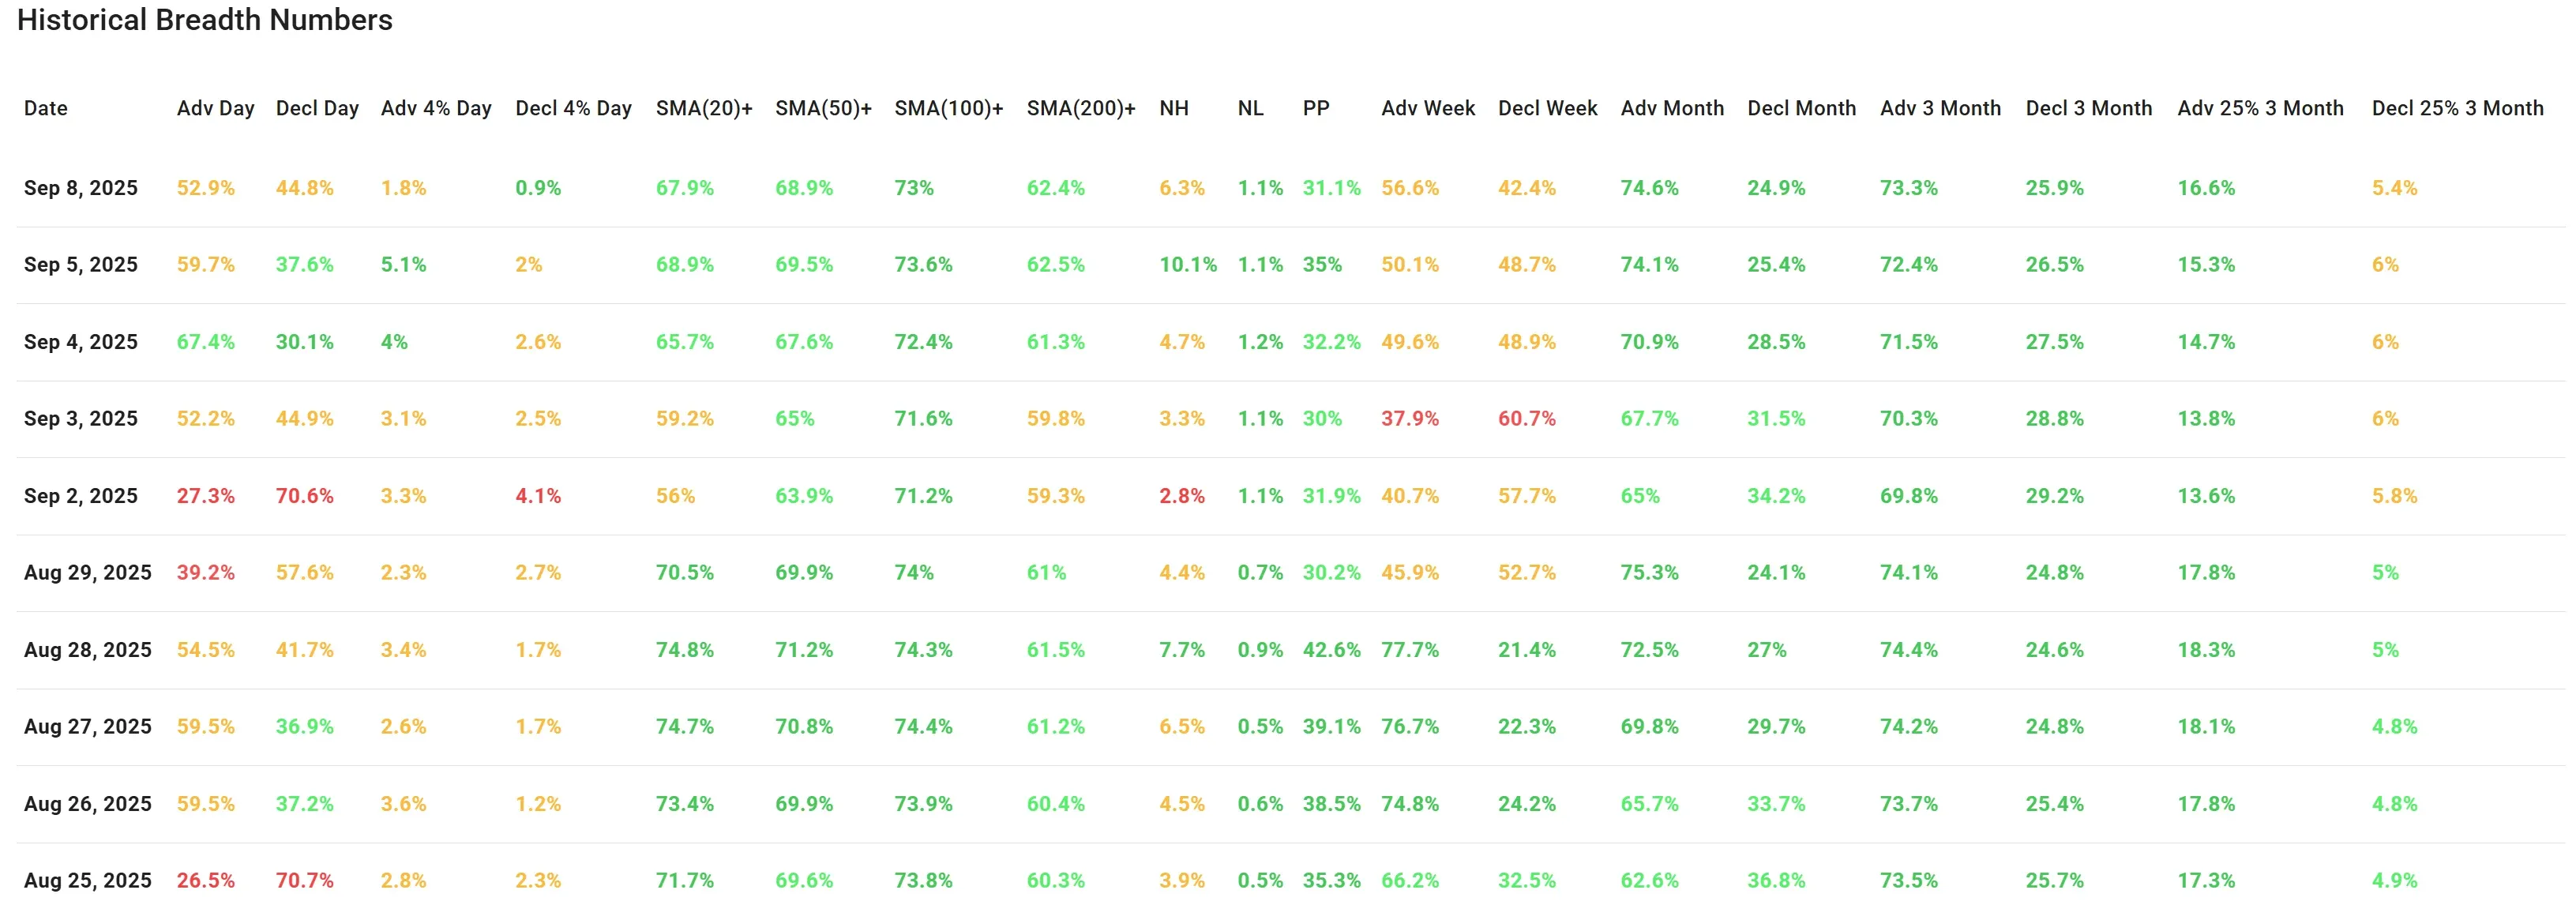
Advancing vs. Declining:
Advancing stocks came in at 52.9%, slightly outweighing declining issues (44.8%). This is a modest improvement from September 3, but weaker than the strong advance seen on Sep 4–5.
High Momentum Movers:
-
Only 1.8% of stocks advanced more than 4%, a sharp drop from 5.1% two sessions ago.
-
Just 0.9% of stocks declined more than 4%, indicating that extreme downside moves were limited.
Moving Average Participation:
Stocks above key SMAs remain solid:
-
SMA(20)+: 67.9%
-
SMA(50)+: 68.9%
-
SMA(100)+: 73.0%
-
SMA(200)+: 62.4%
These numbers have held relatively stable since early September and suggest that medium- and long-term trends are still intact for a majority of stocks.
New Highs vs. New Lows:
-
New Highs (NH): 6.3%
-
New Lows (NL): 1.1%
While new highs ticked up from earlier in the week, the figure is still far from impressive, especially compared to September 5’s 10.1%.
Short- to Intermediate-Term Breadth Metrics
Weekly Breadth:
-
Advancers: 56.6%
-
Decliners: 42.4%
This shift is a recovery from the earlier dip to 37.9% advancers on Sep 3.
Monthly Breadth:
-
Advancers: 74.6%
-
Decliners: 24.9%
The monthly trend remains strong and consistent, unchanged from the day before.
3-Month Breadth:
-
Advancers: 73.3%
-
Decliners: 25.9%
-
Advancing >25%: 16.6%
-
Declining >25%: 5.4%
These figures remain in line with those from the past several days and confirm that longer-term breadth is healthy, though without recent acceleration.
Trend Observation & Comparative Analysis
Compared to the previous day (September 5):
There is a slight drop in upside momentum, especially in the number of strong movers (>4% gains).
New Highs have pulled back, and so has the weekly breadth strength.
However, SMA-based participation and long-term breadth remain stable, which suggests the market is pausing, not reversing.
From earlier in the week (e.g., Sep 2), the breadth picture has notably improved, that day marked a clear short-term low with only 27.3% advancers, 70.6% decliners, and weak SMA readings.
The bounce since then has been measurable but not convincing in terms of leadership or participation.
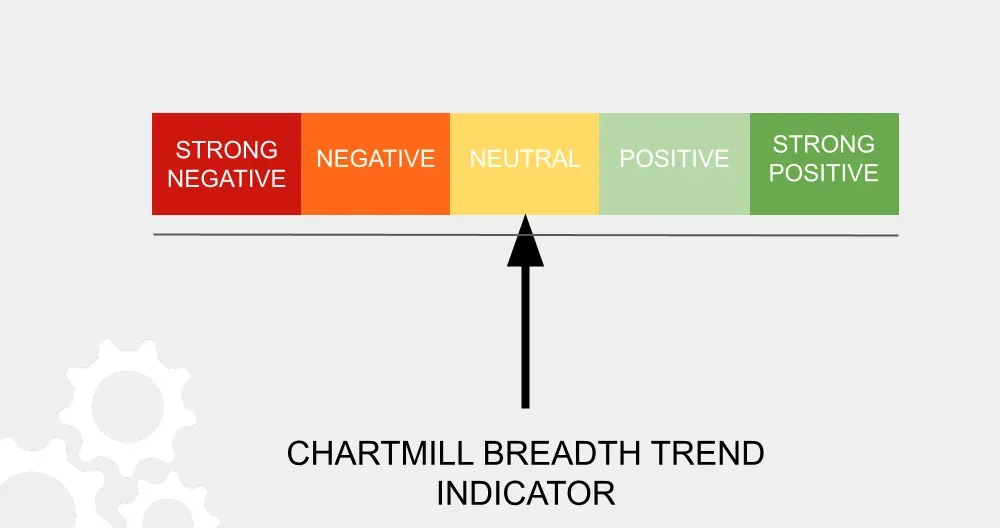
Final Assessment: Breadth Trend Rating
Current Breadth Trend Rating: 3 — Neutral
Despite improvements from earlier in the week, breadth is not expanding further. Leadership is narrow, and strong momentum moves are lacking. Without a fresh surge in participation and new highs, this rally remains tentative.
Kristoff - ChartMill
Next to read: EchoStar Soars on $17B SpaceX Deal as Markets Brace for Key Inflation Data