

(All data & visualisations by ChartMill.com)
Daily Market Trend Analysis – August 11, 2025 (After Market Close)
Calm before the storm, waiting for inflation figures...
Short Term Trend
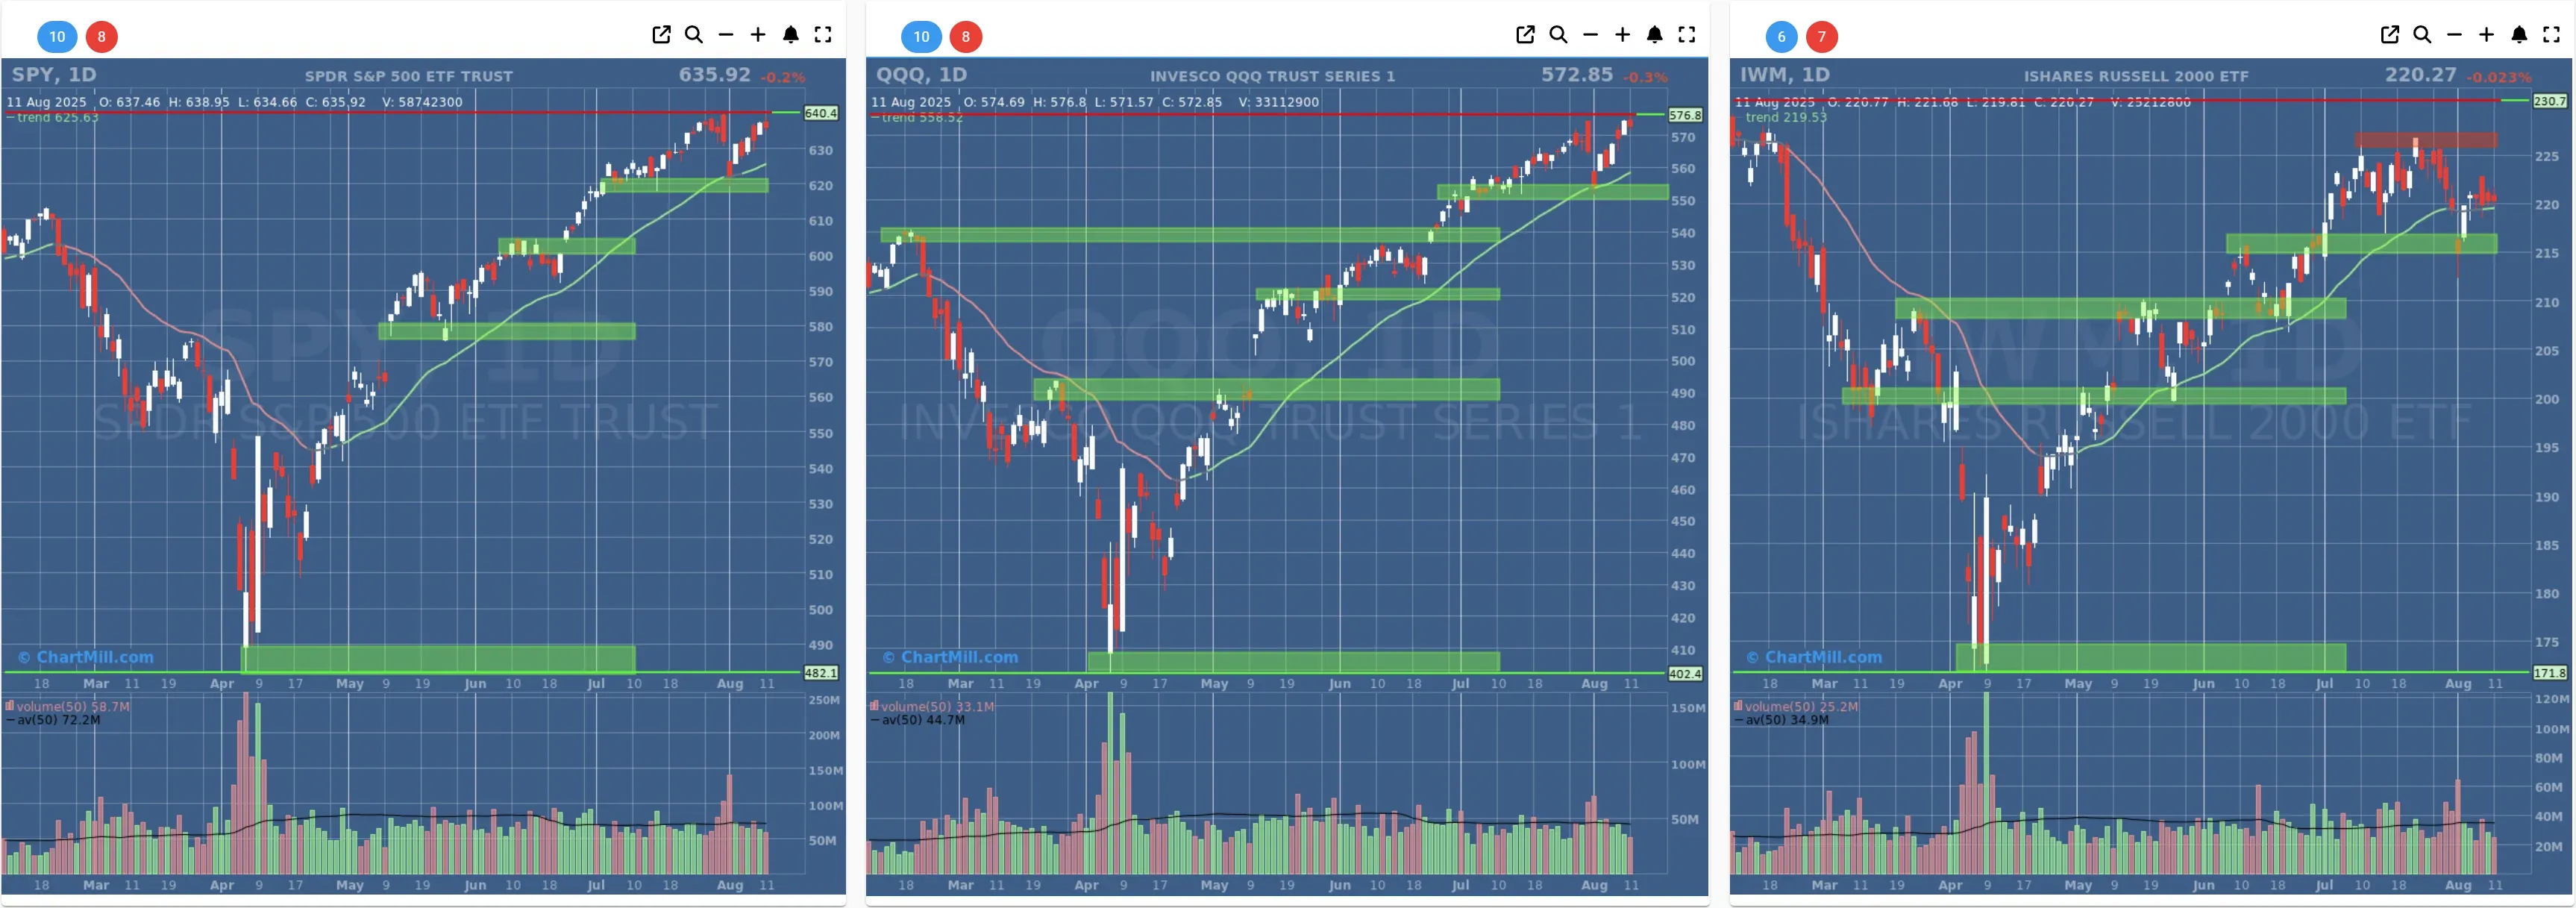
- Short-Term Trend: Bullish (from neutral)
- Next Support at $620 - $600
- Next Resistance at $640
- Volume: Slightly Below Average (50)
- Pattern: Down Day - Narrow Range
- Short-Term Trend: Bullish (no change)
- Next Support at $550 - $540
- Next Resistance at $575
- Volume: Below Average (50)
- Pattern: Down Day - Narrow Range - New Intraday High
- Short-Term Trend: Positive (from neutral)
- Next Support at $220 - $215
- Next Resistance at $226
- Volume: Below Average (50)
- Pattern: Down Day - Narrow Range
Long Term Trend
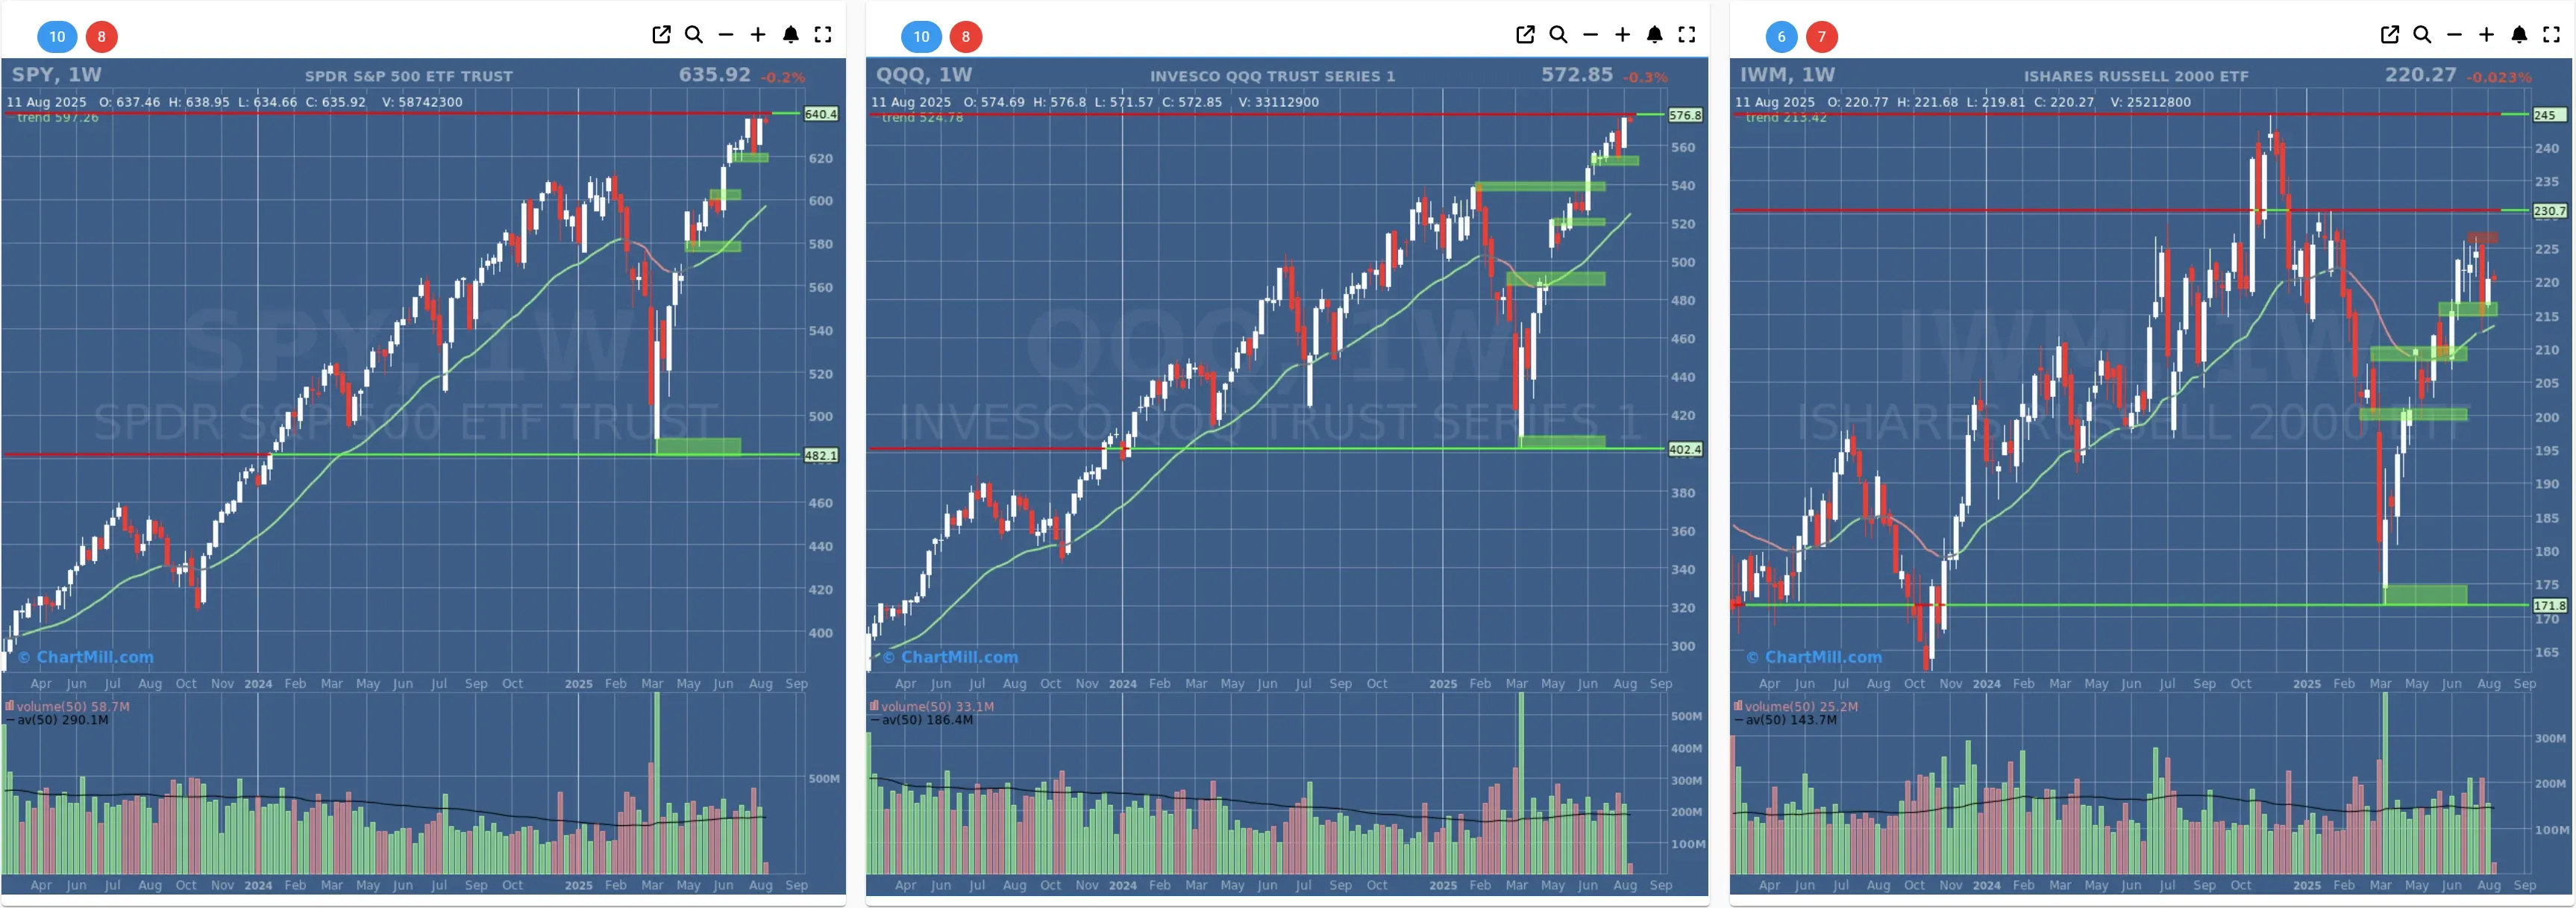
- Long-Term Trend: Positive (no change)
- Long-Term Trend: Positive (no change)
- Long-Term Trend: Positive (from neutral)
Daily Market Breadth Analysis – August 11, 2025 (After Market Close)
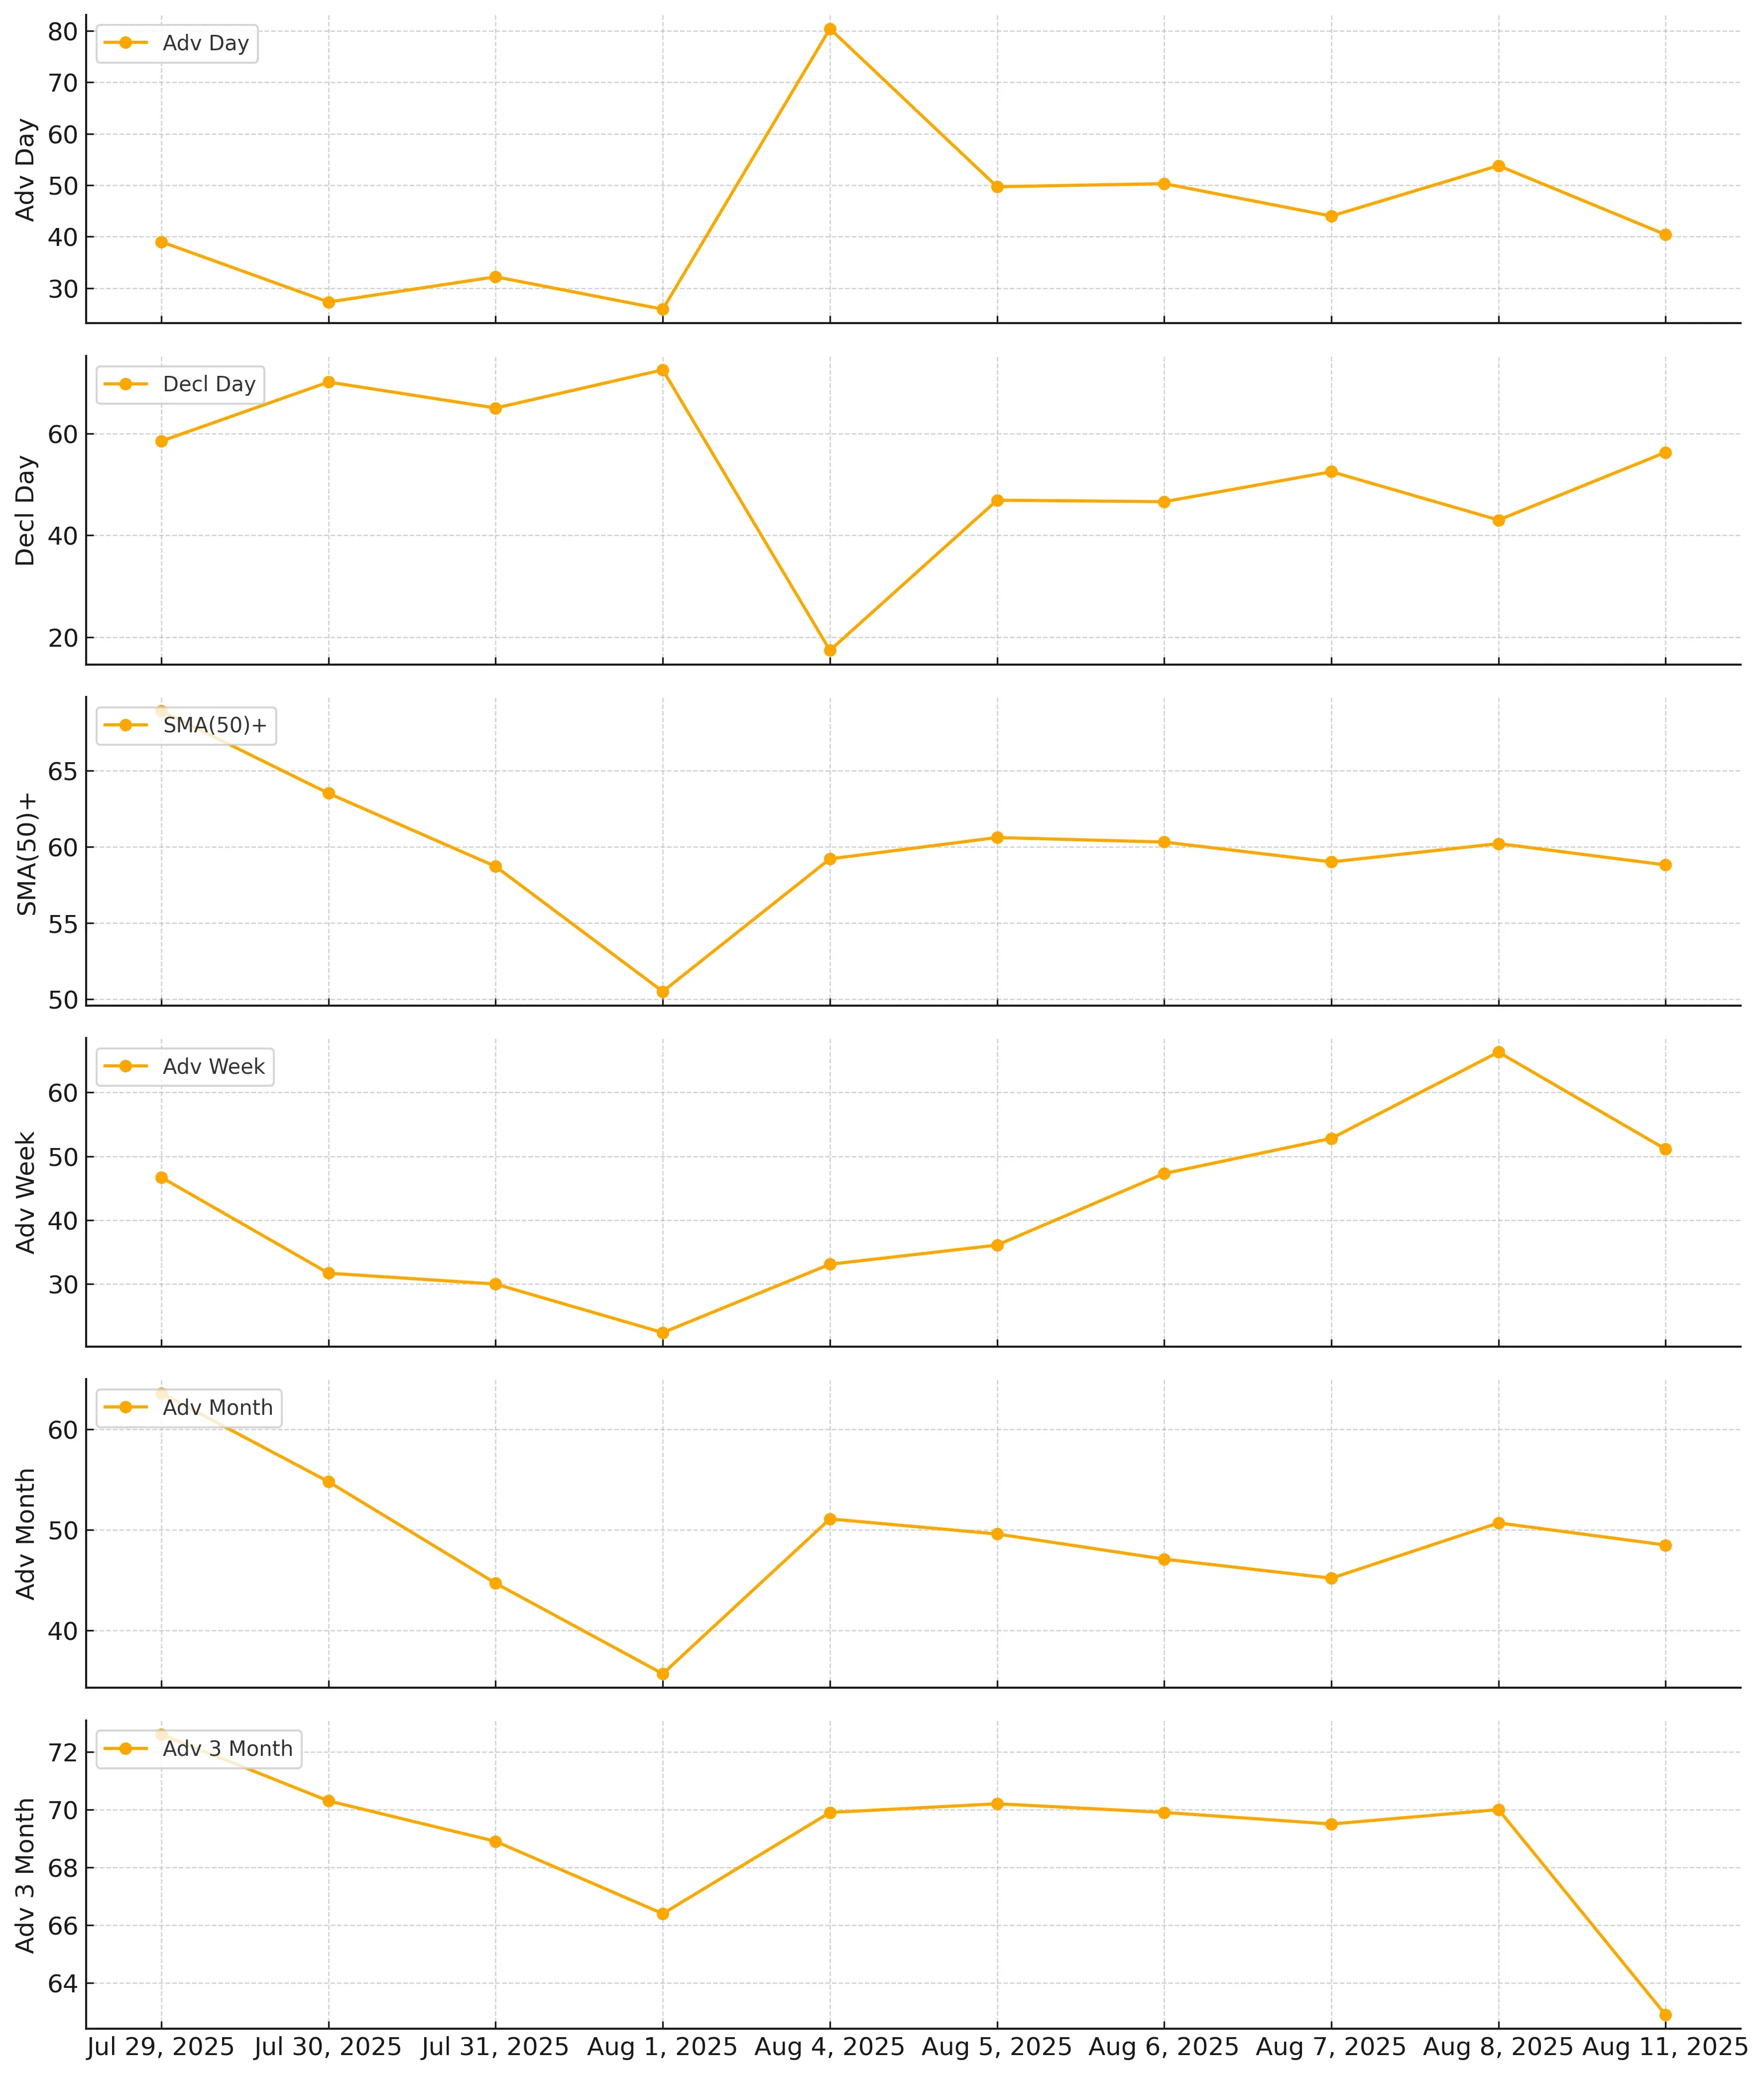
After showing resilience late last week, U.S. market breadth softened on August 11, with declining stocks outnumbering advancers and several short-term momentum indicators losing ground. While longer-term measures remain mostly stable, the short-term pullback suggests that the recent recovery attempt is under pressure.
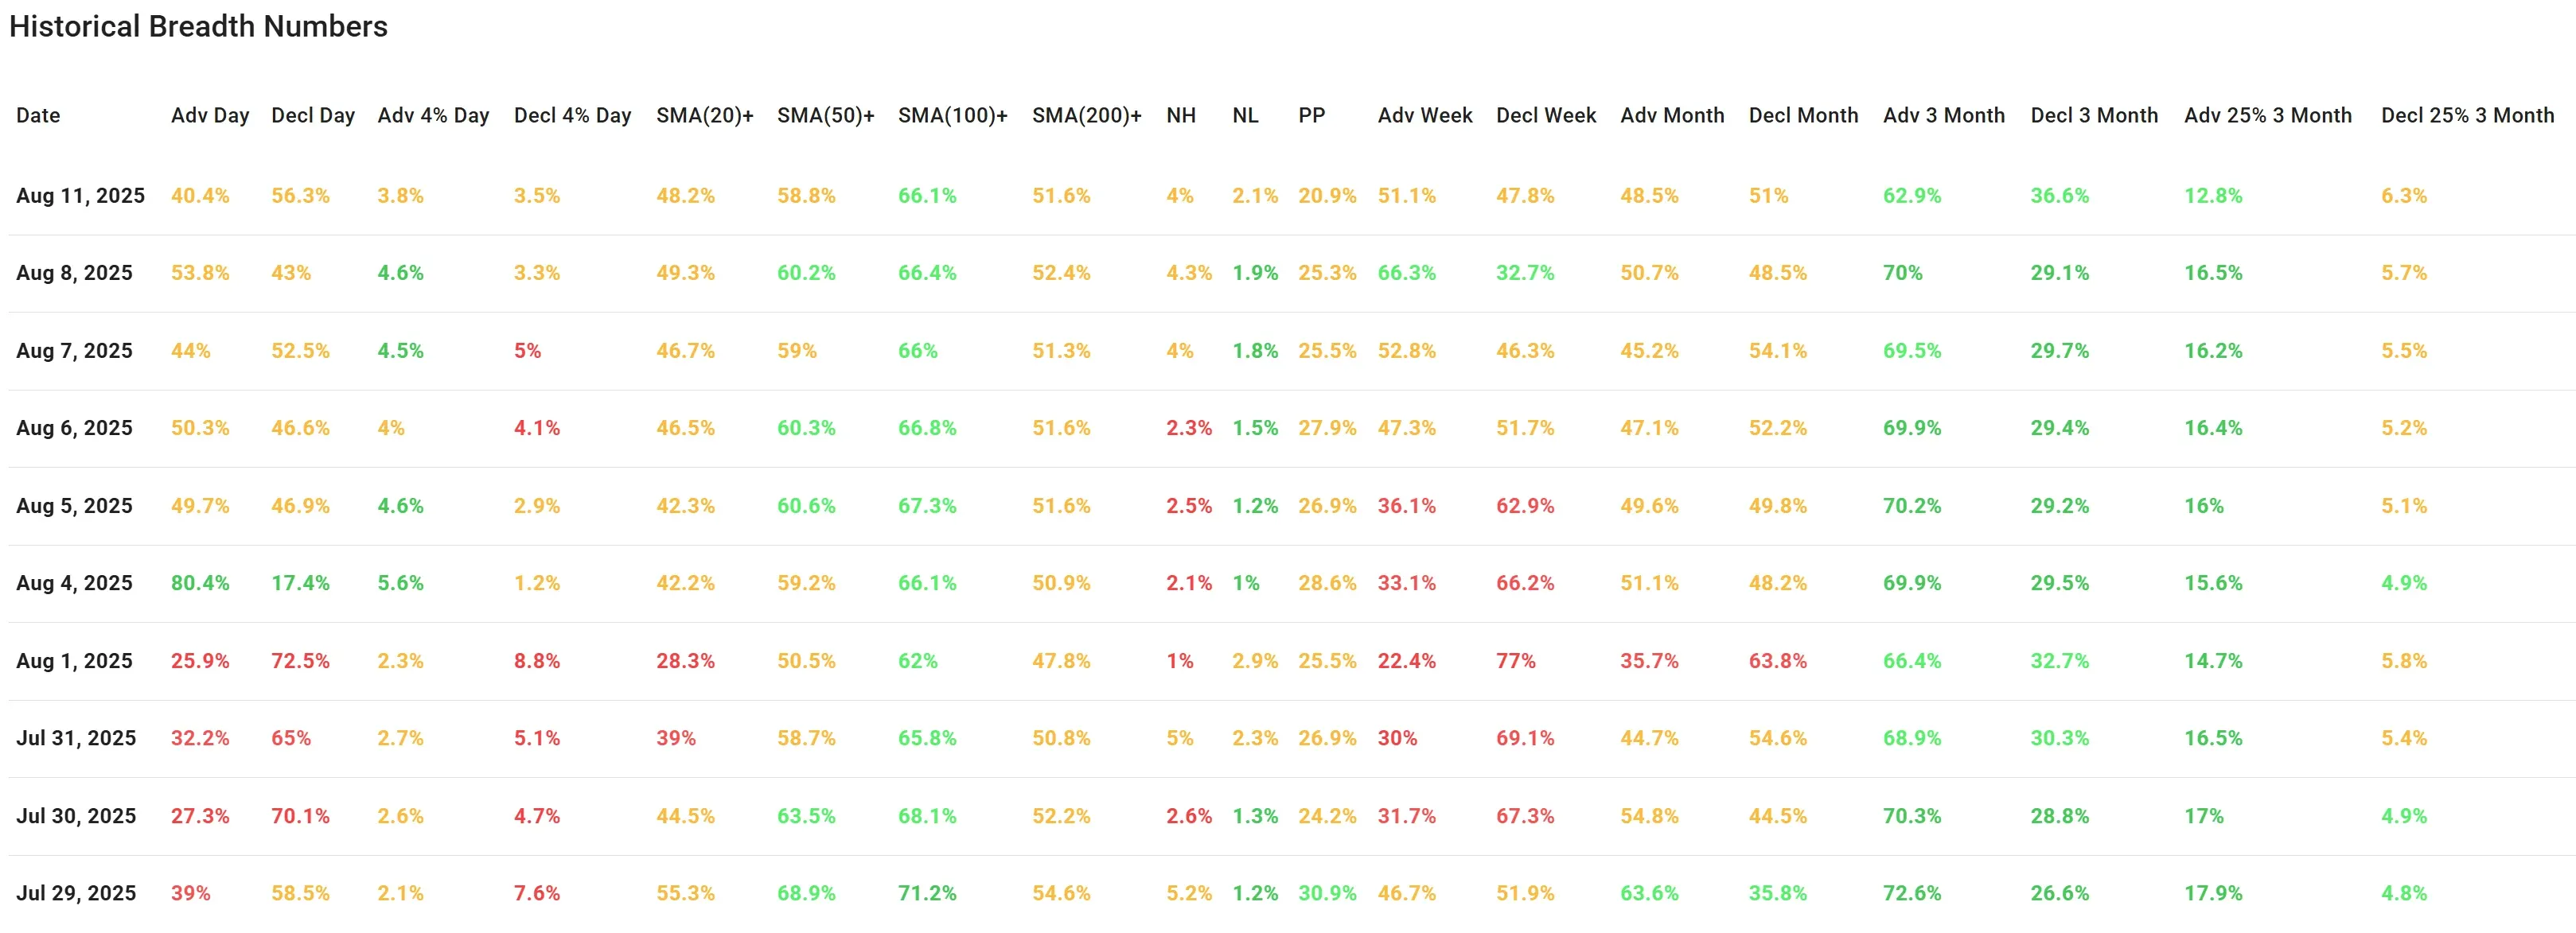
Following the modestly positive breadth readings on August 8, the latest session saw a notable reversal in short-term participation. The advance-decline ratio fell to 40.4% advancers vs. 56.3% decliners, marking the weakest daily advance figure since August 7.
This shift indicates that sellers regained control in the short-term despite last week’s mid-week strength.
High-momentum moves were also subdued, with Adv 4% Day dropping to 3.8% from 4.6% on August 8, while Decl 4% Day ticked up slightly to 3.5%. The narrow gap between these two metrics points to a lack of strong directional conviction from either side, but the bias tilted toward weakness.
From a trend perspective, the percentage of stocks above key moving averages held up reasonably well:
-
SMA(20)+ slipped to 48.2% from 49.3%,
-
SMA(50)+ eased to 58.8% from 60.2%,
-
SMA(100)+ remained solid at 66.1%,
-
SMA(200)+ was stable at 51.6%.
This stability in longer-term breadth measures indicates that the weakness was primarily concentrated in shorter time frames.
New Highs vs New Lows
New Highs (NH) fell slightly to 4%, while New Lows (NL) edged higher to 2.1%, suggesting only mild deterioration in underlying leadership. However, Pocket Pivots (PP) dropped to 20.9%, the weakest since early August, reflecting fewer stocks in favorable technical setups.
Weekly and Monthly Numbers
Weekly metrics confirmed the short-term loss of momentum. Adv Week slipped sharply to 51.1% from 66.3%, and Decl Week rose to 47.8%, a sign that the weekly bias has now neutralized after several sessions of positive skew.
Over a monthly horizon, breadth remains balanced with Adv Month at 48.5% and Decl Month at 51%.
The 3-month metrics continue to show an underlying positive tilt, with Adv 3 Month at 62.9% and Decl 3 Month at 36.6%. However, the deterioration in shorter intervals raises the risk that these longer-term measures could roll over if weakness persists.
Context vs. Previous Session (August 8, 2025):
In Friday’s analysis, breadth strength was improving, led by a higher weekly advance figure and steady longer-term metrics. The expectation was for momentum to continue if buyers could maintain pressure. Instead, Monday’s data show that this momentum faded quickly, with daily and weekly advance figures sliding back and decliners taking the lead.
The shift suggests that last week’s bounce was not yet supported by broad participation.
Breadth Trend Rating: 3 – Neutral
While longer-term breadth measures remain intact, the loss of short-term momentum and the balanced-to-negative daily and weekly readings temper the bullish case.
Market sentiment appears cautious, and without renewed buying pressure in the coming sessions, breadth could weaken further.

Kristoff - ChartMill
Next to read: Market Monitor News, August 12 BMO