

(All data & visualisations by ChartMill.com)
Daily Market Trend Analysis – August 8, 2025 (After Market Close)
New High for QQQ
Short Term Trend
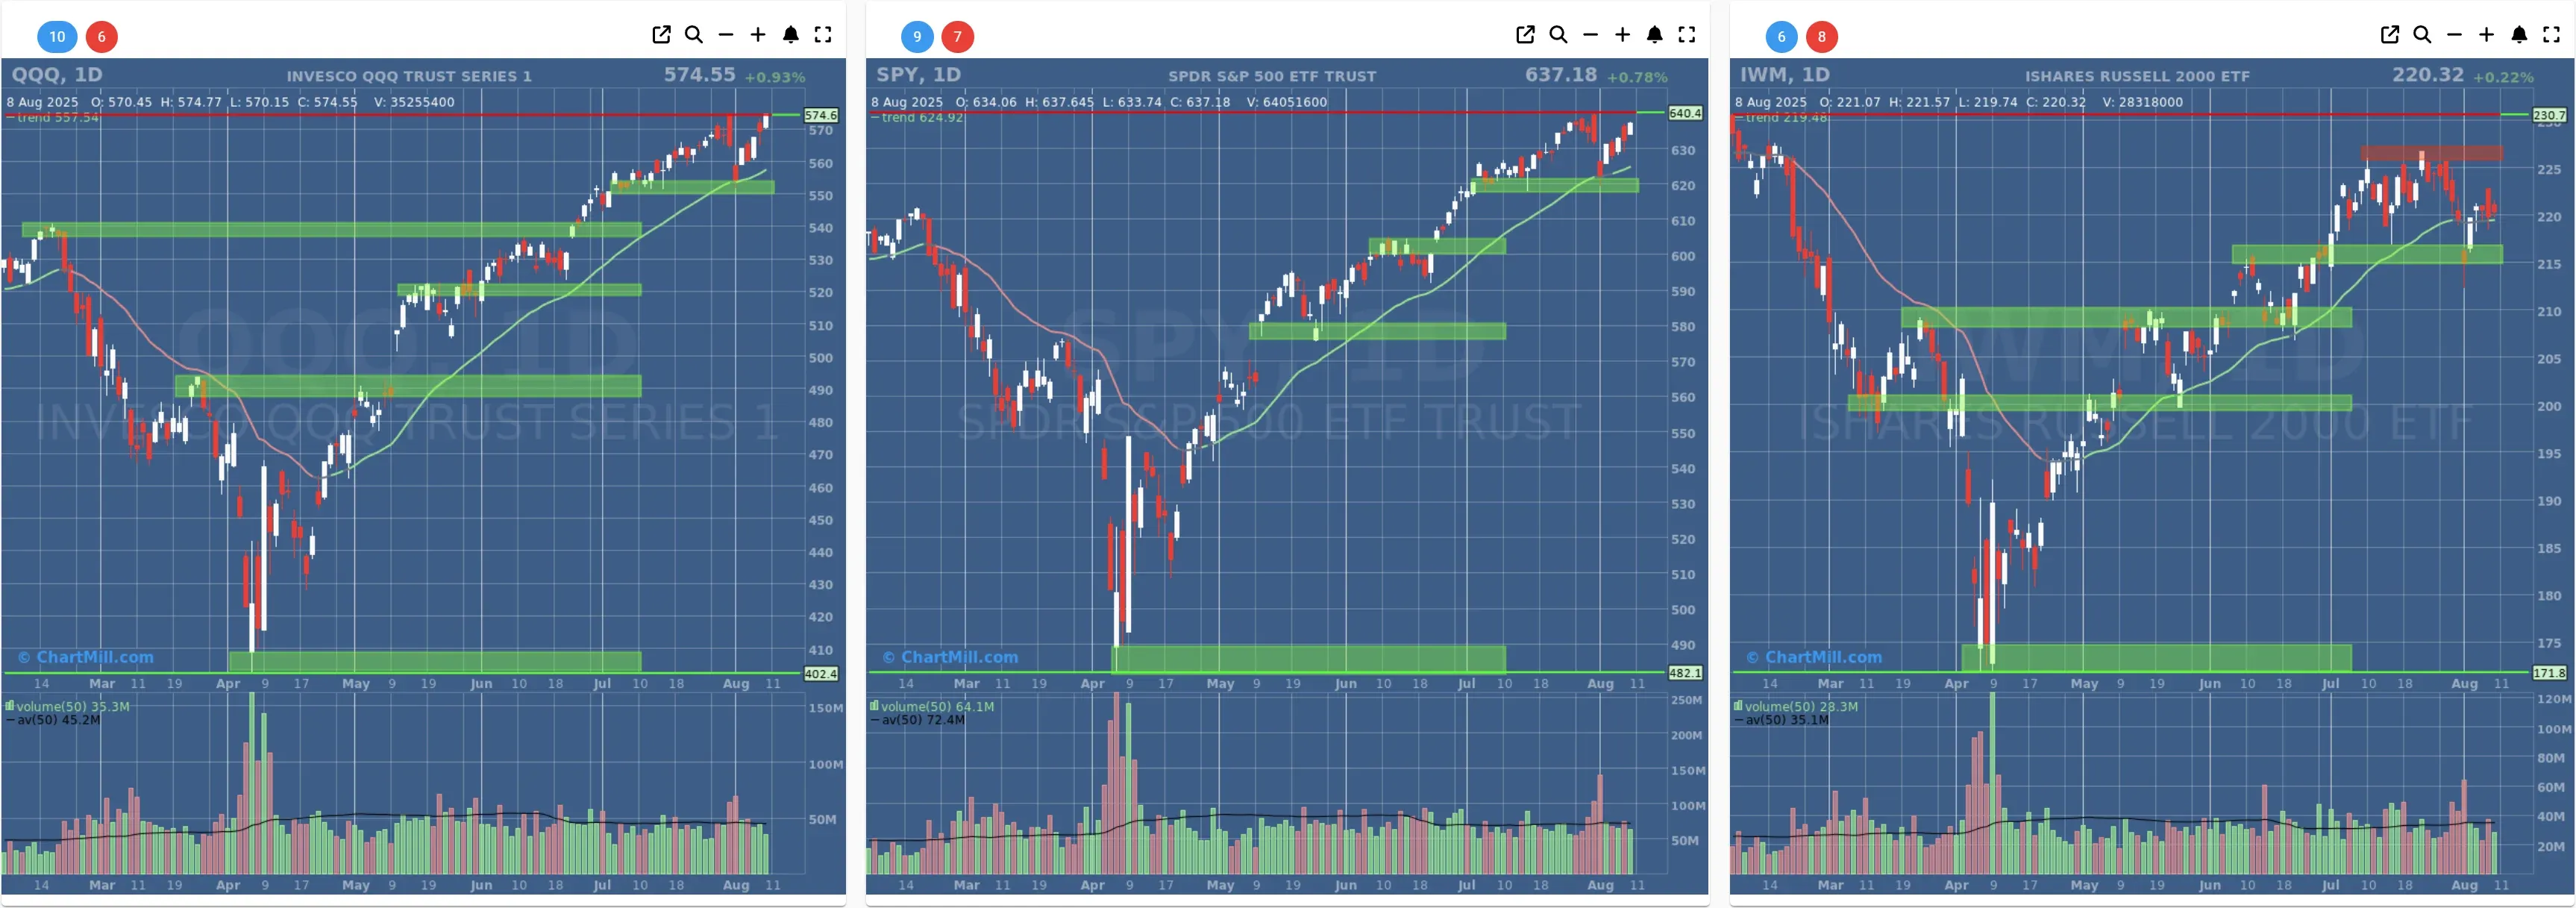
- Short-Term Trend: Bullish (from neutral)
- Next Support at $620 - $600
- Next Resistance at $640
- Volume: Slightly Below Average (50)
- Pattern: Up Day
- Short-Term Trend: Bullish (no change)
- Next Support at $550 - $540
- Next Resistance at $575
- Volume: Slightly Below Average (50)
- Pattern: Up Day - New High
- Short-Term Trend: Positive (from neutral)
- Next Support at $220 - $215
- Next Resistance at $226
- Volume: Slightly Below Average (50)
- Pattern: Down Day - Inside Day
Long Term Trend
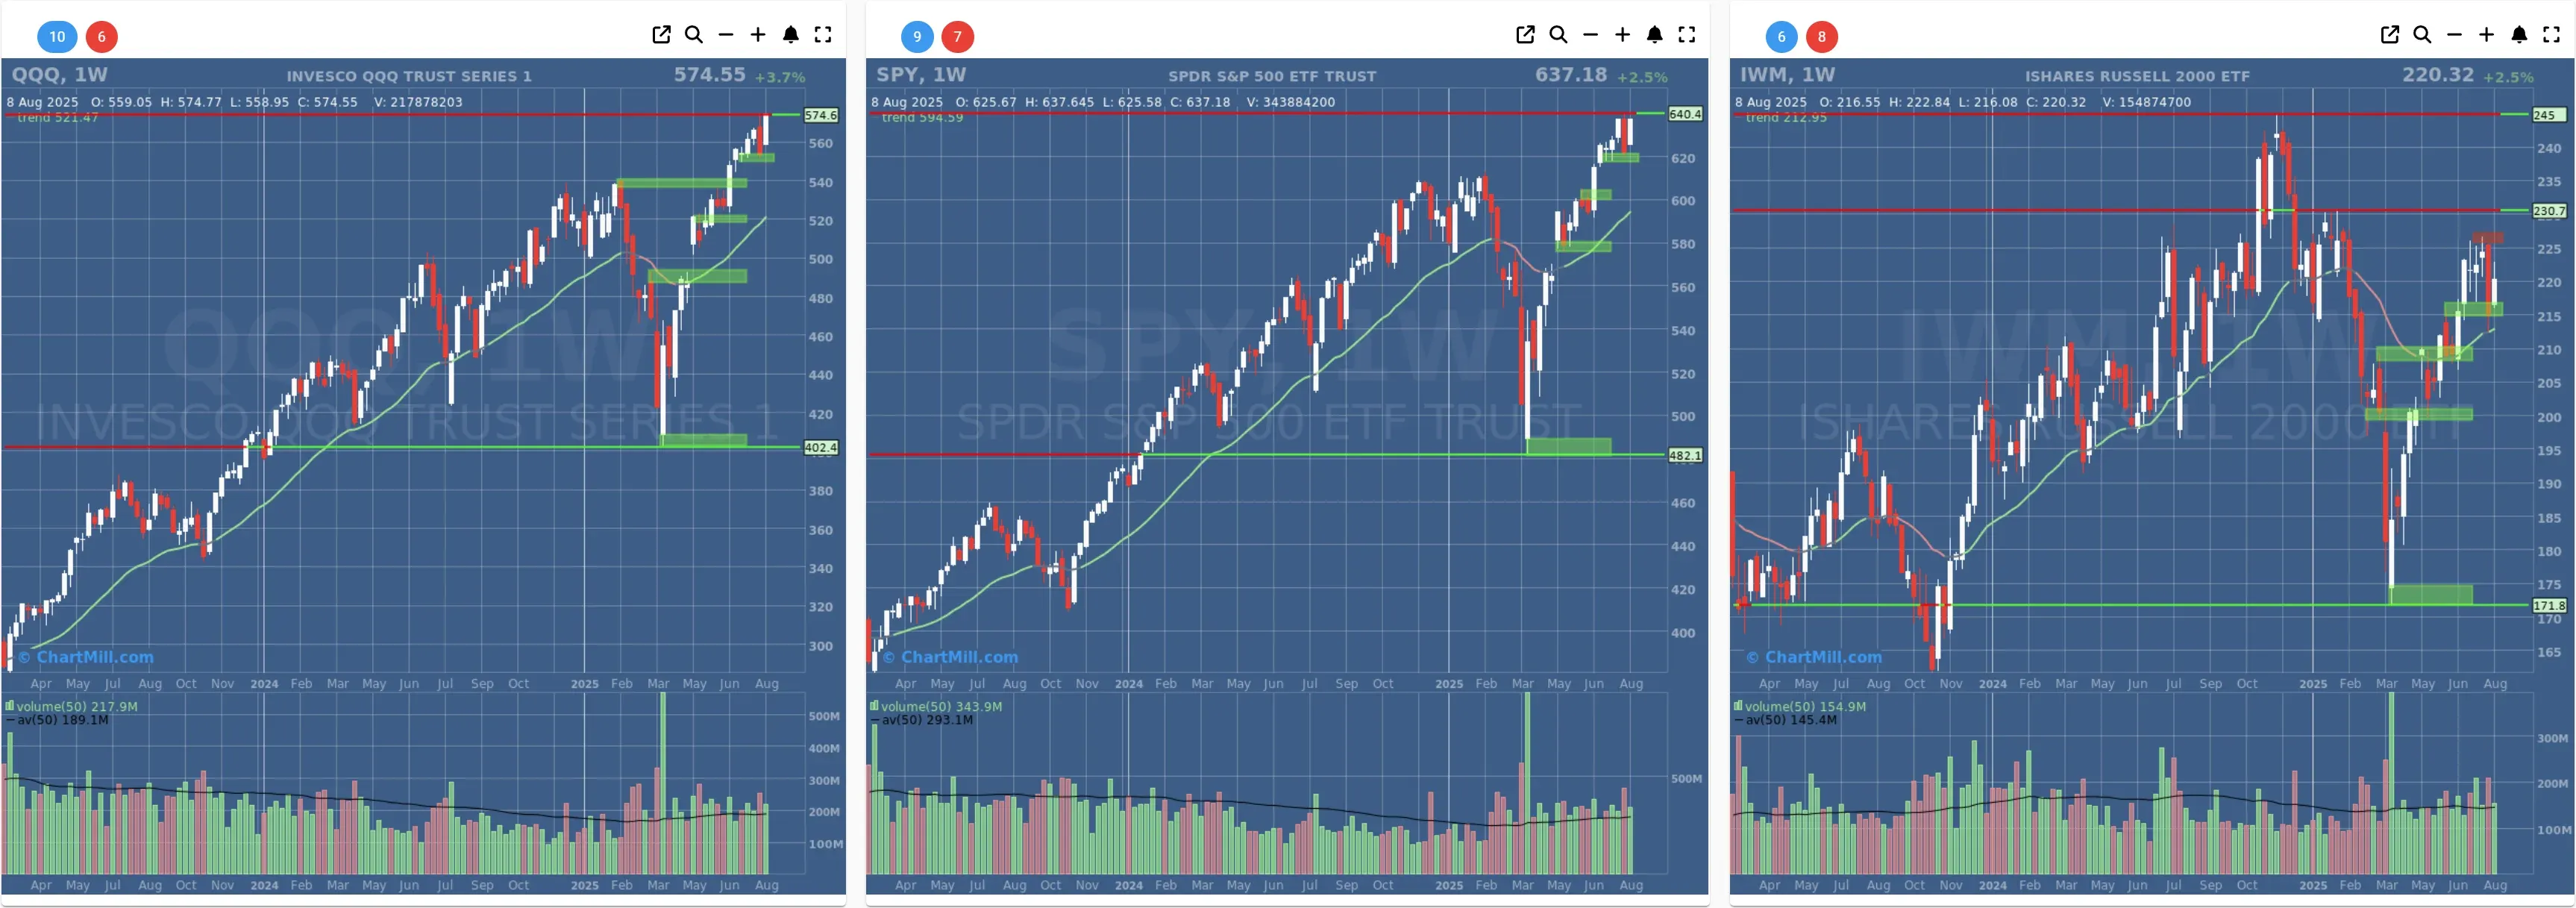
- Long-Term Trend: Positive (no change)
- Long-Term Trend: Positive (no change)
- Long-Term Trend: Positive (from neutral)
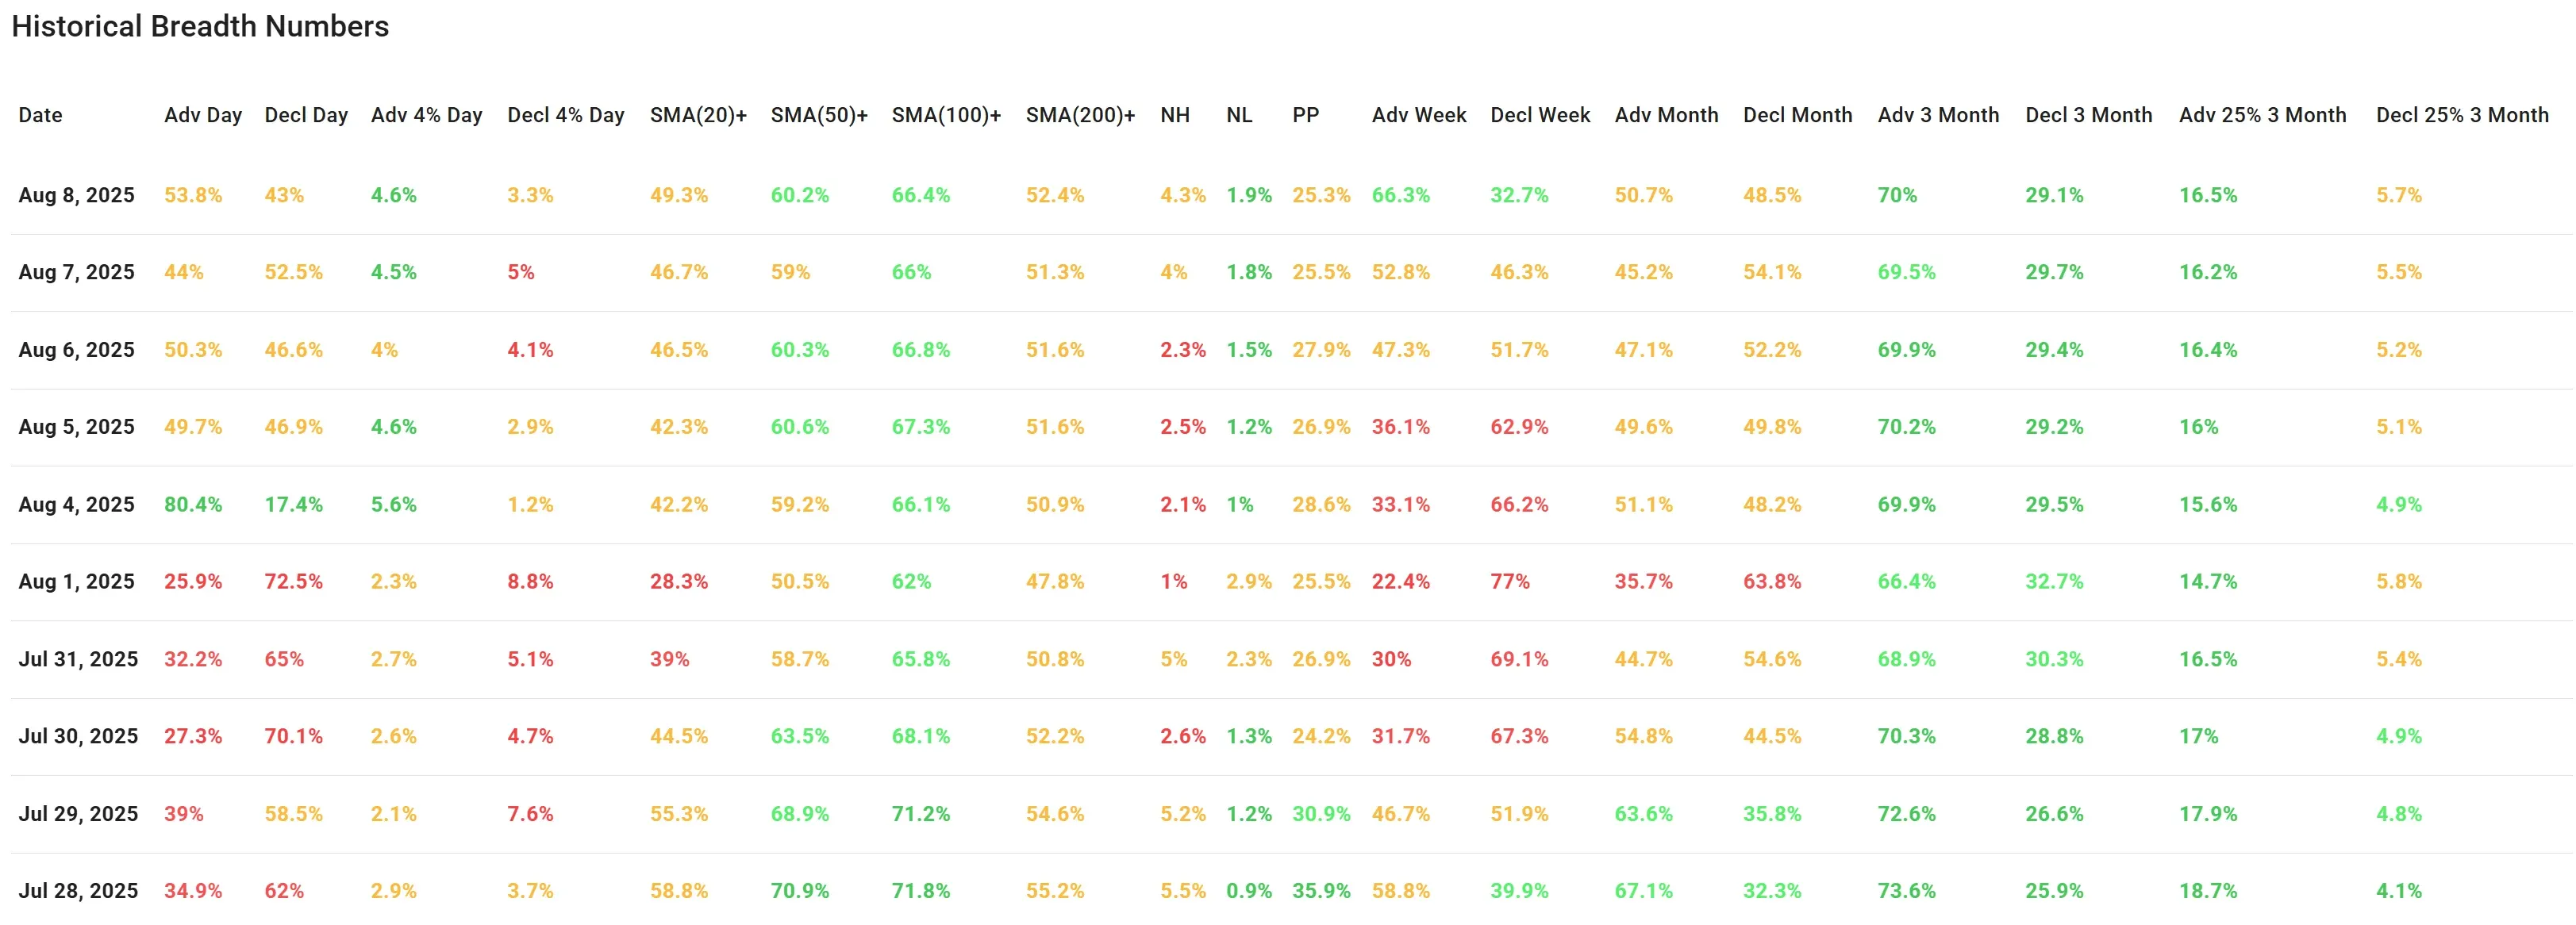
Daily Market Breadth Analysis – August 8, 2025 (After Market Close)
U.S. market breadth showed little change on Friday, with advancing and declining issues nearly balanced. Short-term momentum indicators remained moderate, while longer-term breadth metrics were stable. The data points to a market still searching for direction after a volatile start to August.
Friday’s session brought another day of relatively balanced breadth numbers.
Advancers/Decliners
Advancing issues accounted for 53.8% of the market, only slightly higher than Thursday’s 44%, while decliners made up 43%. The proportion of stocks gaining more than 4% (4.6%) remained consistent with the prior two sessions, signaling that strong upside movers are still present but not dominant.
Declines of more than 4% eased to 3.3% from Thursday’s 5%, suggesting some reduction in heavy selling pressure.
Stocks vs Moving Averages
Short-term breadth, measured by the percentage of stocks above their 20-day SMA (49.3%), was little changed from Thursday and continues to hover around the midpoint.
Medium- and long-term metrics (stocks above the 50-, 100-, and 200-day SMAs) remained steady, with no meaningful shifts, the 50-day reading at 60.2% and the 200-day at 52.4% indicate a market still maintaining its broader uptrend structure.
New Highs vs New Lows
New highs (4.3%) inched higher from Thursday’s 4%, while new lows (1.9%) stayed subdued.
The percentage of stocks above their pivot point (25.3%) was slightly lower than Thursday’s 25.5%, showing no breakout in short-term momentum.
Weekly and Monthly Breadth
The weekly breadth data improved, with 66.3% of issues advancing over the week versus 52.8% the day before. This reflects a recovery from the heavy selling seen in late July and early August.
Monthly breadth was almost perfectly balanced (50.7% advancers vs. 48.5% decliners), indicating no dominant trend over the past 20 trading sessions.
On the three-month horizon, advancers (70%) remained firmly ahead of decliners (29.1%), reinforcing that despite recent volatility, the intermediate-term market structure is still supportive.
However, the percentage of strong performers over three months (gains >25%) stayed modest at 16.5%, consistent with Thursday’s 16.2%.
Trend Assessment
The latest data suggests a market in a holding pattern, short-term breadth is neutral, medium-term strength is intact, and selling pressure is easing compared to earlier in the month. The absence of a strong thrust in either direction keeps the immediate outlook cautious.
Breadth Trend Rating: 3 – Neutral

Kristoff - ChartMill
Next to read: Market Monitor News, August 8