(All data & visualisations by ChartMill.com)
Daily Market Trend Analysis – June 23, 2025 (After Market Close)
nice recovery candles for the main US index ETF's
Short Term Trend
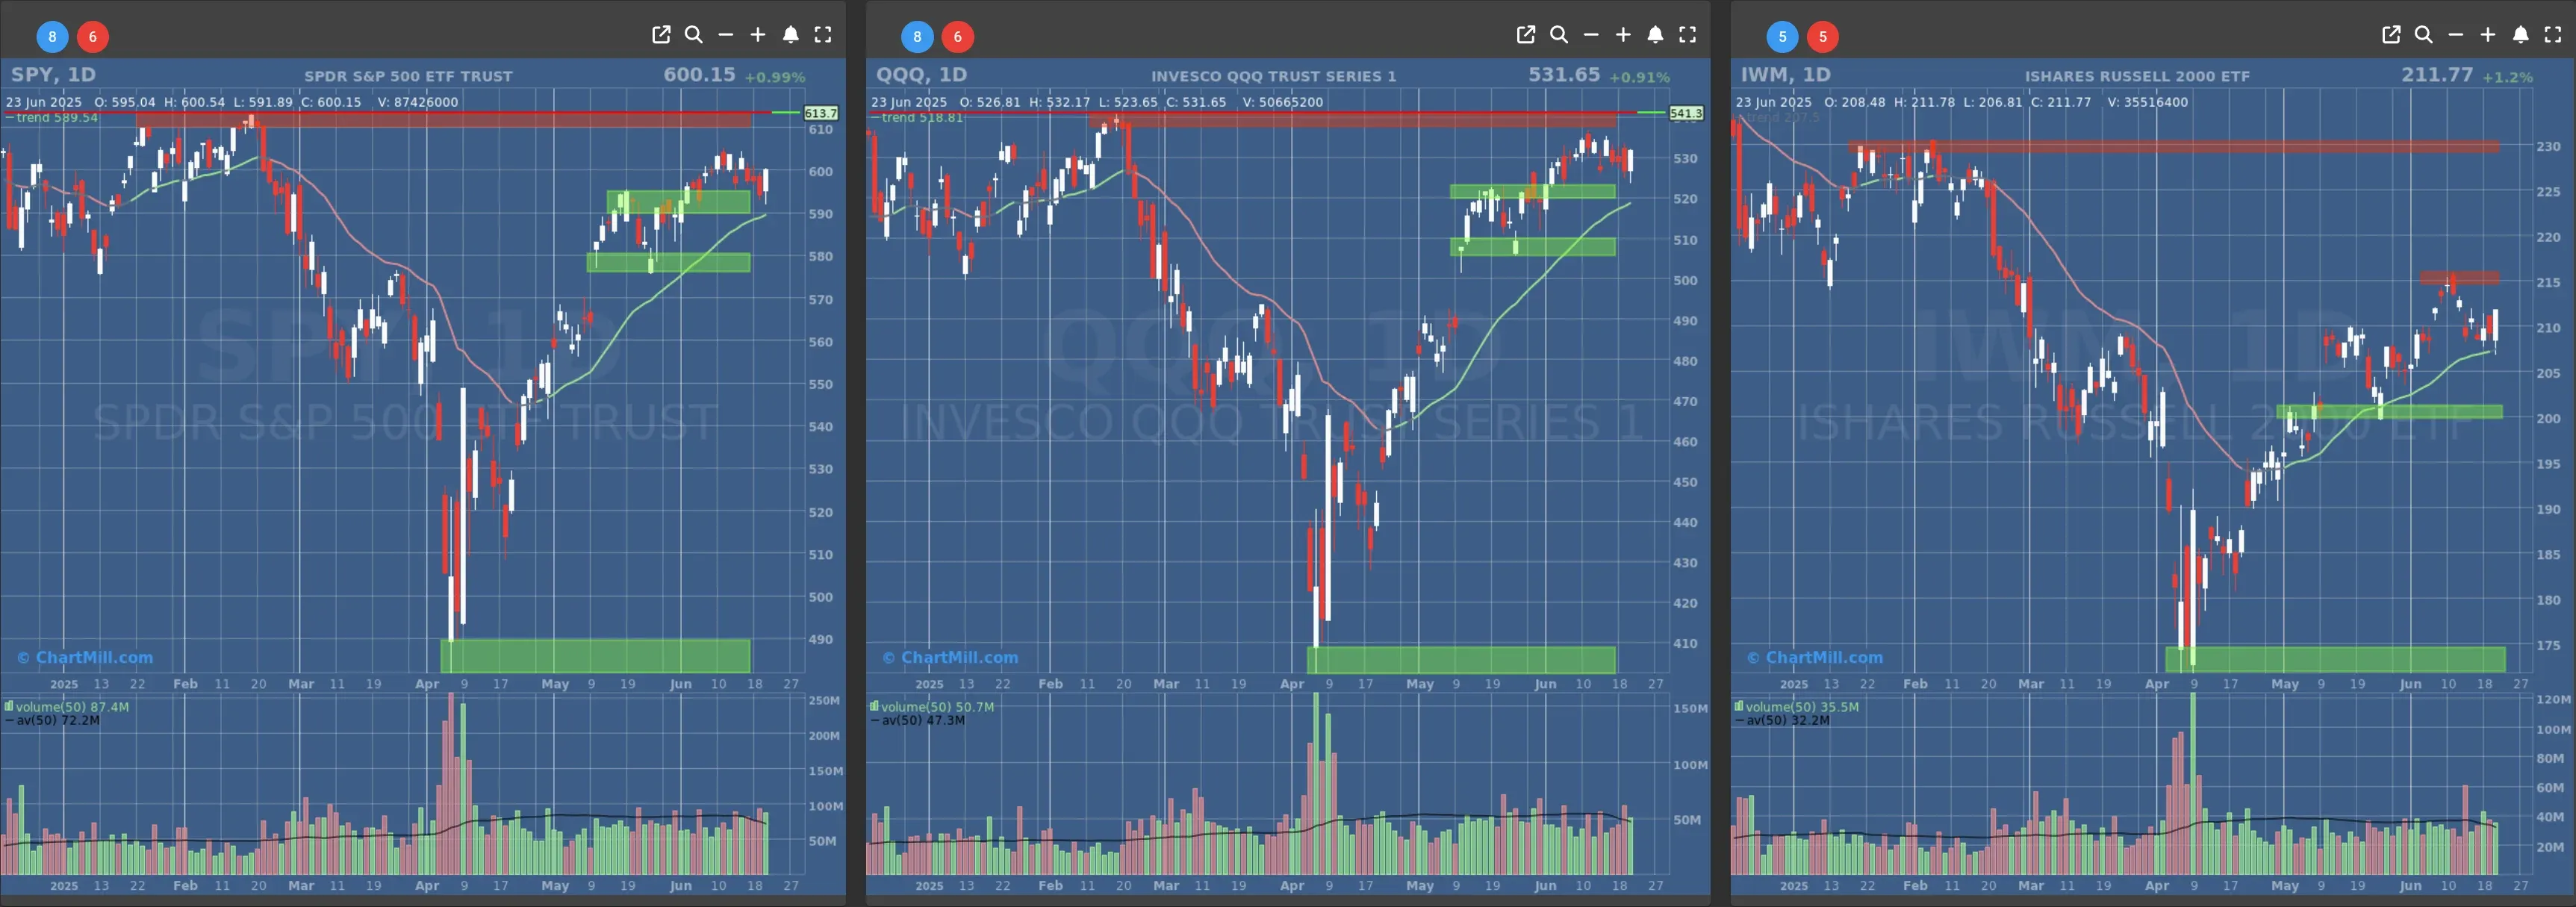
- Short-Term Trend: Bullish (no change)
- Next Support at $580
- Next Resistance at $610
- Volume: above Average (50)
- Pattern: Strong Up Candle
- Short-Term Trend: Bullish (no change)
- Next Support at $520
- Next Resistance at $540
- Volume: Above Average (50)
- Pattern: Strong Up Candle
- Short-Term Trend: Bullish (no change)
- Next Support at $210 & $205
- Next Resistance at $215 & $230
- Volume: Above Average (50)
- Pattern: Bullish Engulfing Candle
Long Term Trend
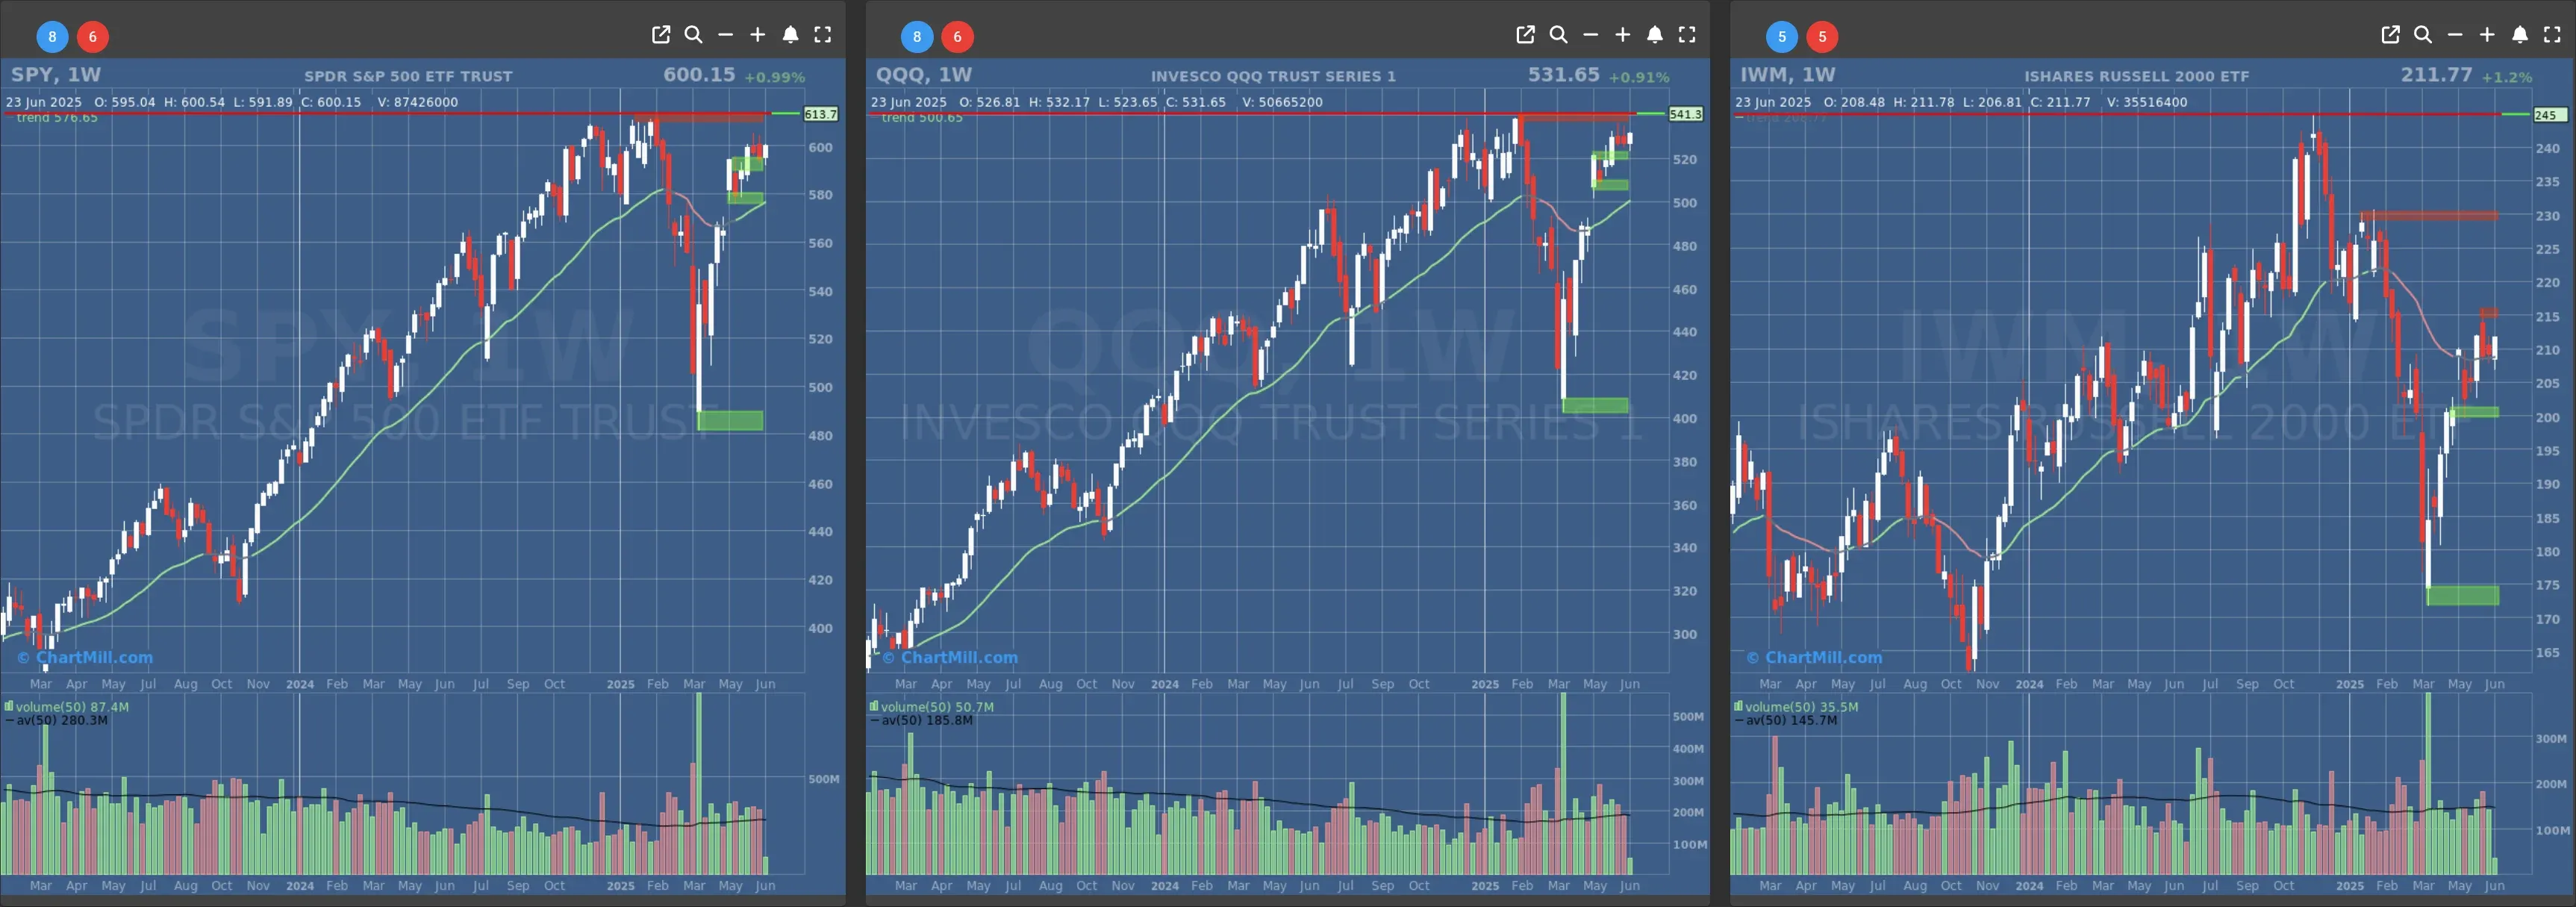
- Long-Term Trend: Positive (no change)
- Long-Term Trend: Positive (no change)
- Long-Term Trend: Neutral (no change)
Daily Market Breadth Analysis – June 23, 2025 (After Market Close)
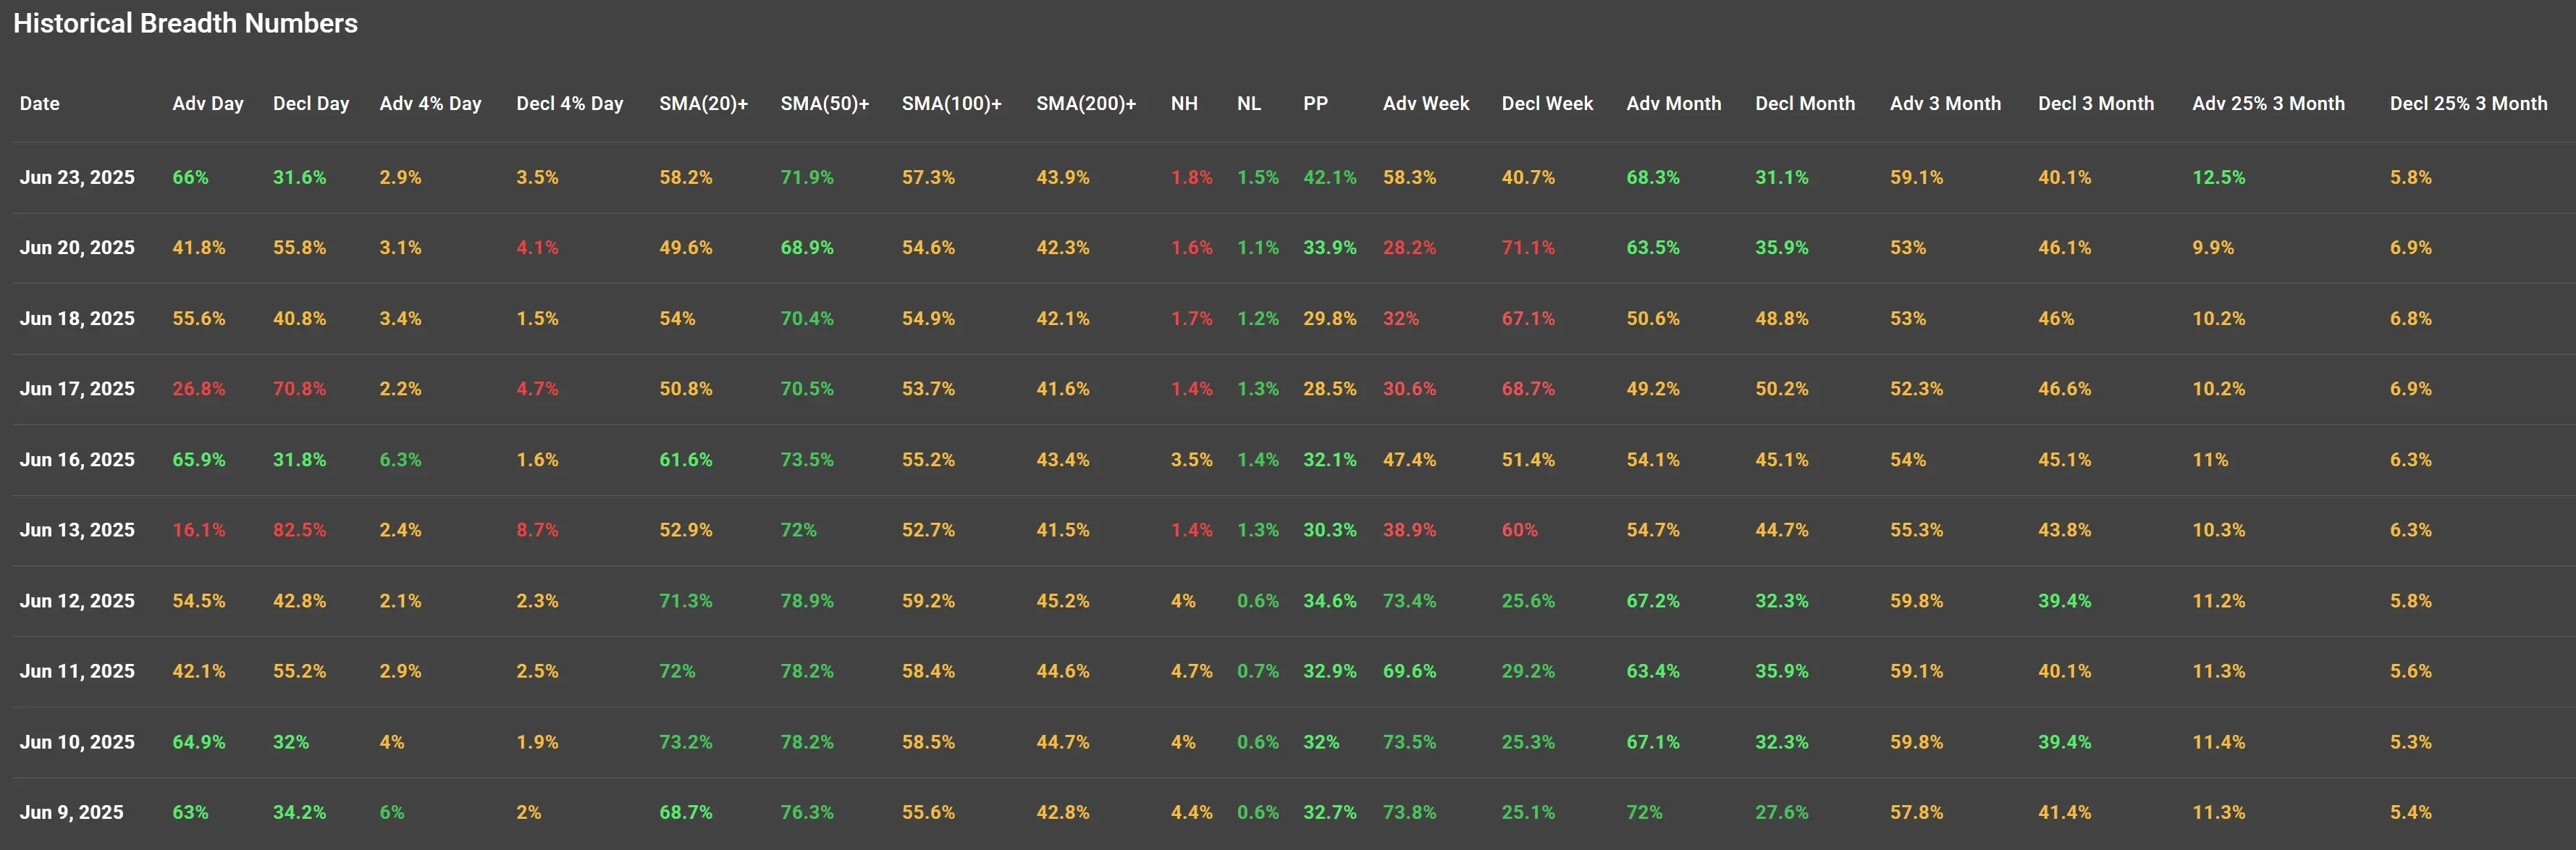
A Calm Close After a Turbulent Stretch
Monday, June 23, offered a surprisingly steady market backdrop, at least, that’s what the breadth data suggests.
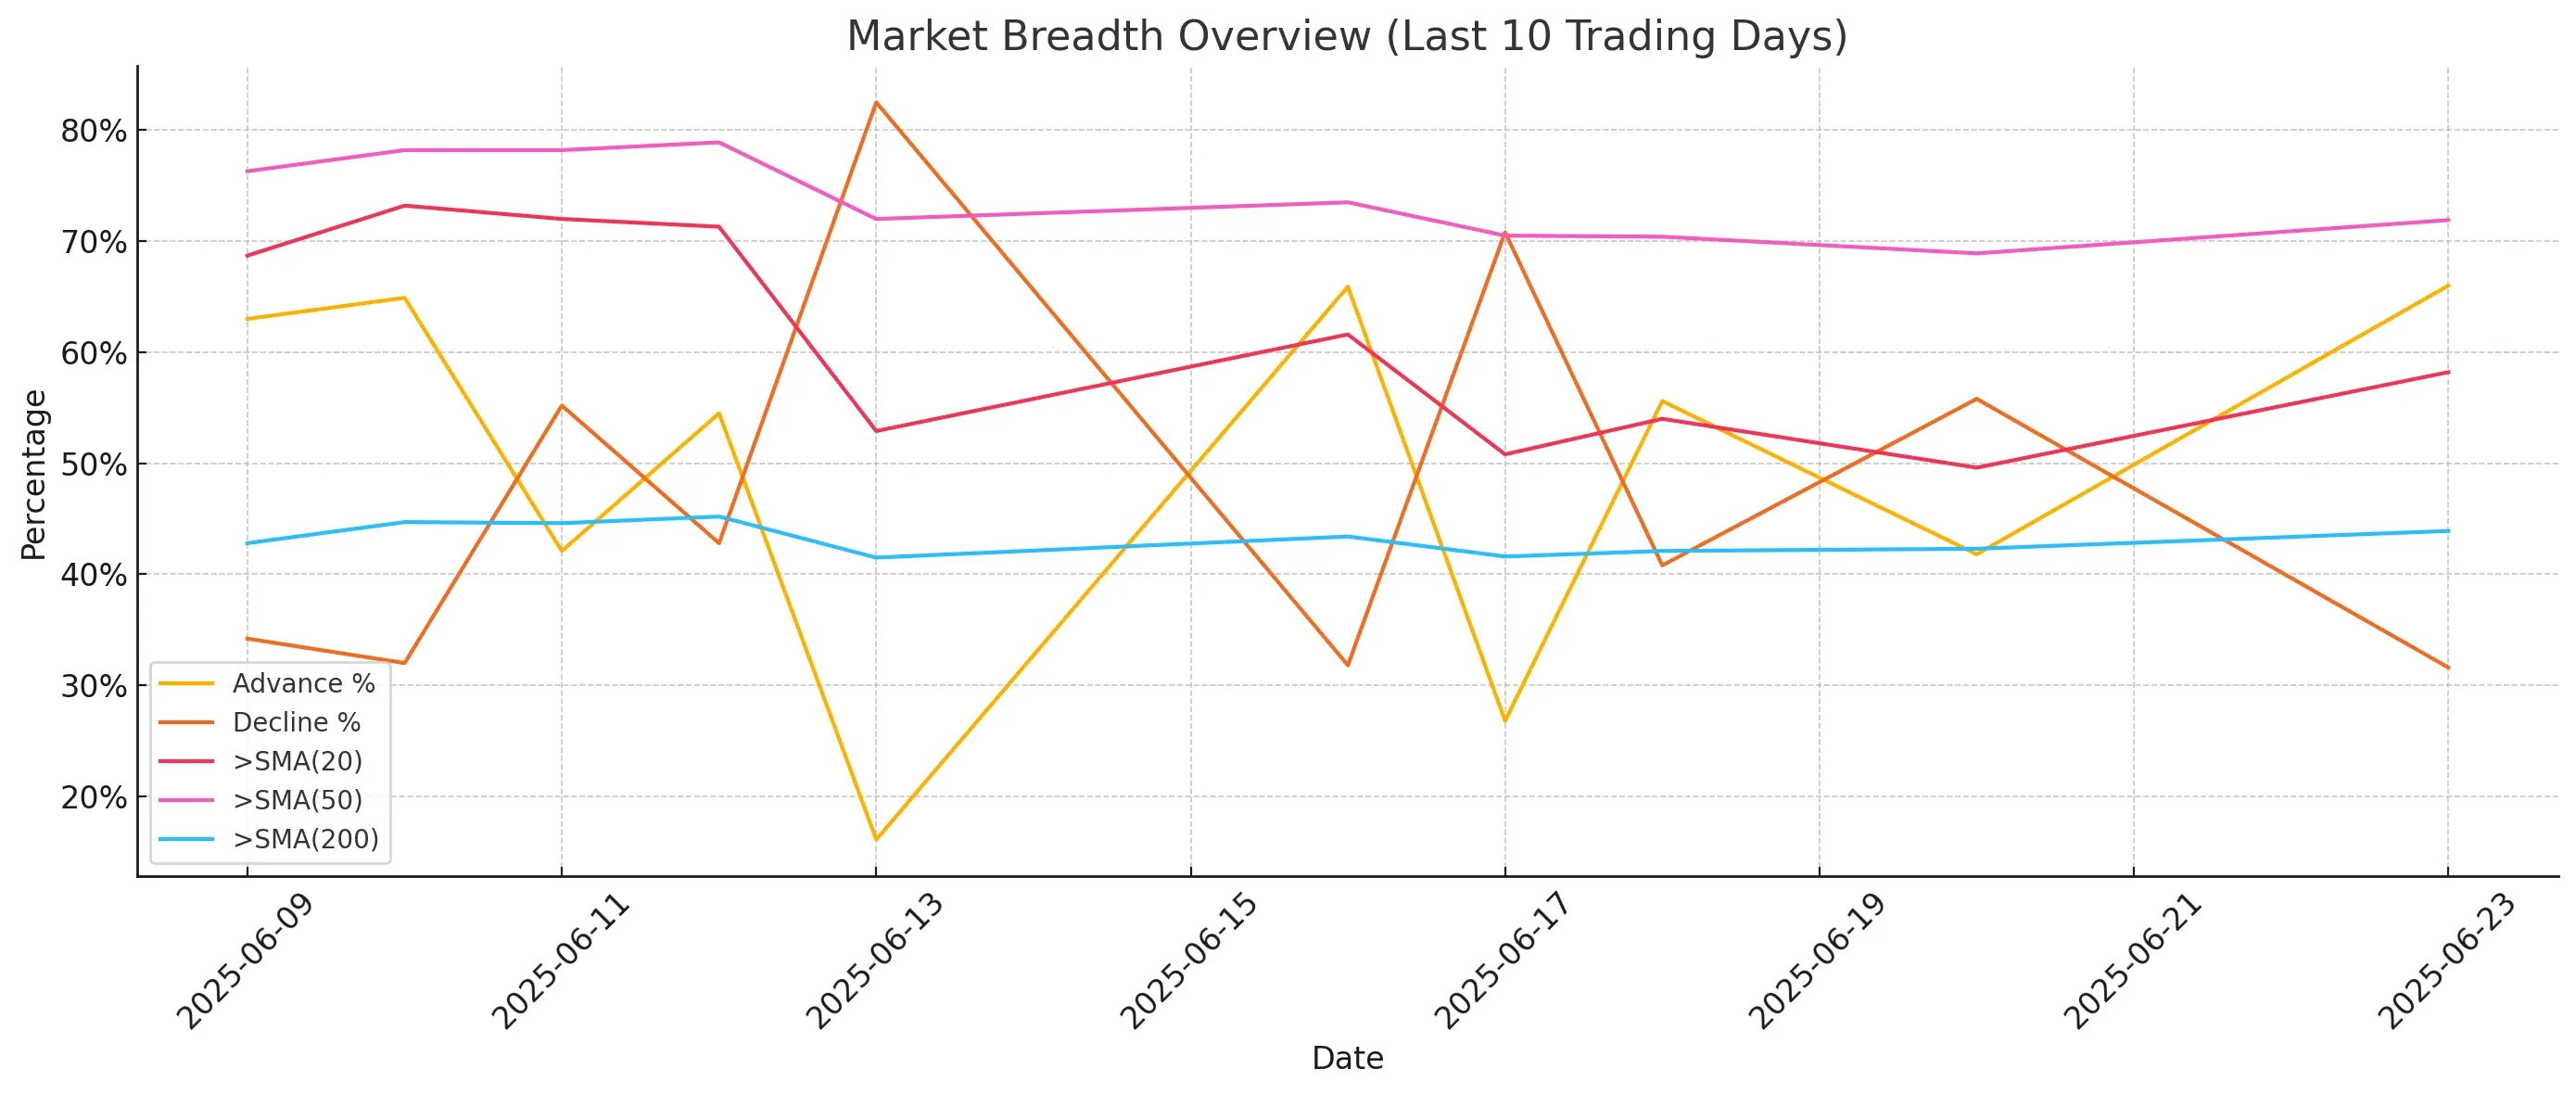
After last week’s erratic seesawing between risk-off fear and momentum buying, the new week kicked off with solid participation from advancing stocks: 66% of issues moved higher, up sharply from Friday’s 41.8%. That’s the highest single-day advance ratio since June 16.
Decliners dropped to 31.6%, confirming a broad-based recovery day. That aligns with a sharp drop in geopolitical anxiety (at least temporarily), after Friday’s more cautious tone driven by Middle East tensions.
Short-Term Participation Rebounds
We saw some notable improvement in short-term moving average breadth:
-
58.2% of stocks are now trading above their 20-day SMA, up from 49.6% on Friday.
-
50-day SMA participation climbed to 71.9%, reflecting healthy intermediate-term support.
This reaffirms that June 13’s brutal selloff (just 16.1% advancers, with >82% decliners) may now be firmly in the rearview mirror. Still, the 20-day breadth is a bit volatile, reminding us that we're not out of the chop just yet.
Long-Term Structure Still Stable
The SMA(200)+ reading ticked up to 43.9%, just a minor gain from last week, but importantly consistent.
We haven’t seen a major breakdown in long-term technical health. It’s slow, but steady, especially when you consider that this line has been hovering in the 41–45% range for 10 consecutive sessions.
In short: the structural base remains intact.
Highs vs Lows: No Panic Here
New Highs edged up slightly to 1.8%, while New Lows held at 1.5%. The High/Low ratio isn’t shouting “breakout” yet, but the absence of expanding new lows is key. Contrast that with the June 13 low, when new lows were ticking higher while breadth collapsed.
That pattern is not repeating, yet another confirmation that sentiment has stabilized.
Breadth Momentum Metrics: Improvement in Progress
-
Advance > 25% over 3 months: 12.5%, the highest since this metric began pulling back on June 10.
-
Decline > 25% over 3 months: 5.8%, continuing its downward drift.
These levels suggest the strongest stocks are quietly starting to extend their lead again, a subtle sign of healthy risk appetite returning.
Key Takeaway: Breadth Backs the Rebound
After Friday’s conflicted tone, breadth improved intraday, but lacked conviction.
The latest data finally delivers some clarity: the buyers are back in control, at least for now. The trend of rising participation above key short- and mid-term averages supports the price action seen in leading indices on Monday.
This is in line with what the tape was hinting at before the weekend: markets were more concerned with signals of restraint in geopolitical retaliation than the actual headlines themselves. That suspicion now finds confirmation in the numbers.
Outlook
With macro nerves cooling and breadth reaccelerating, the market is offering a window of strength, though it's still very rotational under the hood. If you’re looking to increase exposure, this data gives a green light for selective entries, especially in names reclaiming major moving averages.
Breadth is improving, but it’s not yet euphoric. One geopolitical shock, or another disappointing earnings report, could change the tone fast.
For now? The numbers suggest a bit more optimism is warranted.
Kristoff - Co-founder, ChartMill
Next to read: Market Monitor News, June 24