
(All data & visualisations by ChartMill.com)
Daily Market Trend Analysis – May 19, 2025 (After Market Close)
Markets continued to show resilience at the start of the week, with all major indices maintaining their short-term bullish trends. Both the Nasdaq-100 (QQQ) and the S&P 500 (SPY) posted solid gains, forming bullish engulfing patterns on the daily chart, a signal of potential strength ahead.
The Russell 2000 (IWM) also extended its recent rebound but faced overhead resistance near the $210 zone.
Short Term Trend
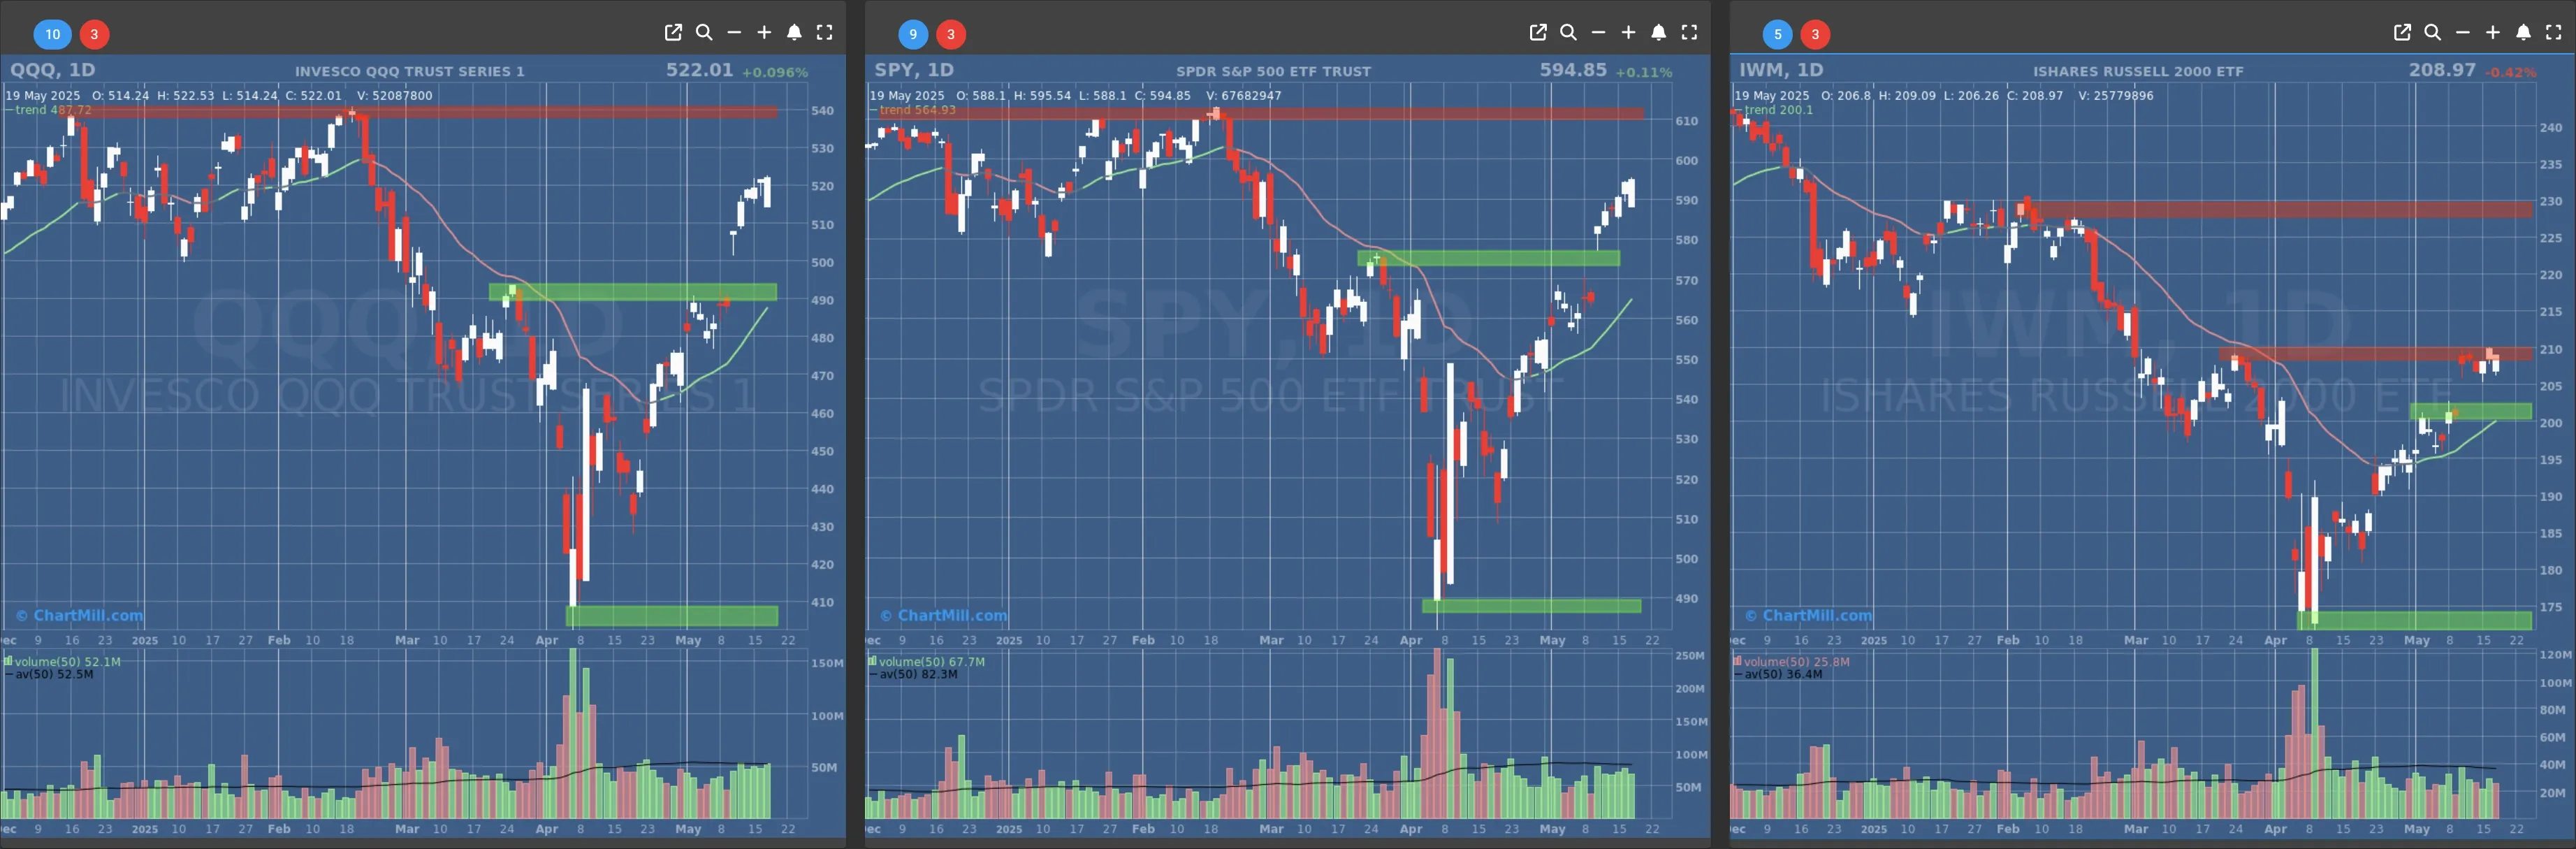
- Short-Term Trend: Bullish (no change)
- Support at $560 - $570
- Resistance at $610
- Volume: At average (50)
- Pattern: Bullish Engulfing candle
- Short-Term Trend: Bullish (no change)
- Support at $490 - $500
- Resistance at $540
- Volume: At average (50)
- Pattern: Bullish Engulfing candle
- Short-Term Trend: Bullish (no change)
- Support at $200
- Resistance at $210-215
- Volume: Below average (50)
- Pattern: Up day
Long Term Trend
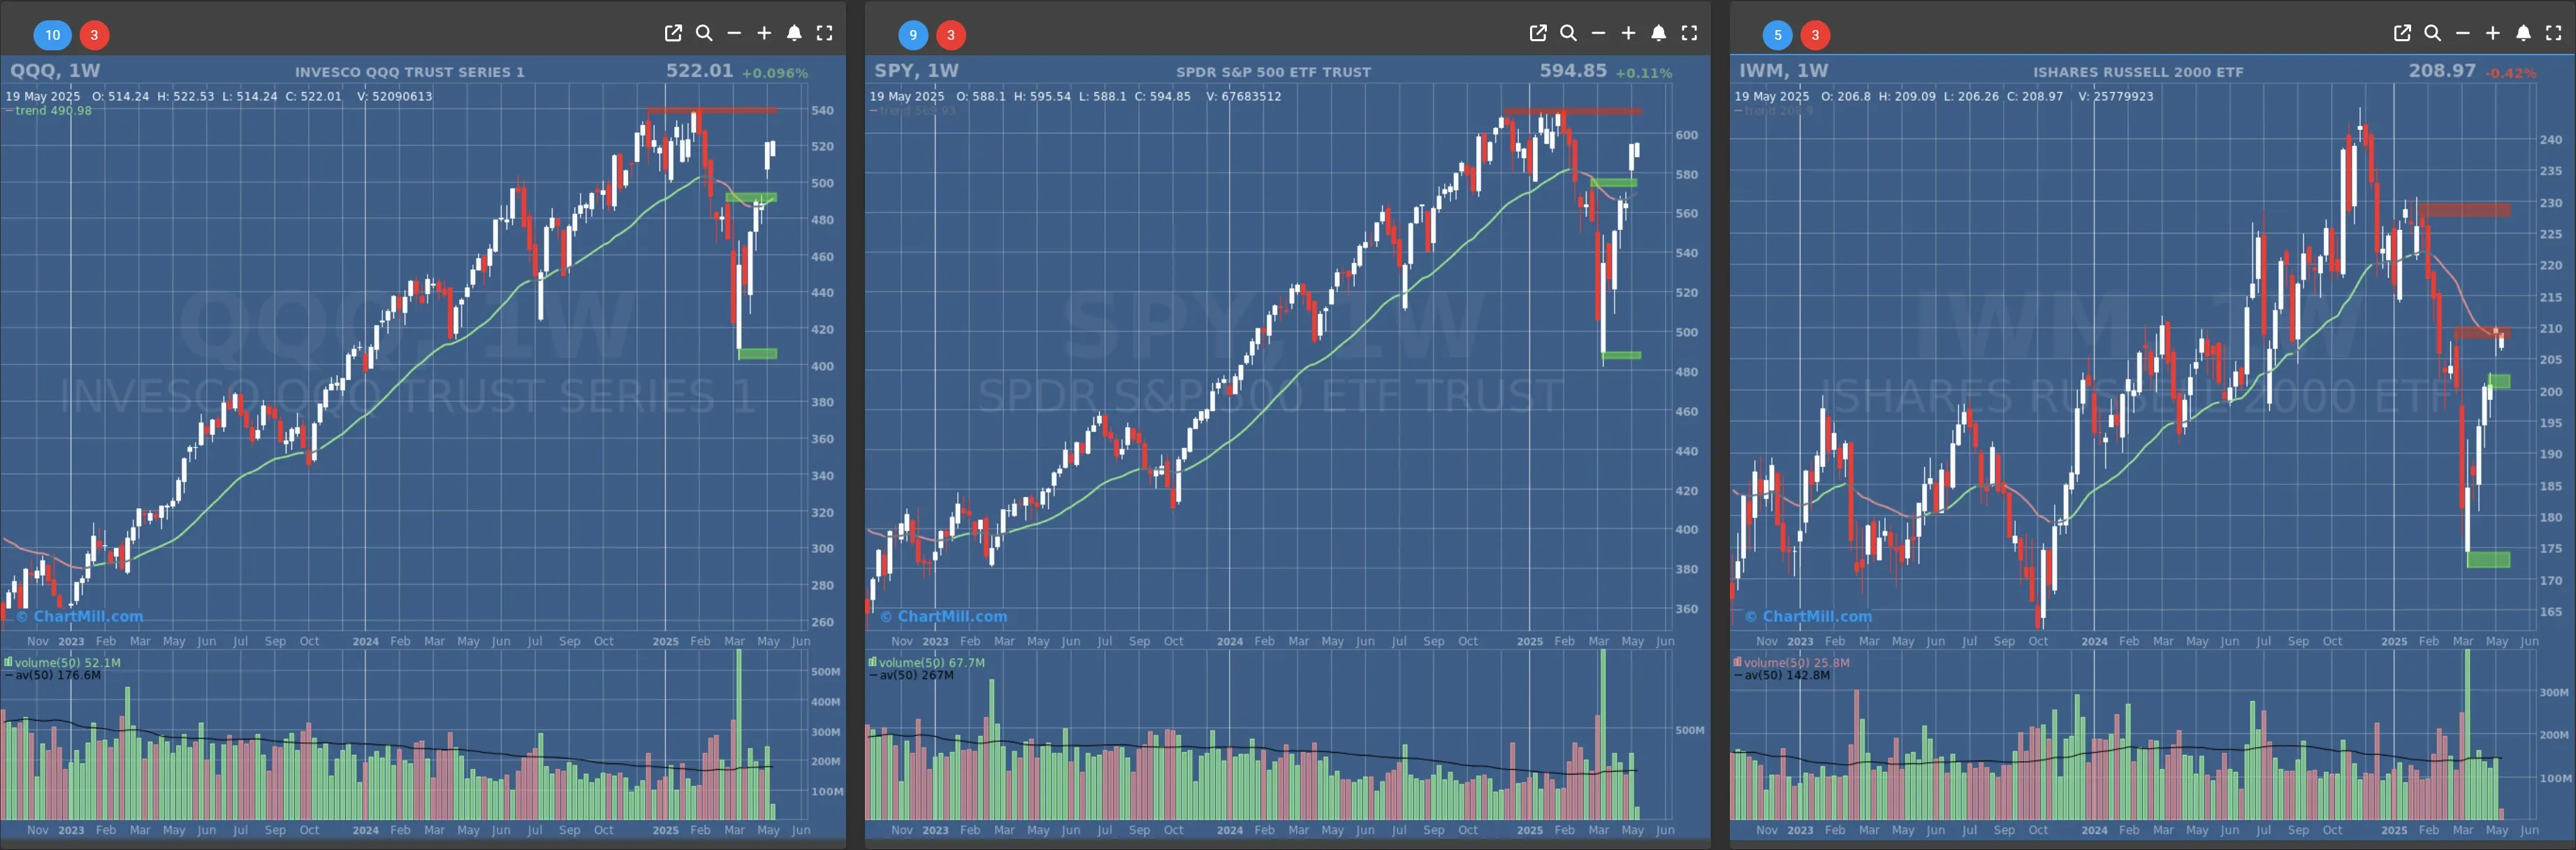
- Long-Term Trend: Neutral (no change)
- Long-Term Trend: Positive (no change)
- Long-Term Trend: Neutral (no change)
Daily Market Breadth Analysis – May 19, 2025 (After Market Close)
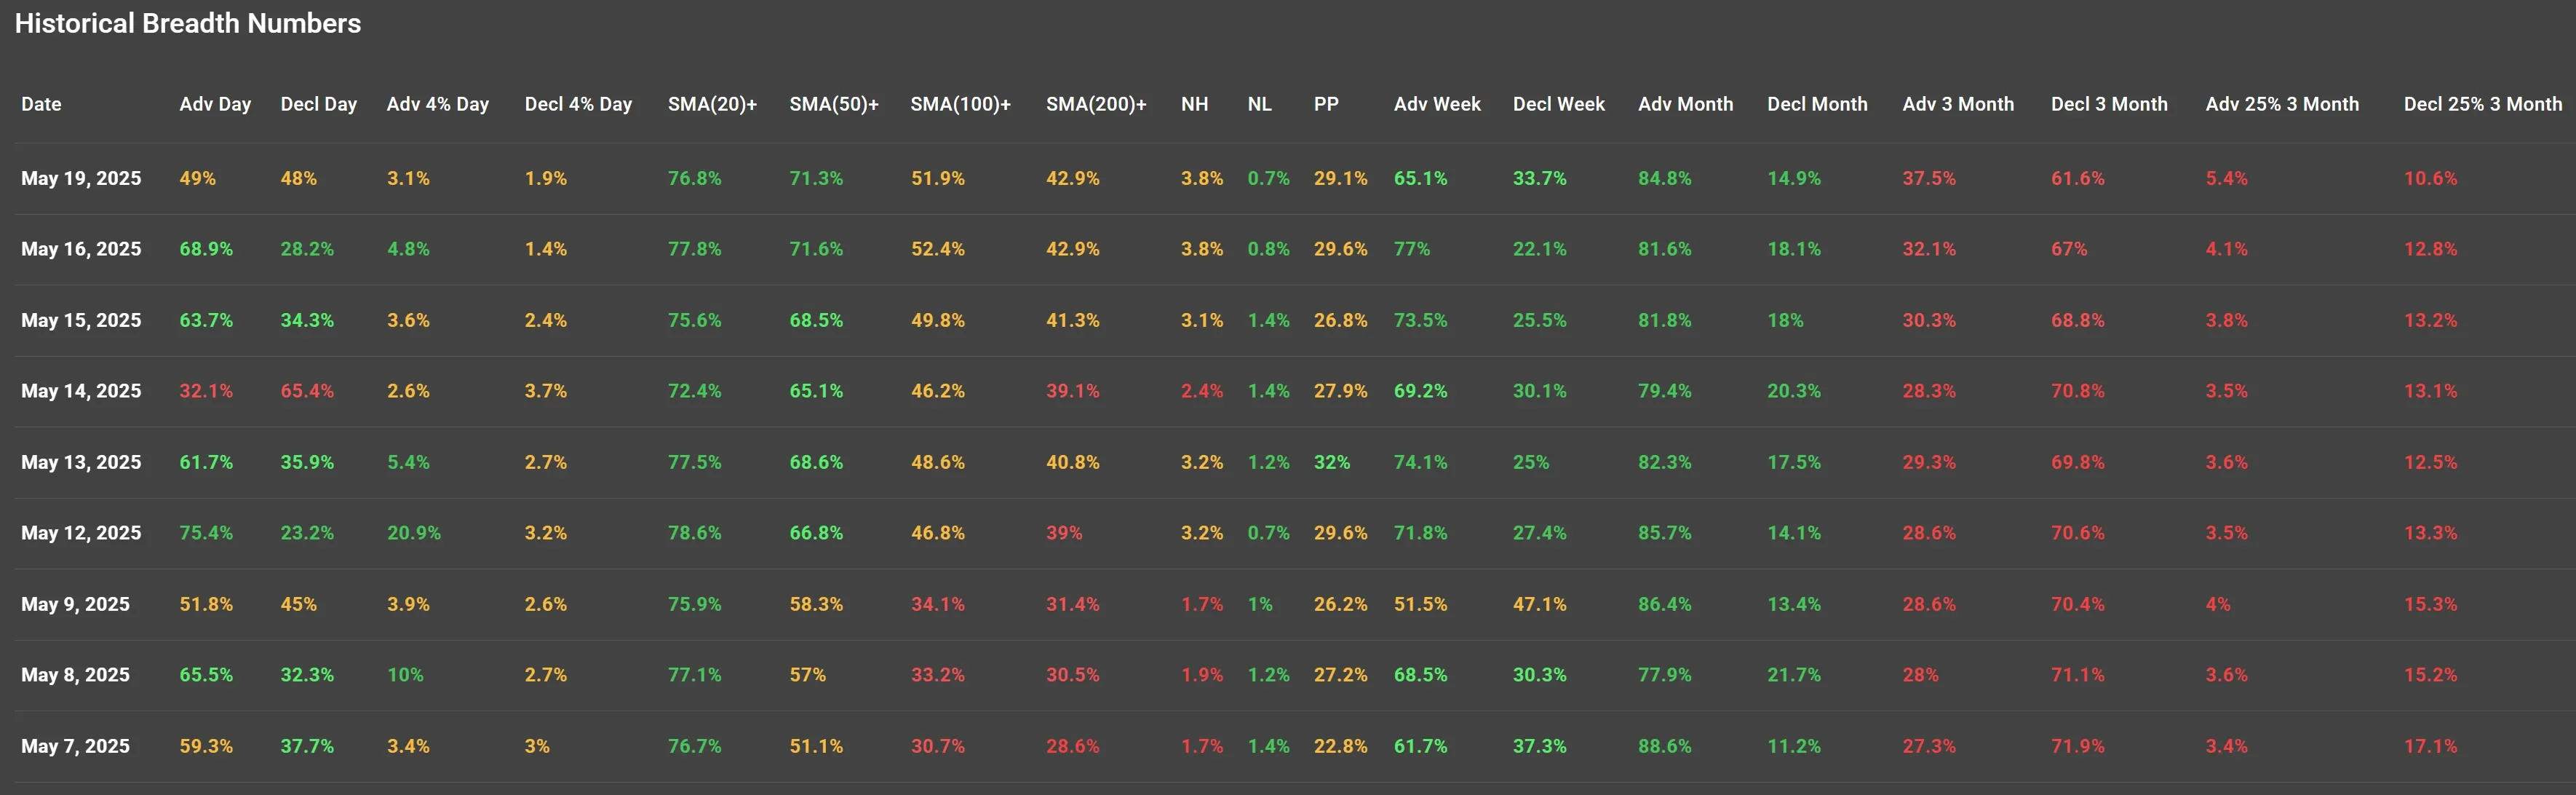
Despite major indices maintaining their bullish momentum, market internals paint a more nuanced picture, suggesting that breadth has recently narrowed.
Daily Breadth: Participation Fades Slightly
The percentage of advancing stocks on May 19 fell to 49%, nearly equaling the number of decliners at 48%.
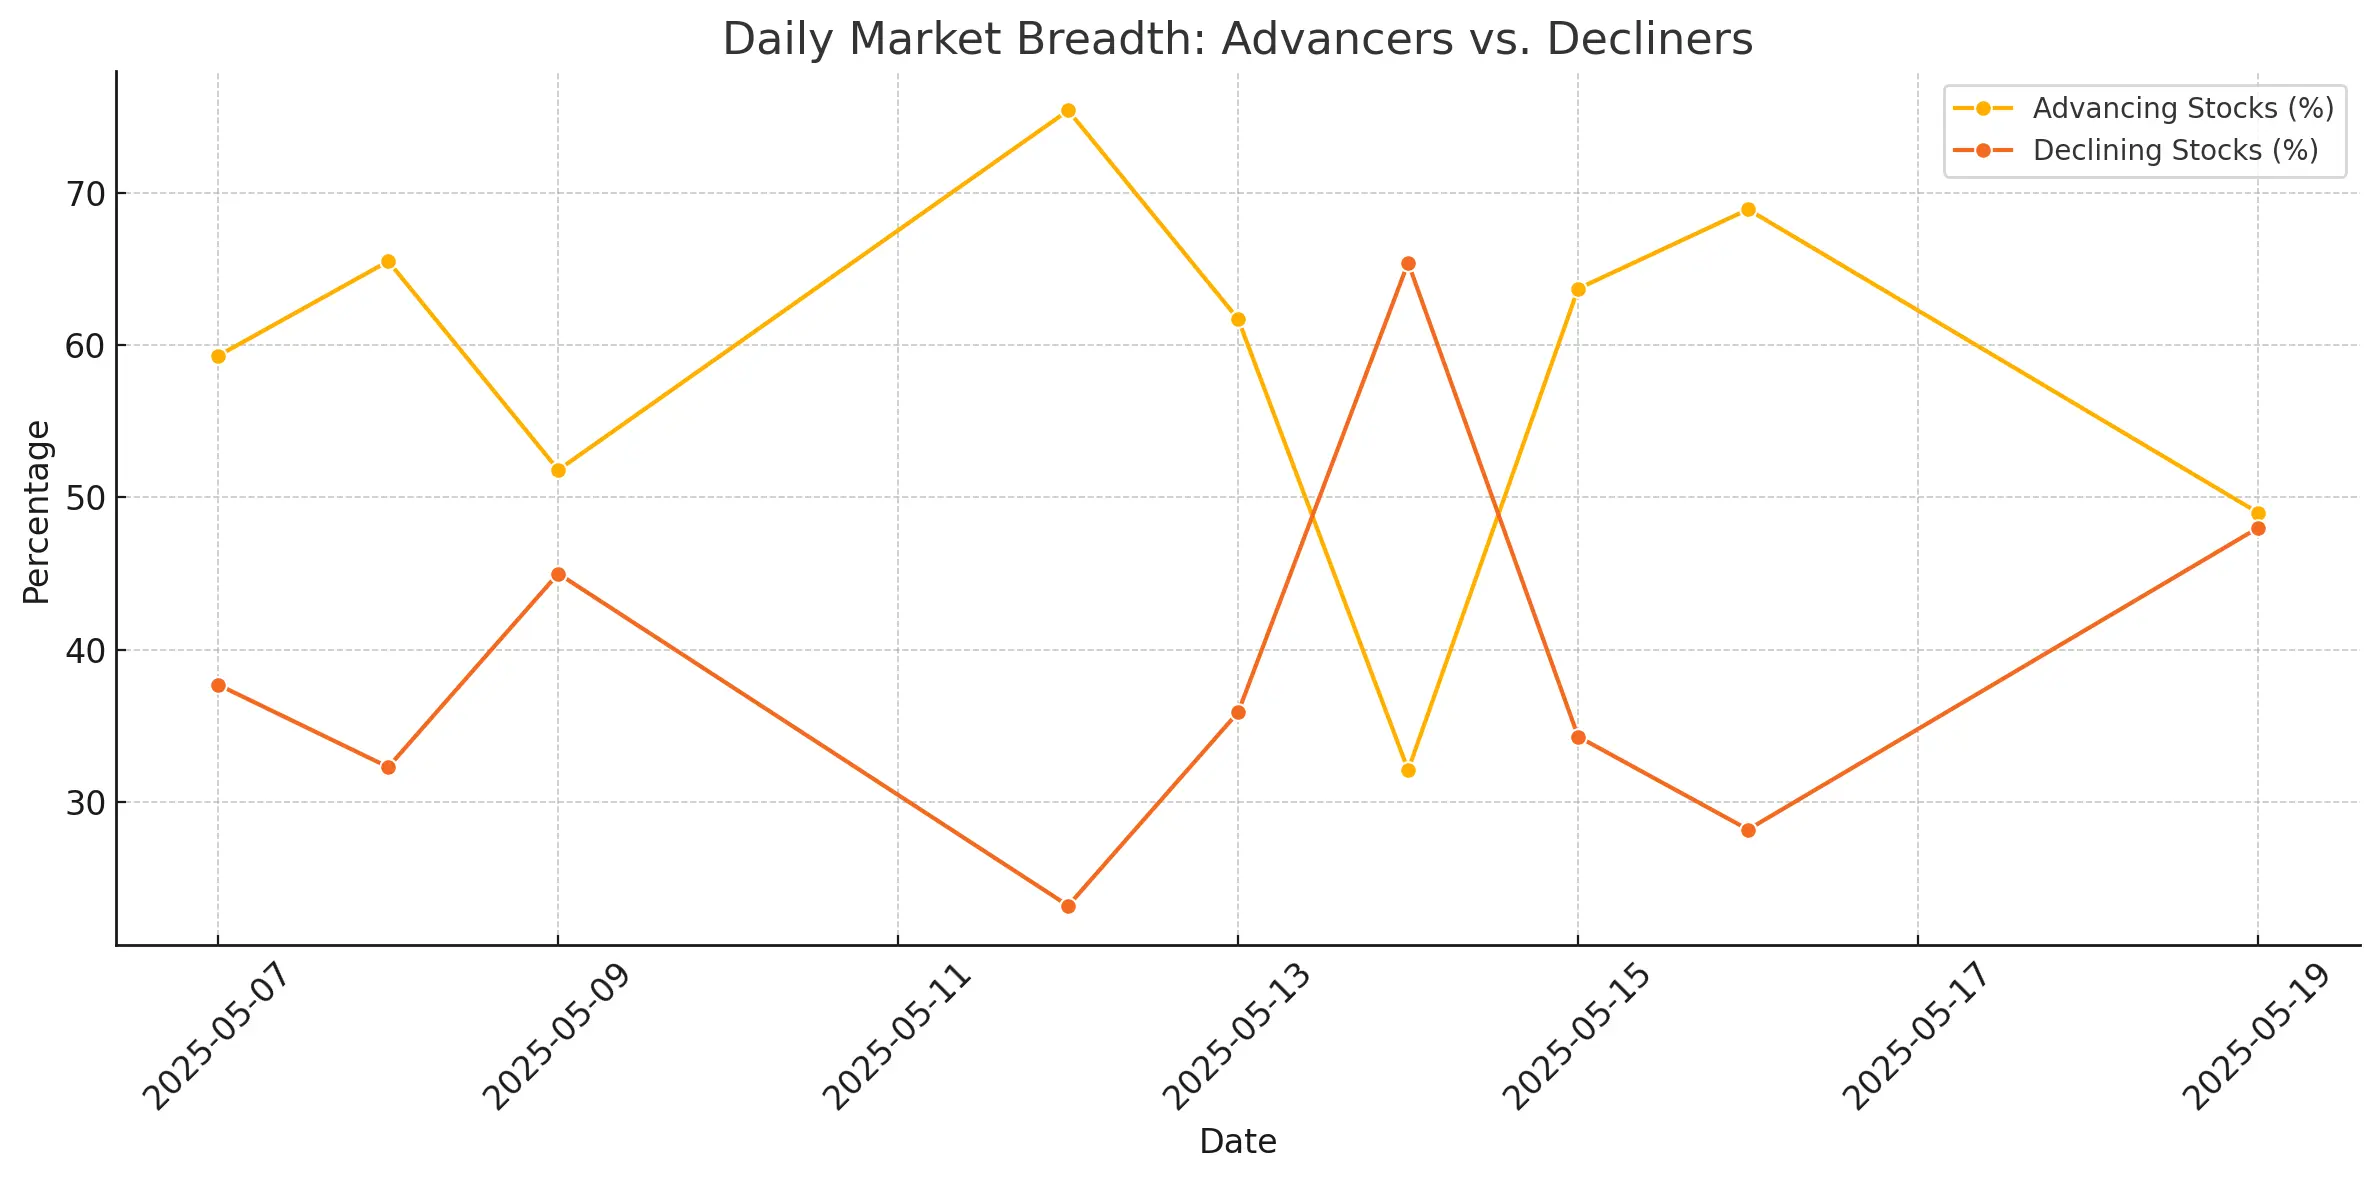
This marks a significant drop from the previous sessions, particularly compared to the strong 68.9% advance rate seen on May 16.
While headline indices remain strong, fewer stocks are participating in the rally—often a sign of potential short-term fatigue.
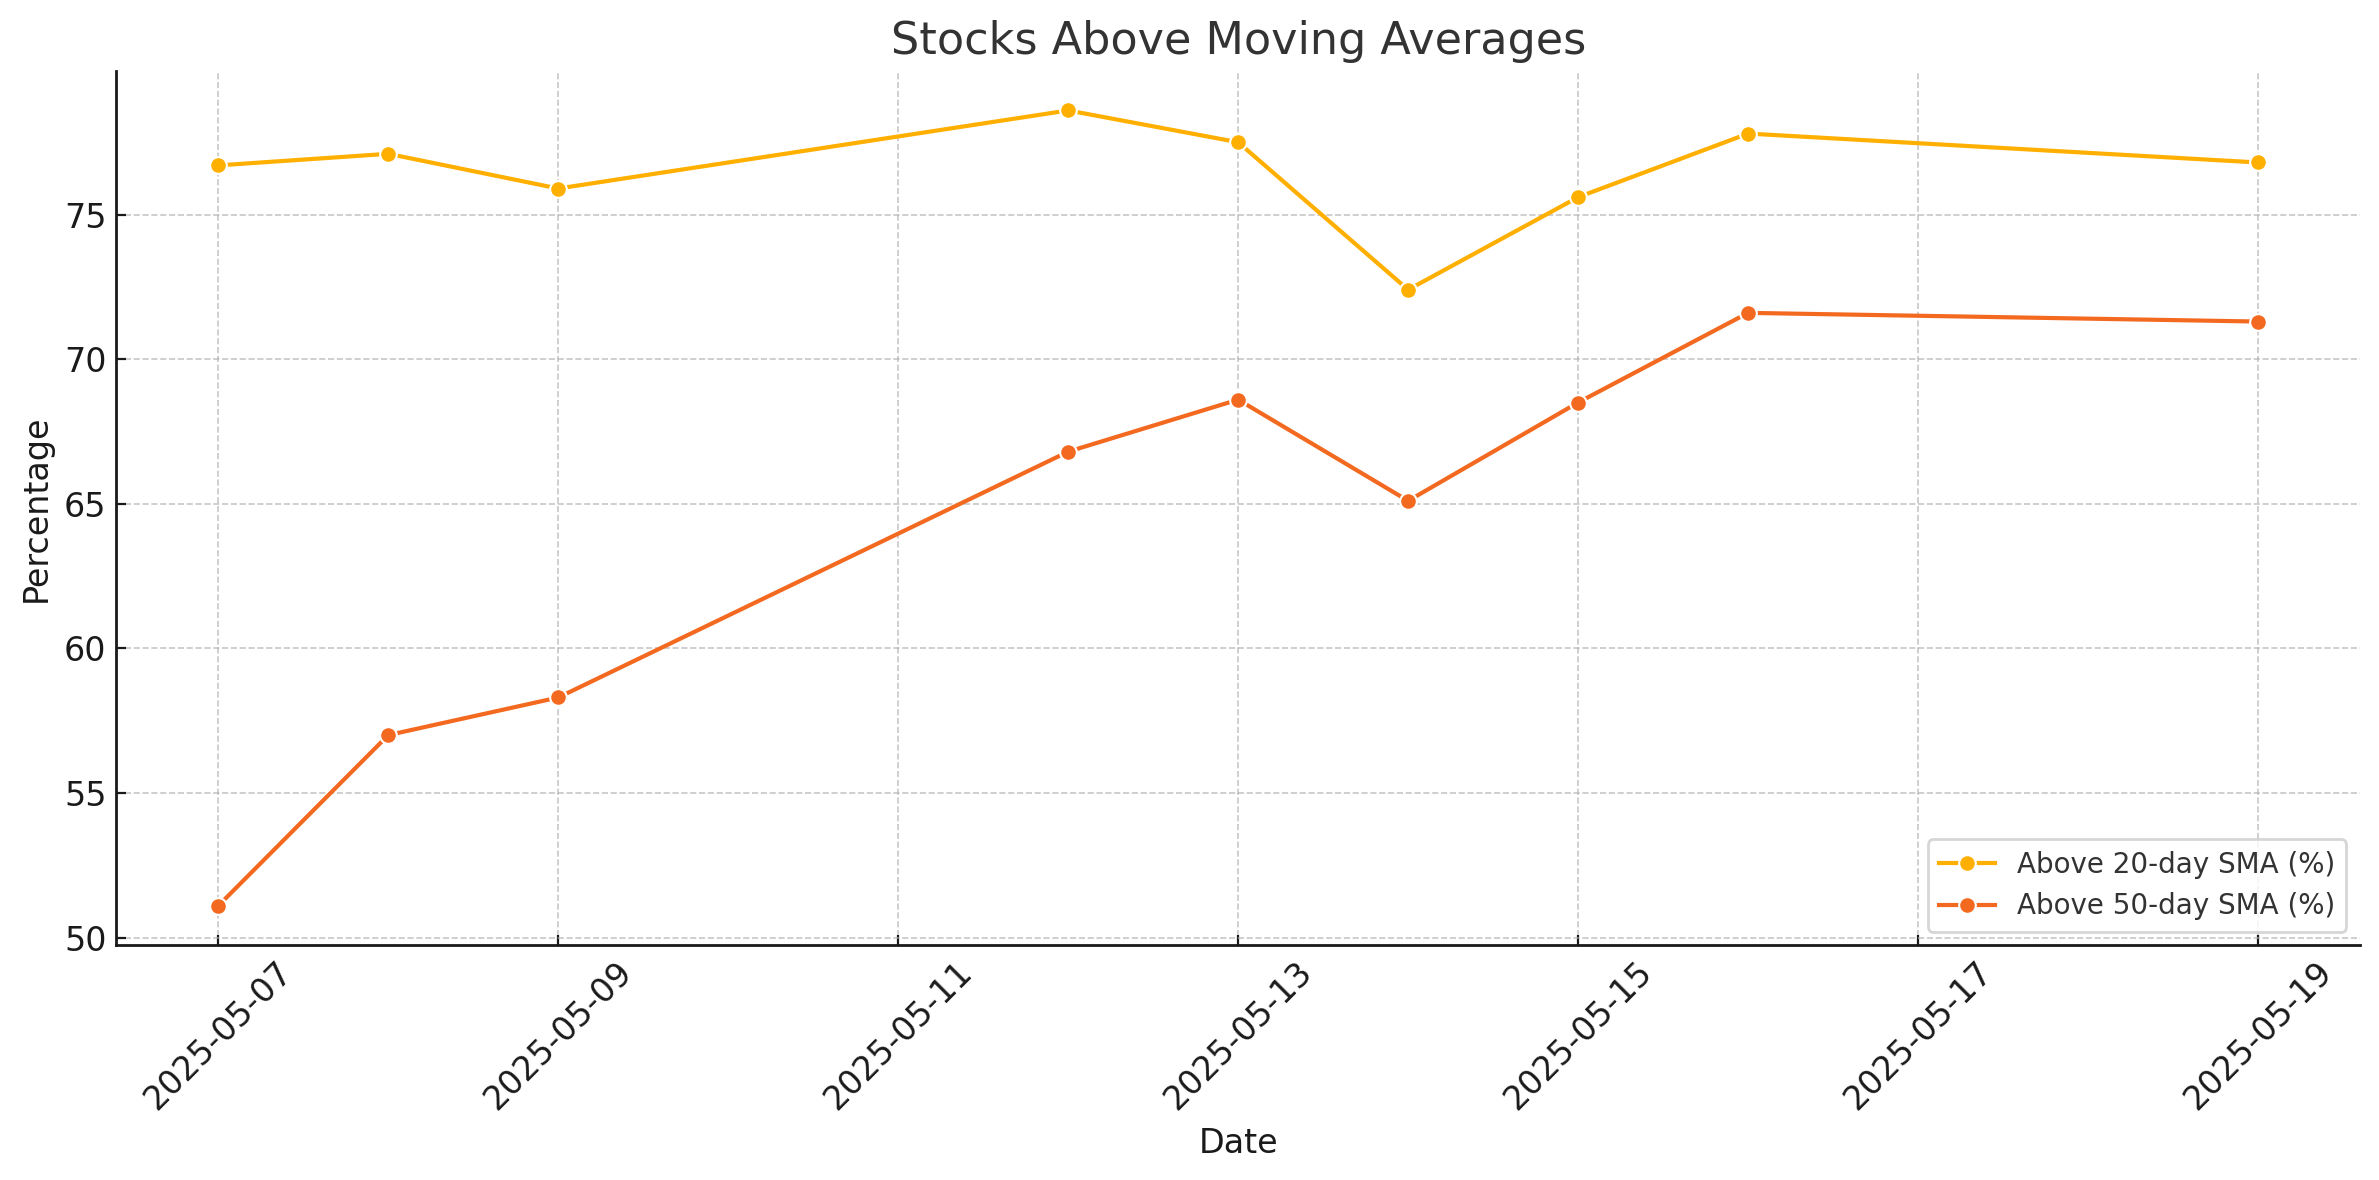
Stocks Above Moving Averages: Still Robust
- 76.8% of stocks are trading above their 20-day SMA
- 71.3% are above their 50-day SMA
These numbers remain healthy and reflect that short- and medium-term trends are still largely intact. Both statistics have stagnated over the past few sessions, though, and to keep up the momentum there is a need for further broader participation.
Weekly Breadth: Advance Still Leading
On a weekly basis:
- 65.1% of stocks were advancing
- 33.7% were declining
Although slightly weaker than the peak earlier in the week, this still represents a bullish configuration. It suggests the overall trend for the week remains constructive, even as Monday’s session cooled off slightly.
What’s the Risk?
While large-caps indices such as the QQQ and SPY are pushing higher, internal weakening (fewer rising stocks) could lead to pullbacks in the short term. As for The Russell 2000 (IWM), it continues to struggle with overhead resistance and breadth within this segment is thinner.
Conclusion
Market breadth has cooled slightly from last week’s strong thrust, especially on a daily level. For the moment, weekly and moving average participation metrics still support the uptrend.
If breadth doesn't re-expand soon, the rally risks becoming increasingly reliant on fewer mega-cap names.
Next to read: Market News May 20