(All data & visualisations by ChartMill.com)
Daily Market Trend Analysis – June 24, 2025 (After Market Close)
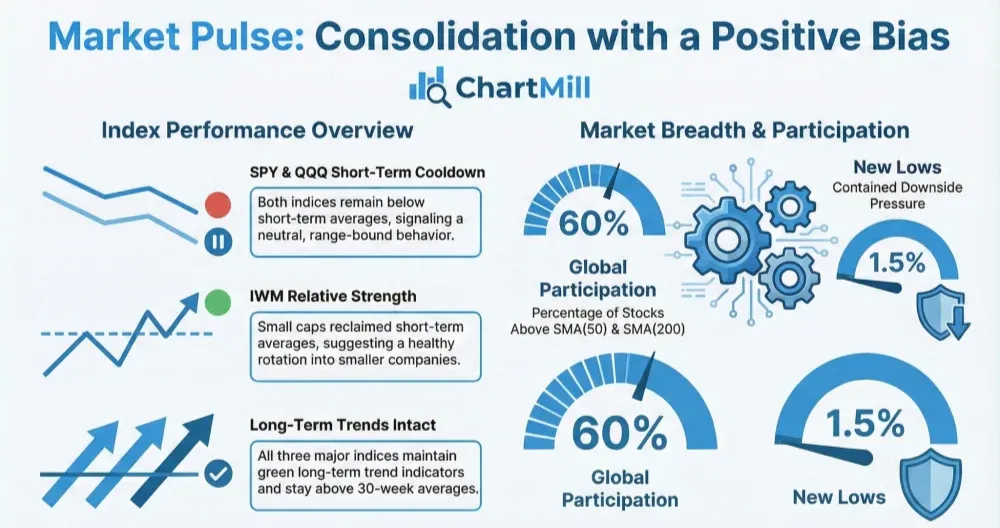
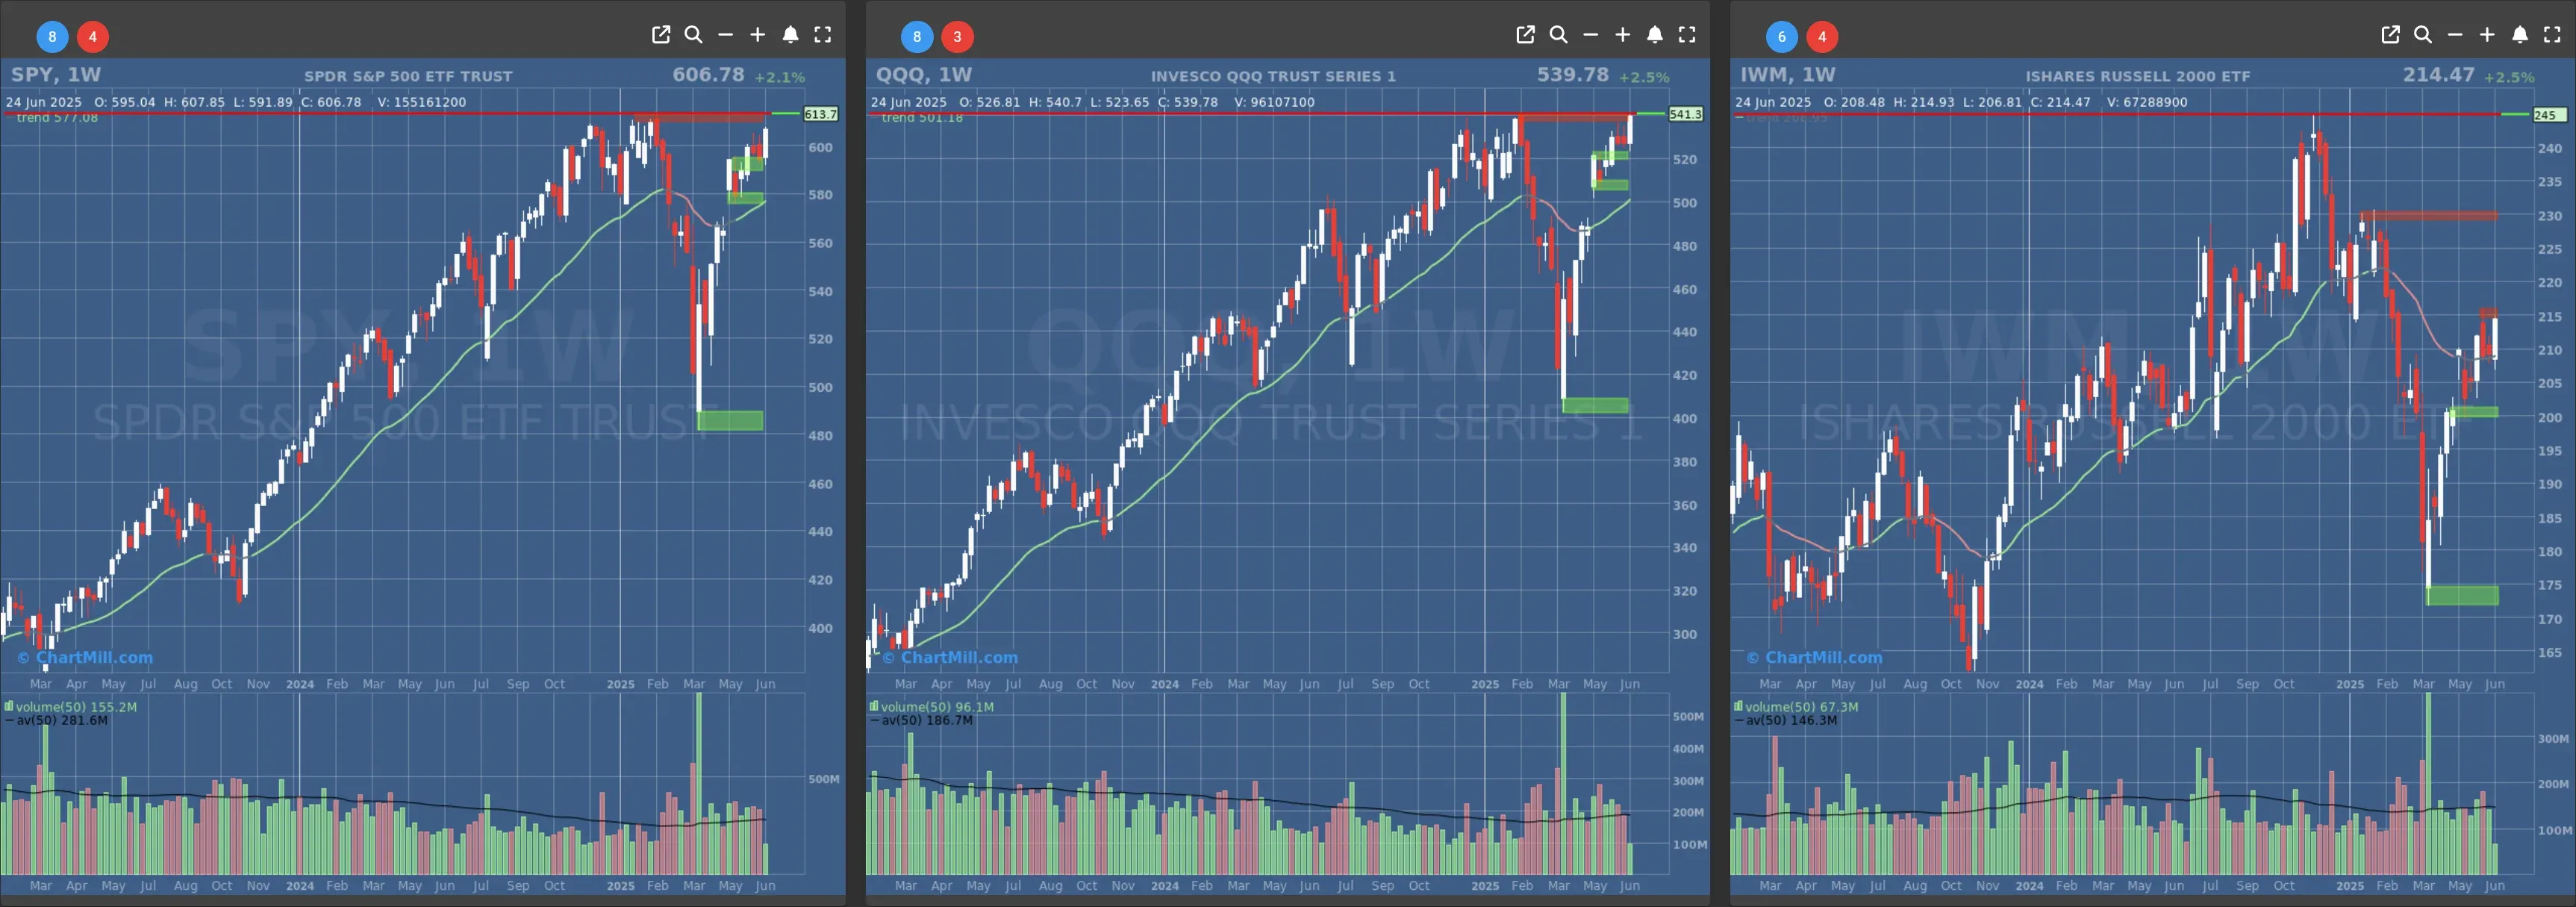
Strong bullish confirmation candles for SPY, QQQ, and IWM. SPY and QQQ are very close to their all-time highs. IWM has completed a cup-and-handle pattern.
Short Term Trend
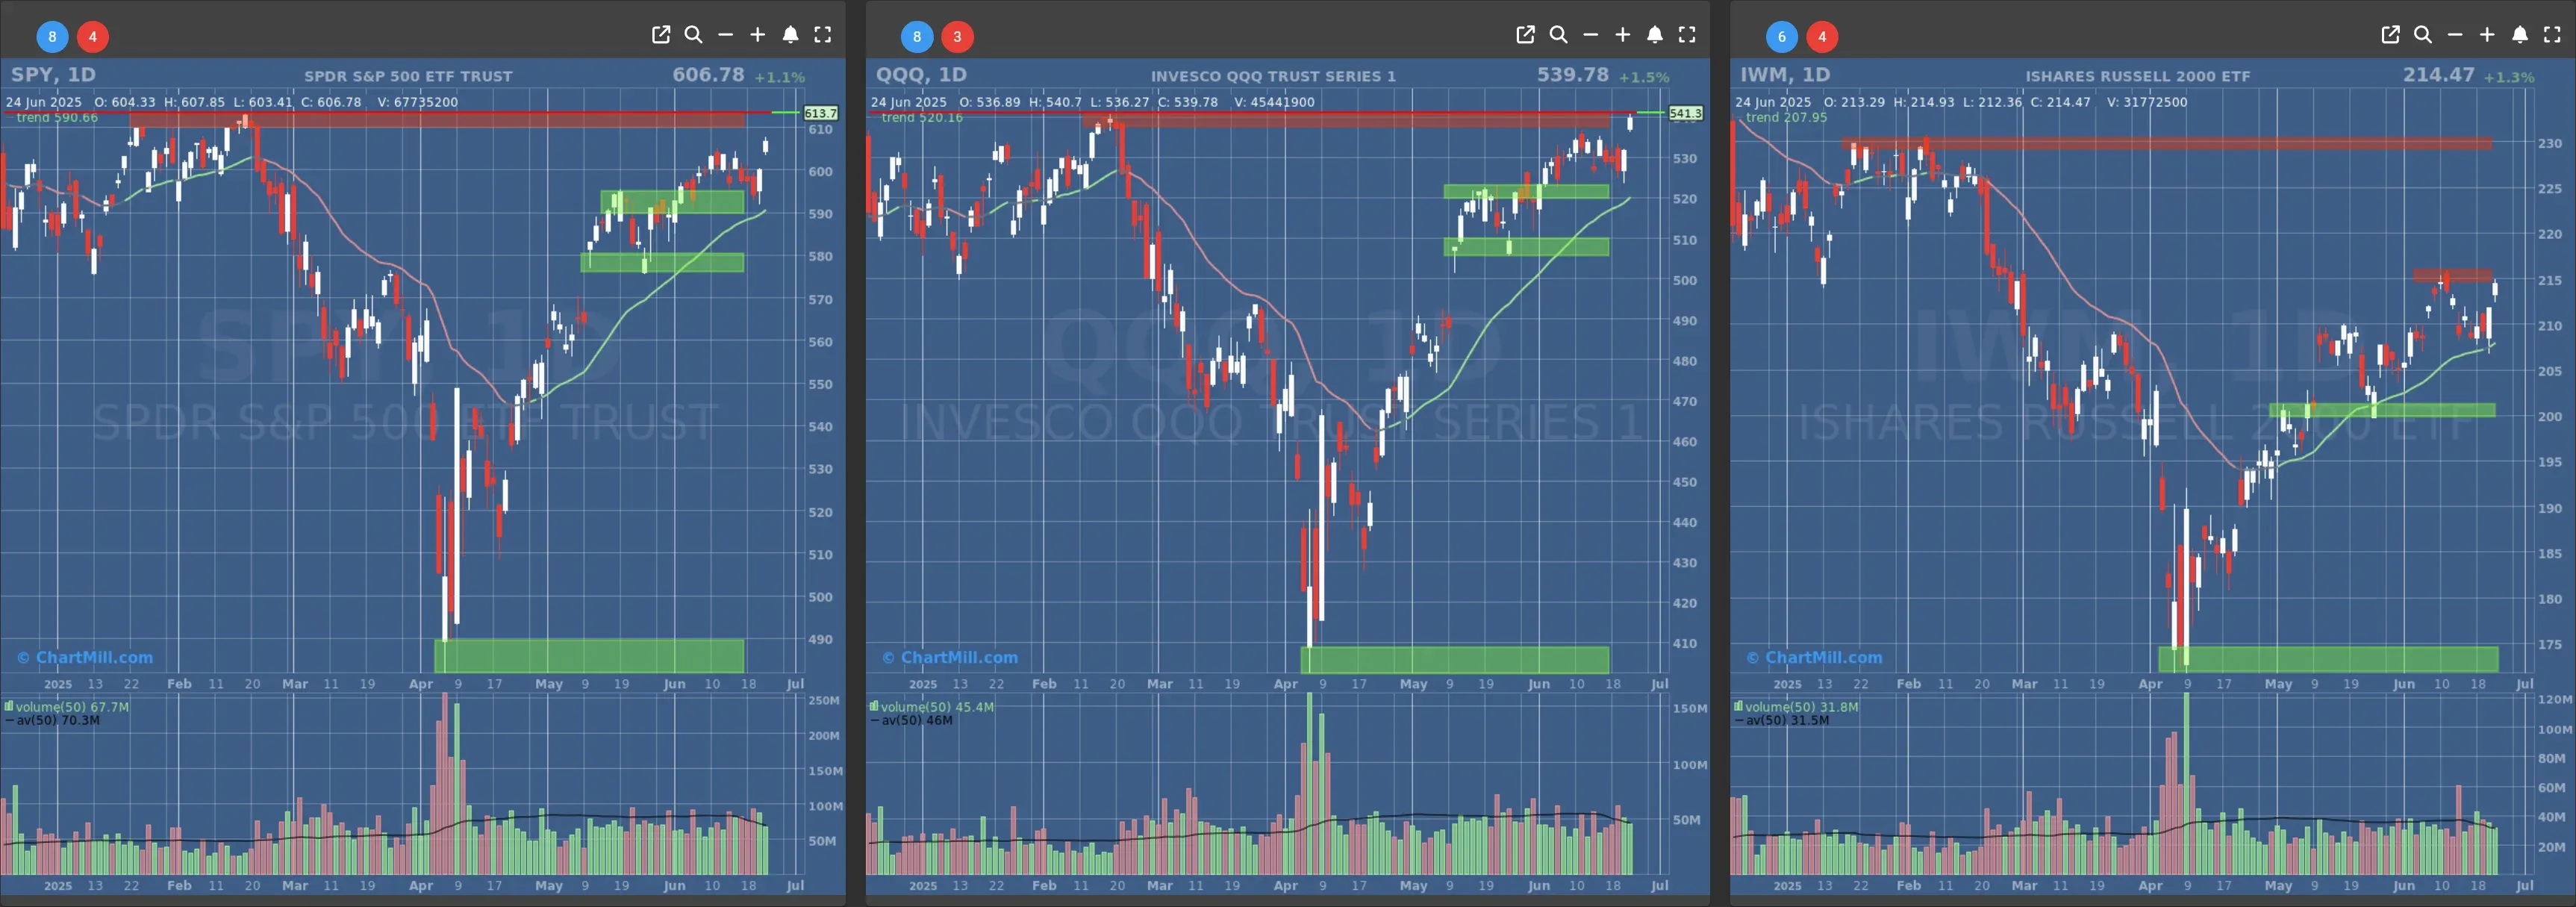
- Short-Term Trend: Bullish (no change)
- Next Support at $580
- Next Resistance at $610
- Volume: At Average (50)
- Pattern: Gap Up Candle
- Short-Term Trend: Bullish (no change)
- Next Support at $520
- Next Resistance at $540
- Volume: At Average (50)
- Pattern: Gap Up Candle
- Short-Term Trend: Bullish (no change)
- Next Support at $210 & $205
- Next Resistance at $215 & $230
- Volume: At Average (50)
- Pattern: Gap Up Candle
Long Term Trend
- Long-Term Trend: Positive (no change)
- Long-Term Trend: Positive (no change)
- Long-Term Trend: Neutral (no change)
Daily Market Breadth Analysis – June 24, 2025 (After Market Close)
It’s one thing to see the major indices post a strong green day, it’s another to watch the breadth data confirm it. And that’s exactly what we got on June 24.
After a week of shaky internals, yesterday's surge brought real participation from the broader market. This wasn’t just another tech-driven melt-up. Under the hood, things genuinely improved.
Broad-Based Strength for a Change
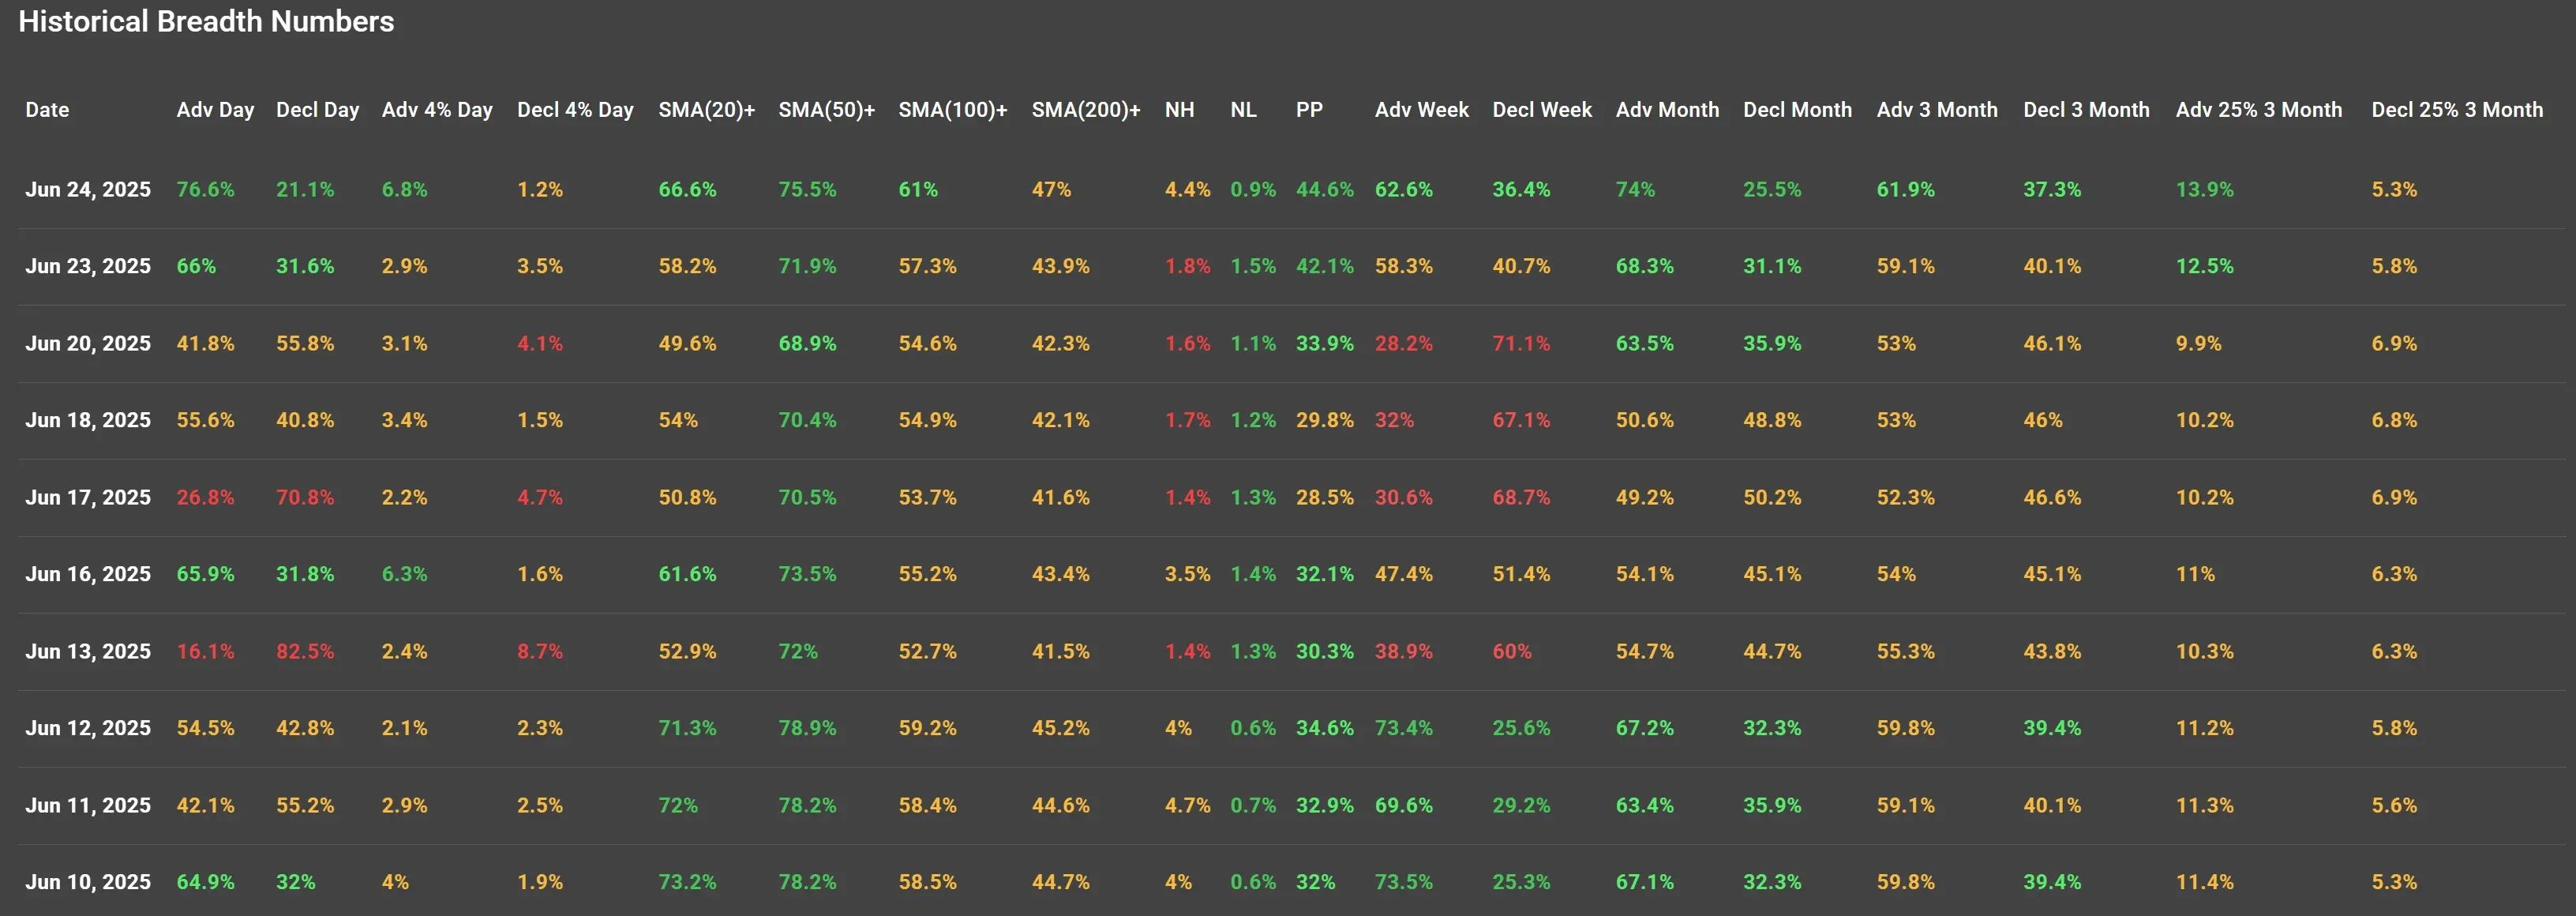
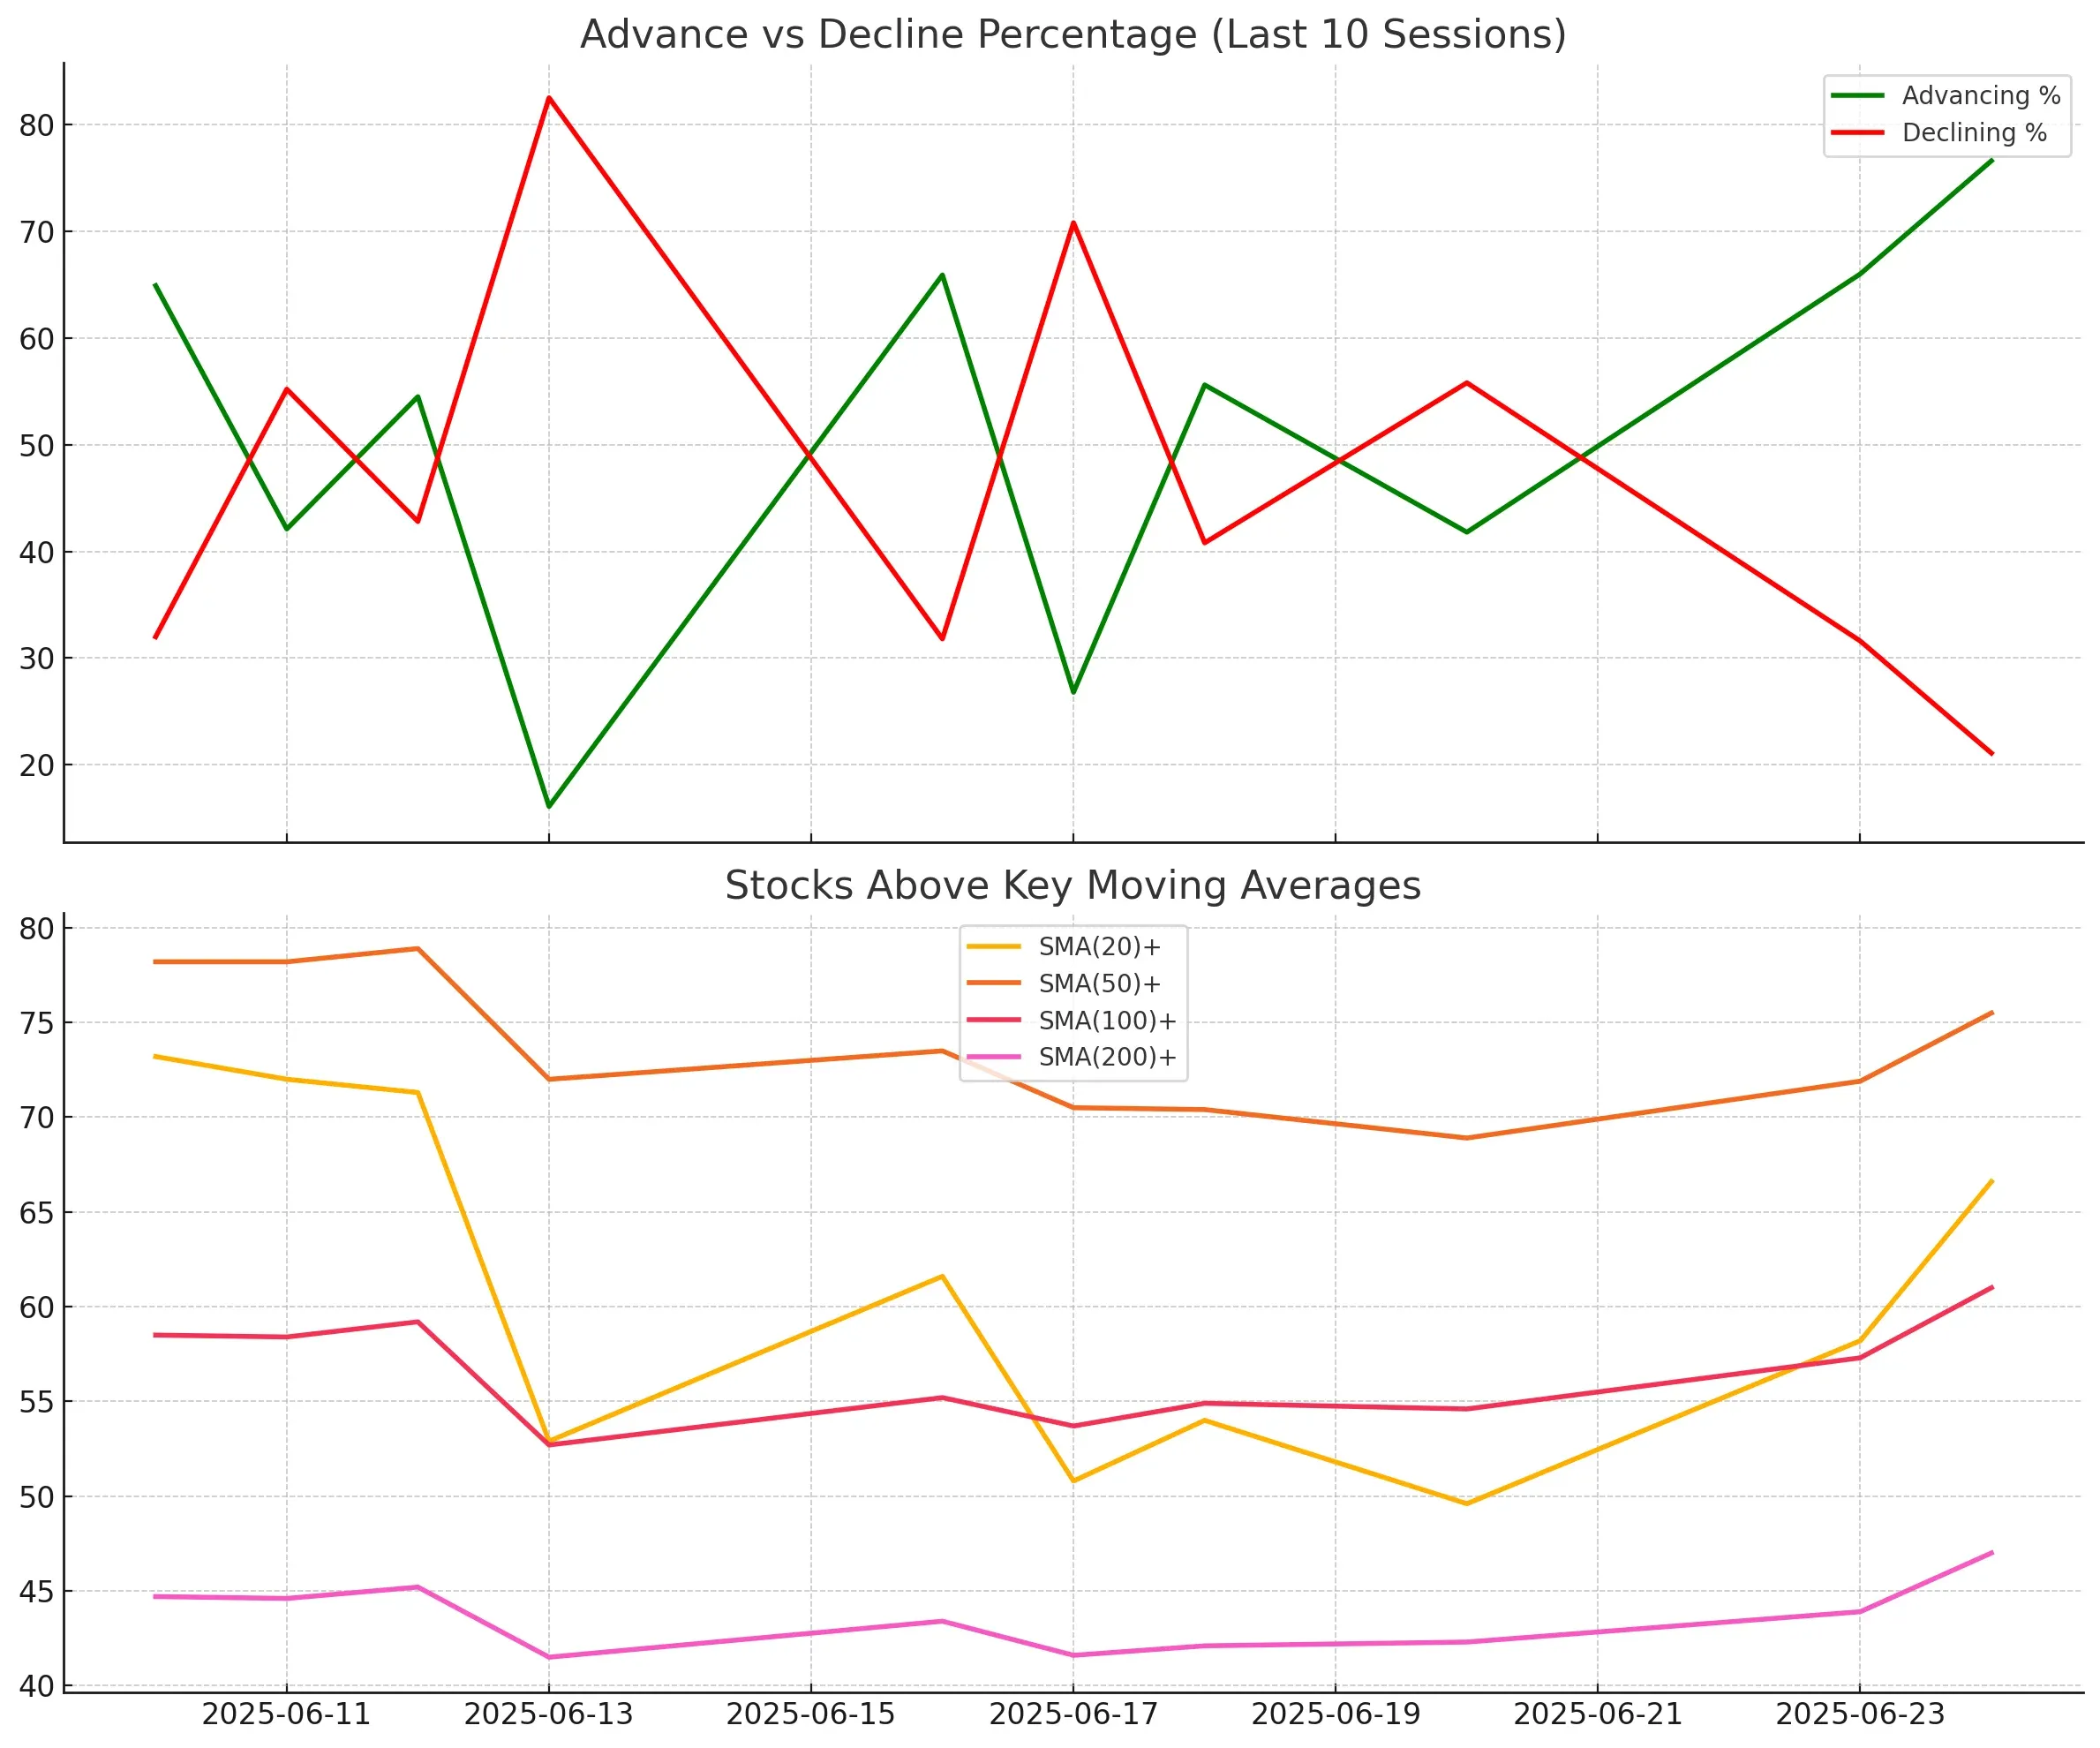
Let’s start with the basics: 76.6% of stocks advanced on the day, while just 21.1% declined. That’s the strongest ratio we’ve seen since a long time.
Compare that to last Thursday (June 20), where only 41.8% of stocks advanced and the majority were still in decline. That session had all the markings of a market trying to rally with its shoelaces tied together.
On June 24, even the more selective metrics joined the party. Stocks up more than 4% outnumbered those down by the same margin (6.8% vs. 1.2%), a clear signal that the rally had muscle, not just motion.
Climbing the Moving Average Ladder
A real standout in the data is how many stocks are now trading above key moving averages:
-
SMA(20)+ jumped to 66.6% (from 58.2% the day before)
-
SMA(50)+ pushed up to 75.5% (from 71.9%)
-
SMA(100)+ improved to 61%
-
SMA(200)+, the long-term health barometer, climbed to 47%, the highest reading since June 10
This uptick across all key moving averages reflects a market that’s no longer leaning on just a few big names. It’s been a long time since the 200-day stat flirted with 50%. That’s a positive sign for anyone hoping for sustained momentum.
New Highs Pick Up (Finally)
The number of stocks hitting new 52-week highs also ticked up significantly: 4.4% on June 24 vs. a paltry 1.8% the session prior. Meanwhile, new lows dropped to just 0.9%. That’s the kind of divergence we want to see, expanding leadership, not narrowing.
Context: It Wasn’t Just the Data
Now, if you’re thinking this all seems conveniently timed with the market news, yeah, I’m with you. A de-escalating Middle East crisis definitely lifted spirits across the board. But unlike June 20, where price action surged while internals stayed skeptical, this time the breadth data actually believes in the rally.
That’s a shift worth noting.
Key Takeaway
The bounce we saw on June 24 wasn’t just headline-driven sugar. This was a legitimate breadth expansion: stronger advancers, improving momentum across moving averages, and more stocks hitting fresh highs. That’s a clear signa of a market with legs.
Of course, it’s just one session. But if this participation holds, the rally may finally have the foundation it’s been missing.
Kristoff - Co-founder, ChartMill
Next to read: Market Monitor News, June 25