(All data & visualisations by ChartMill.com)
Daily Market Trend Analysis – September 22, 2025 (After Market Close)
Strong start of the week
Short Term Trend
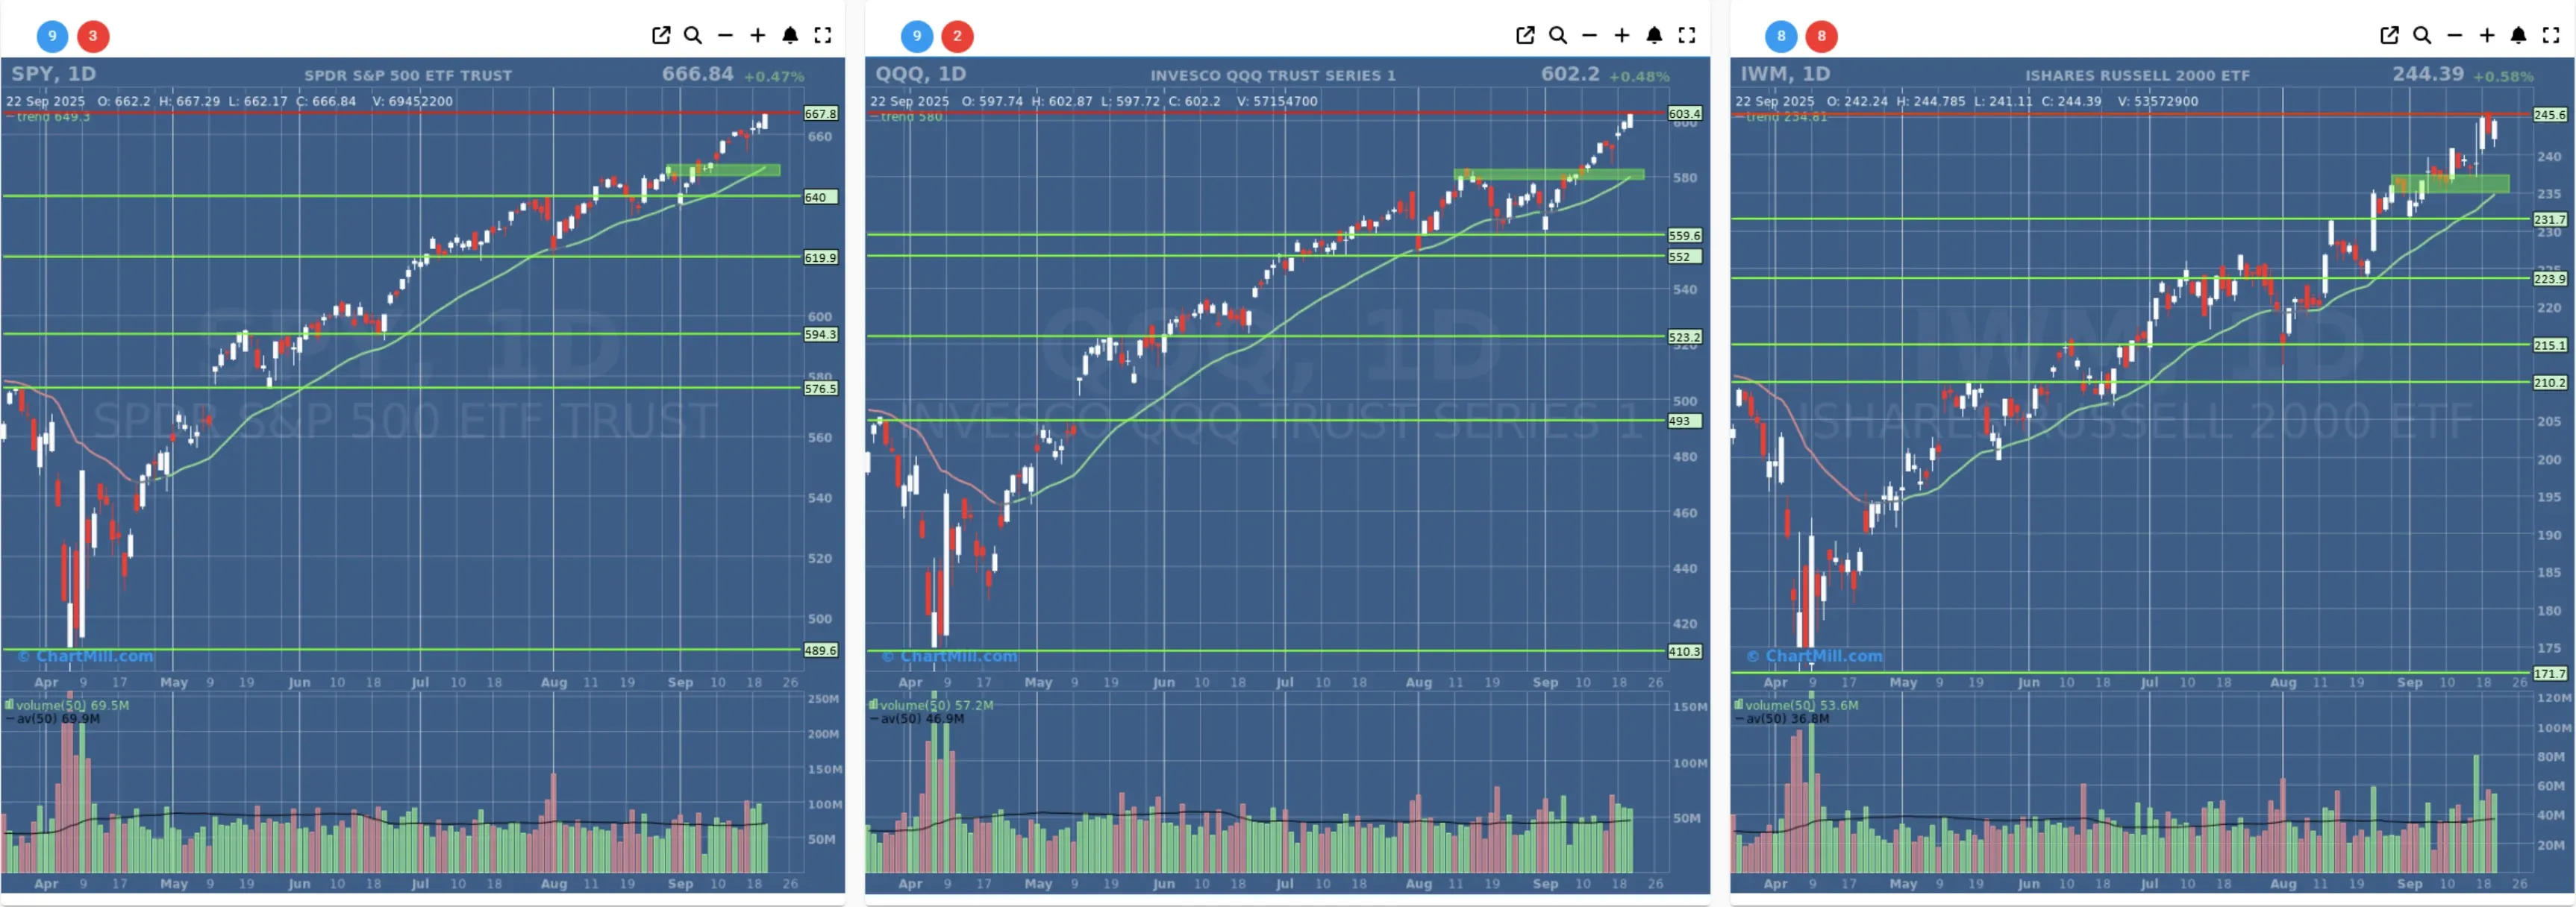
- Short-Term Trend: Positive (no change)
- Next Support at $660 - $650
- Next Resistance at ?
- Volume: At Average (50)
- Pattern: Up Day - New All Time High - Strong Close
- Short-Term Trend: Positive (no change)
- Next Support at $590
- Next Resistance at ?
- Volume: Slightly Above Average (50)
- Pattern: Up Day - New All Time High - Strong Close
- Short-Term Trend: Positive (no change)
- Next Support at $235
- Next Resistance at $245
- Volume: Well Above Average (50)
- Pattern: Up Day - Gap Down - Strong Close
Long Term Trend
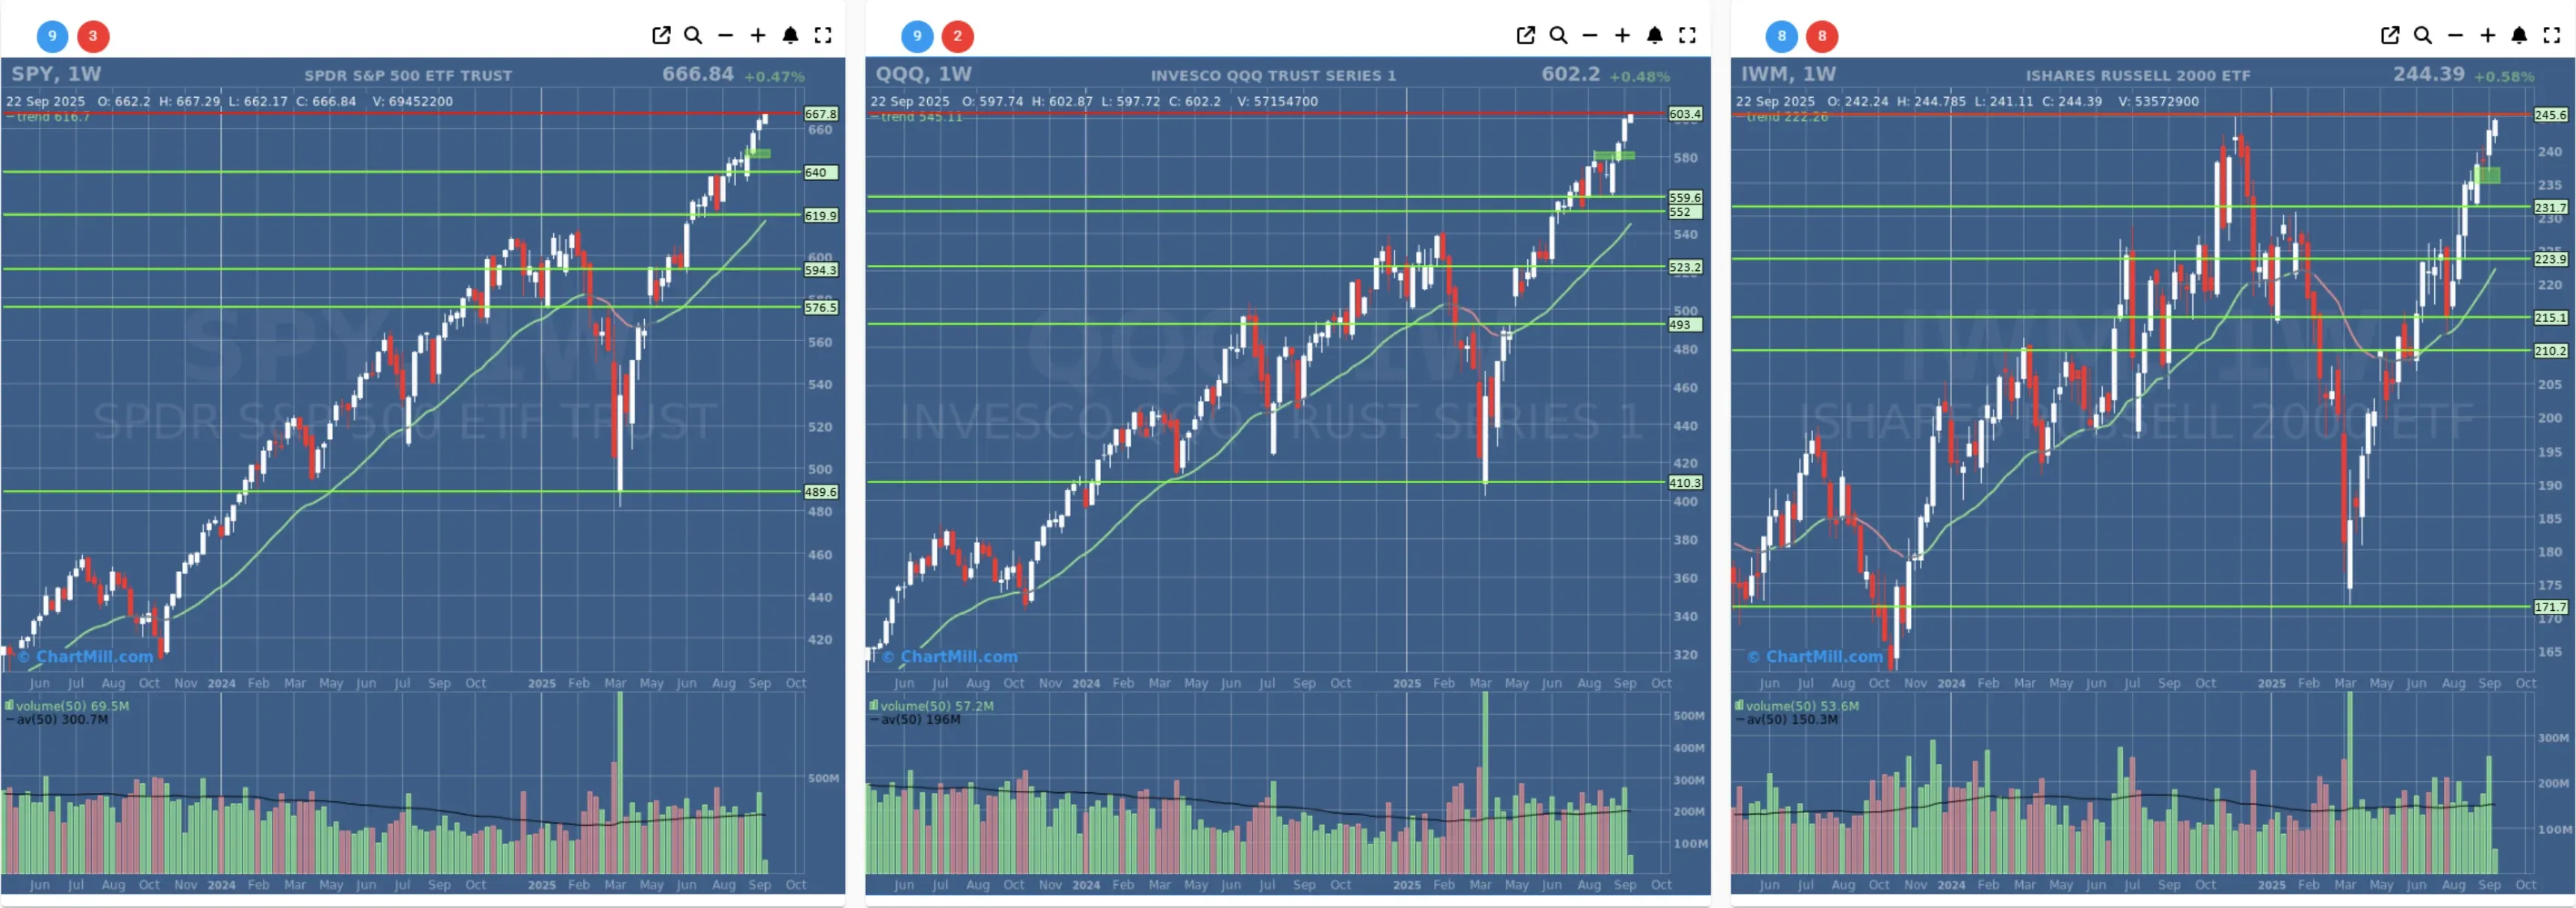
- Long-Term Trend: Positive (no change)
- Long-Term Trend: Positive (no change)
- Long-Term Trend: Positive (from neutral)
Daily Market Breadth Analysis – September 22, 2025 (After Market Close)
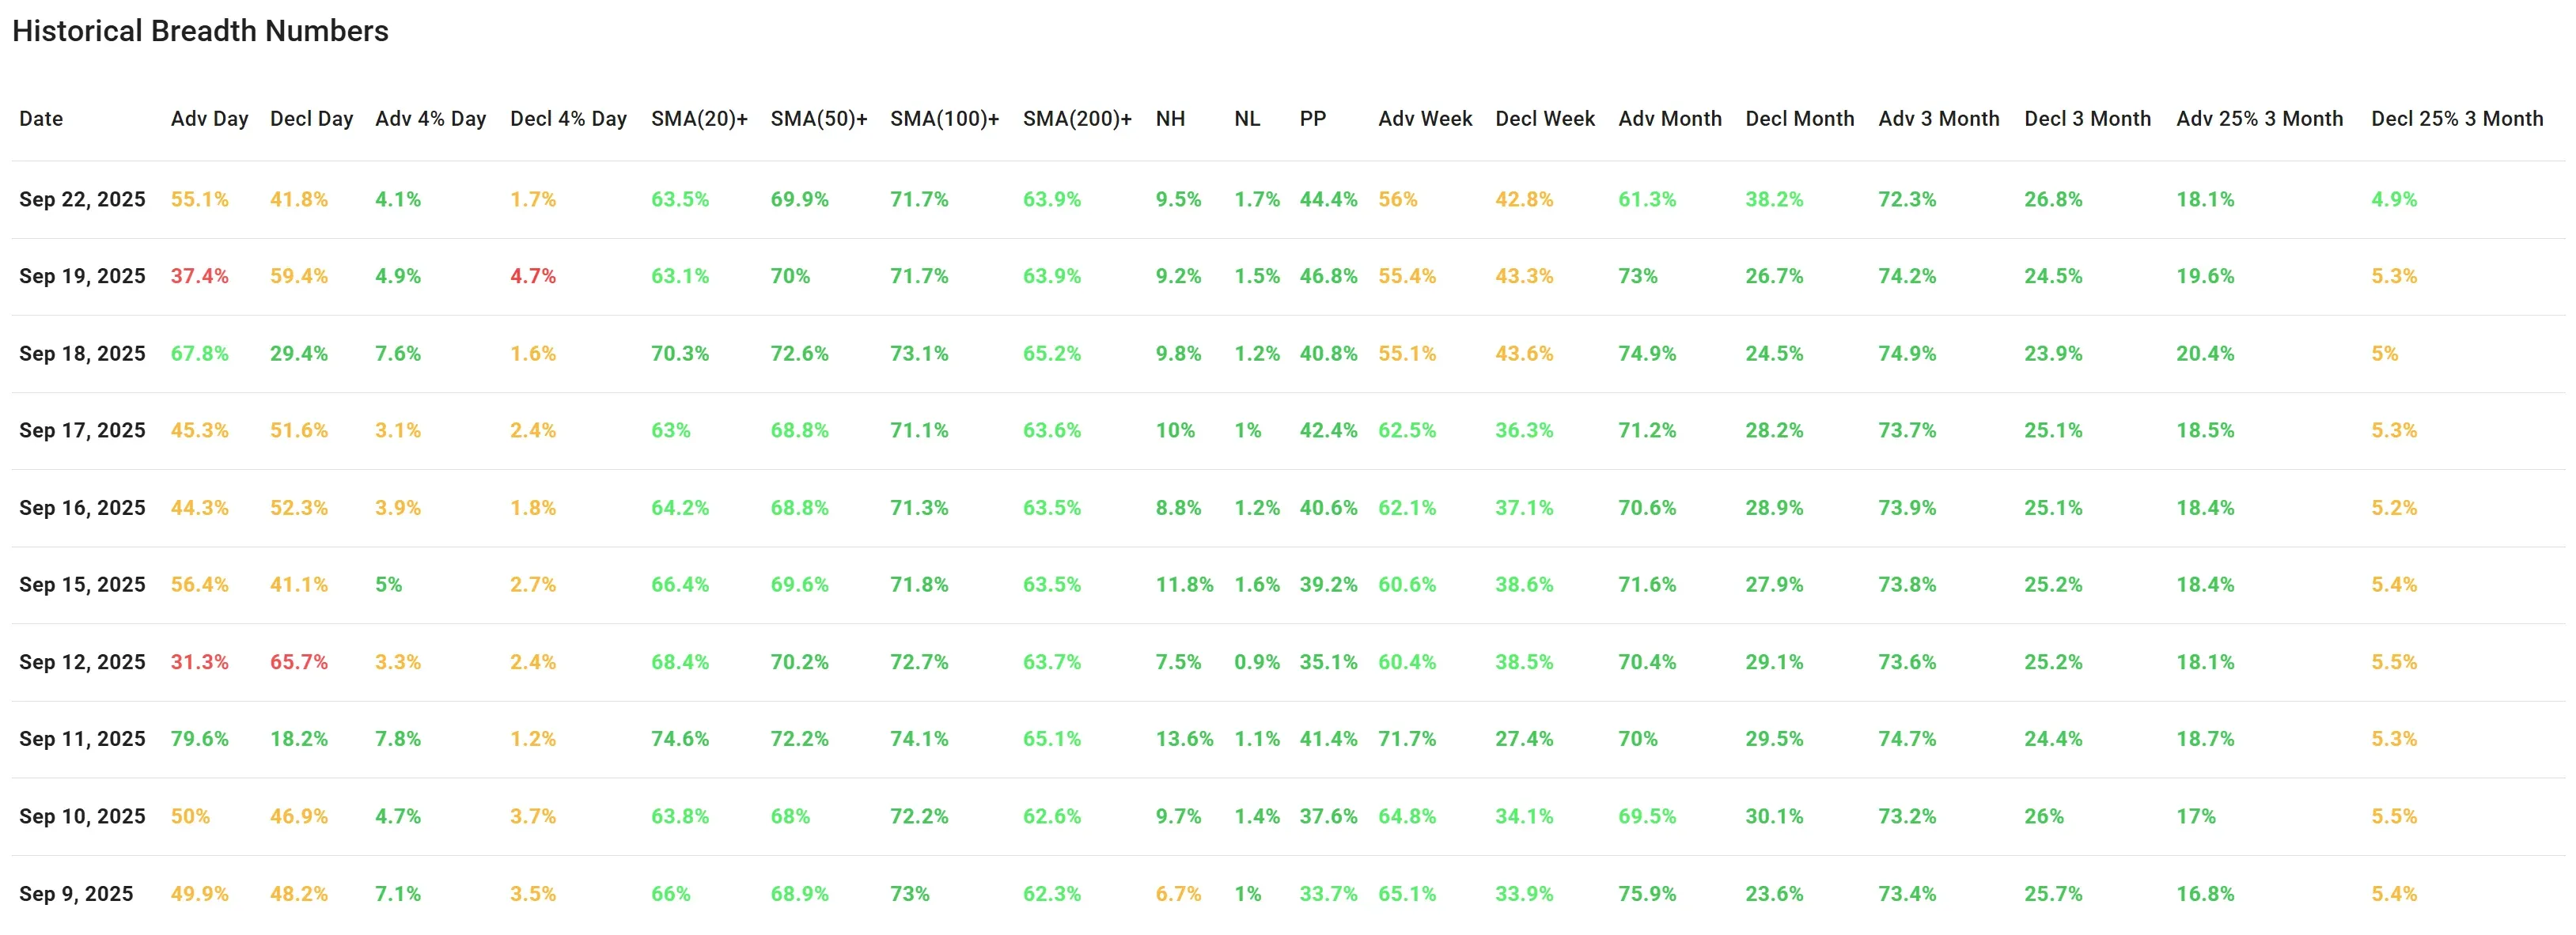
On Monday, September 22, breadth metrics recovered slightly from Friday’s sharp downturn.
Advancers made up 55.1% of the market, reversing the prior session’s weak 37.4% reading and restoring a more balanced tone. Decliners fell back to 41.8% (from 59.4%), while strong movers remained subdued: only 4.1% of stocks gained more than 4%, versus 1.7% losing more than 4%.
This indicates improvement but without clear momentum strength.
Moving Average Participation
Support from medium- and long-term moving averages remained consistent. Roughly two-thirds of stocks continue to trade above their 20-, 50-, 100-, and 200-day SMAs, with only minor fluctuations compared to September 19.
This stability contrasts with the sharper swings seen in daily advance/decline ratios.
New Highs and New Lows
New highs (9.5%) stayed clearly ahead of new lows (1.7%), echoing the broader stability seen in the SMA metrics. The resilience of new highs relative to new lows remains an encouraging sign, even after last week’s volatility.
Short- to Medium-Term Trends
Weekly breadth showed a mixed picture: advancers at 56% versus decliners at 42.8%, close to balance but slightly constructive.
Monthly and 3-month readings still lean positively, with about 70–74% of stocks advancing against ~24–27% declining, though the intensity has faded compared to earlier peaks.
Comparison to Previous Session
Friday, September 19, stood out for its notably weak participation (advancers below 40%, decliners near 60%). Monday’s rebound suggests that session was more of a setback than a trend shift, as breadth quickly returned to more neutral ground.
Breadth Trend Rating: Neutral with a positive bias
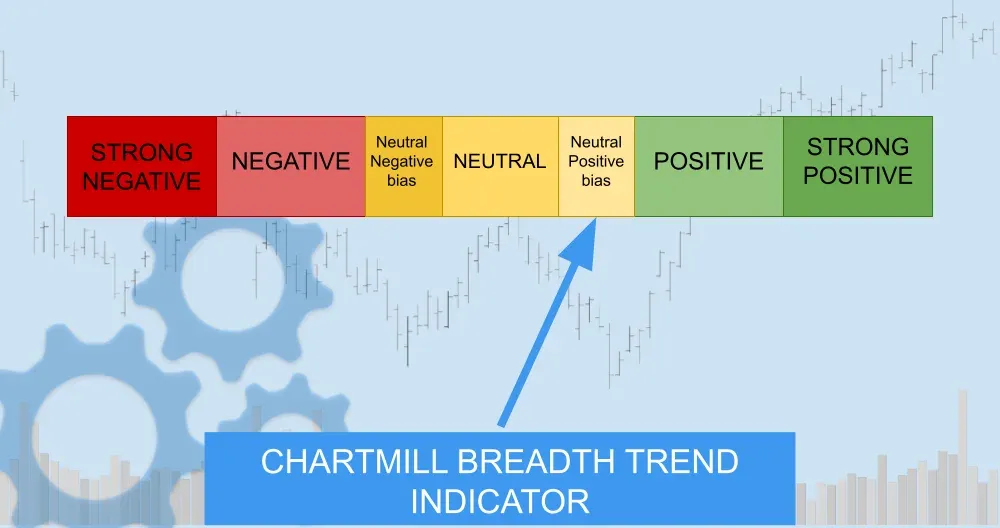
The market avoided follow-through weakness after Friday’s drop, with support still visible across moving averages and new highs maintaining their lead. However, momentum in strong advancing stocks remains muted, keeping the trend from shifting firmly positive.
Summary
-
Market breadth improved on September 22, bouncing back from Friday’s decline.
-
Advancers regained a slim majority, moving averages remain supportive, and new highs continue to outpace new lows.
-
While the market avoided further deterioration, strong momentum is lacking, keeping the breadth trend rated as neutral with a positive bias.
Kristoff - ChartMill
Next to read: Nvidia’s $100B Bet in OpenAI Pushes Wall Street to Fresh Records