

(All data & visualisations by ChartMill.com)
Daily Market Trend Analysis – September 17, 2025 (After Market Close)
Highly volatile session...
Short Term Trend

- Short-Term Trend: Positive (no change)
- Next Support at $650 - $640
- Next Resistance at ?
- Volume: Well above Average (50)
- Pattern: Down Day - Hanging Man Pattern
- Short-Term Trend: Positive (no change)
- Next Support at $580
- Next Resistance at ?
- Volume: Well above Average (50)
- Pattern: Down Day - Hanging Man Pattern
- Short-Term Trend: Positive (no change)
- Next Support at $235
- Next Resistance at $245
- Volume: Far Above Average (50)
- Pattern: Up Day - Doji Candle - New Intraday High
Long Term Trend

- Long-Term Trend: Positive (no change)
- Long-Term Trend: Positive (no change)
- Long-Term Trend: Positive (from neutral)
Daily Market Breadth Analysis – September 17, 2025 (After Market Close)
After two sessions of hesitation, breadth metrics remain mixed, with no decisive push from either side.

Market breadth on Wednesday, September 17, showed little progress compared to the prior session.
Advancing issues accounted for 45.3%, with decliners slightly higher at 51.6%. This is nearly identical to Tuesday’s split (44.3% advancers vs. 52.3% decliners), underlining the ongoing stalemate between buyers and sellers. The proportion of strong movers (±4%) also stayed muted, suggesting a lack of conviction.
Looking at moving averages, short- to medium-term participation edged slightly lower: 63% of stocks remain above their 20-day SMA (down from 64.2% on Tuesday), while the 50-day and 100-day SMAs held steady at around 69–71%.
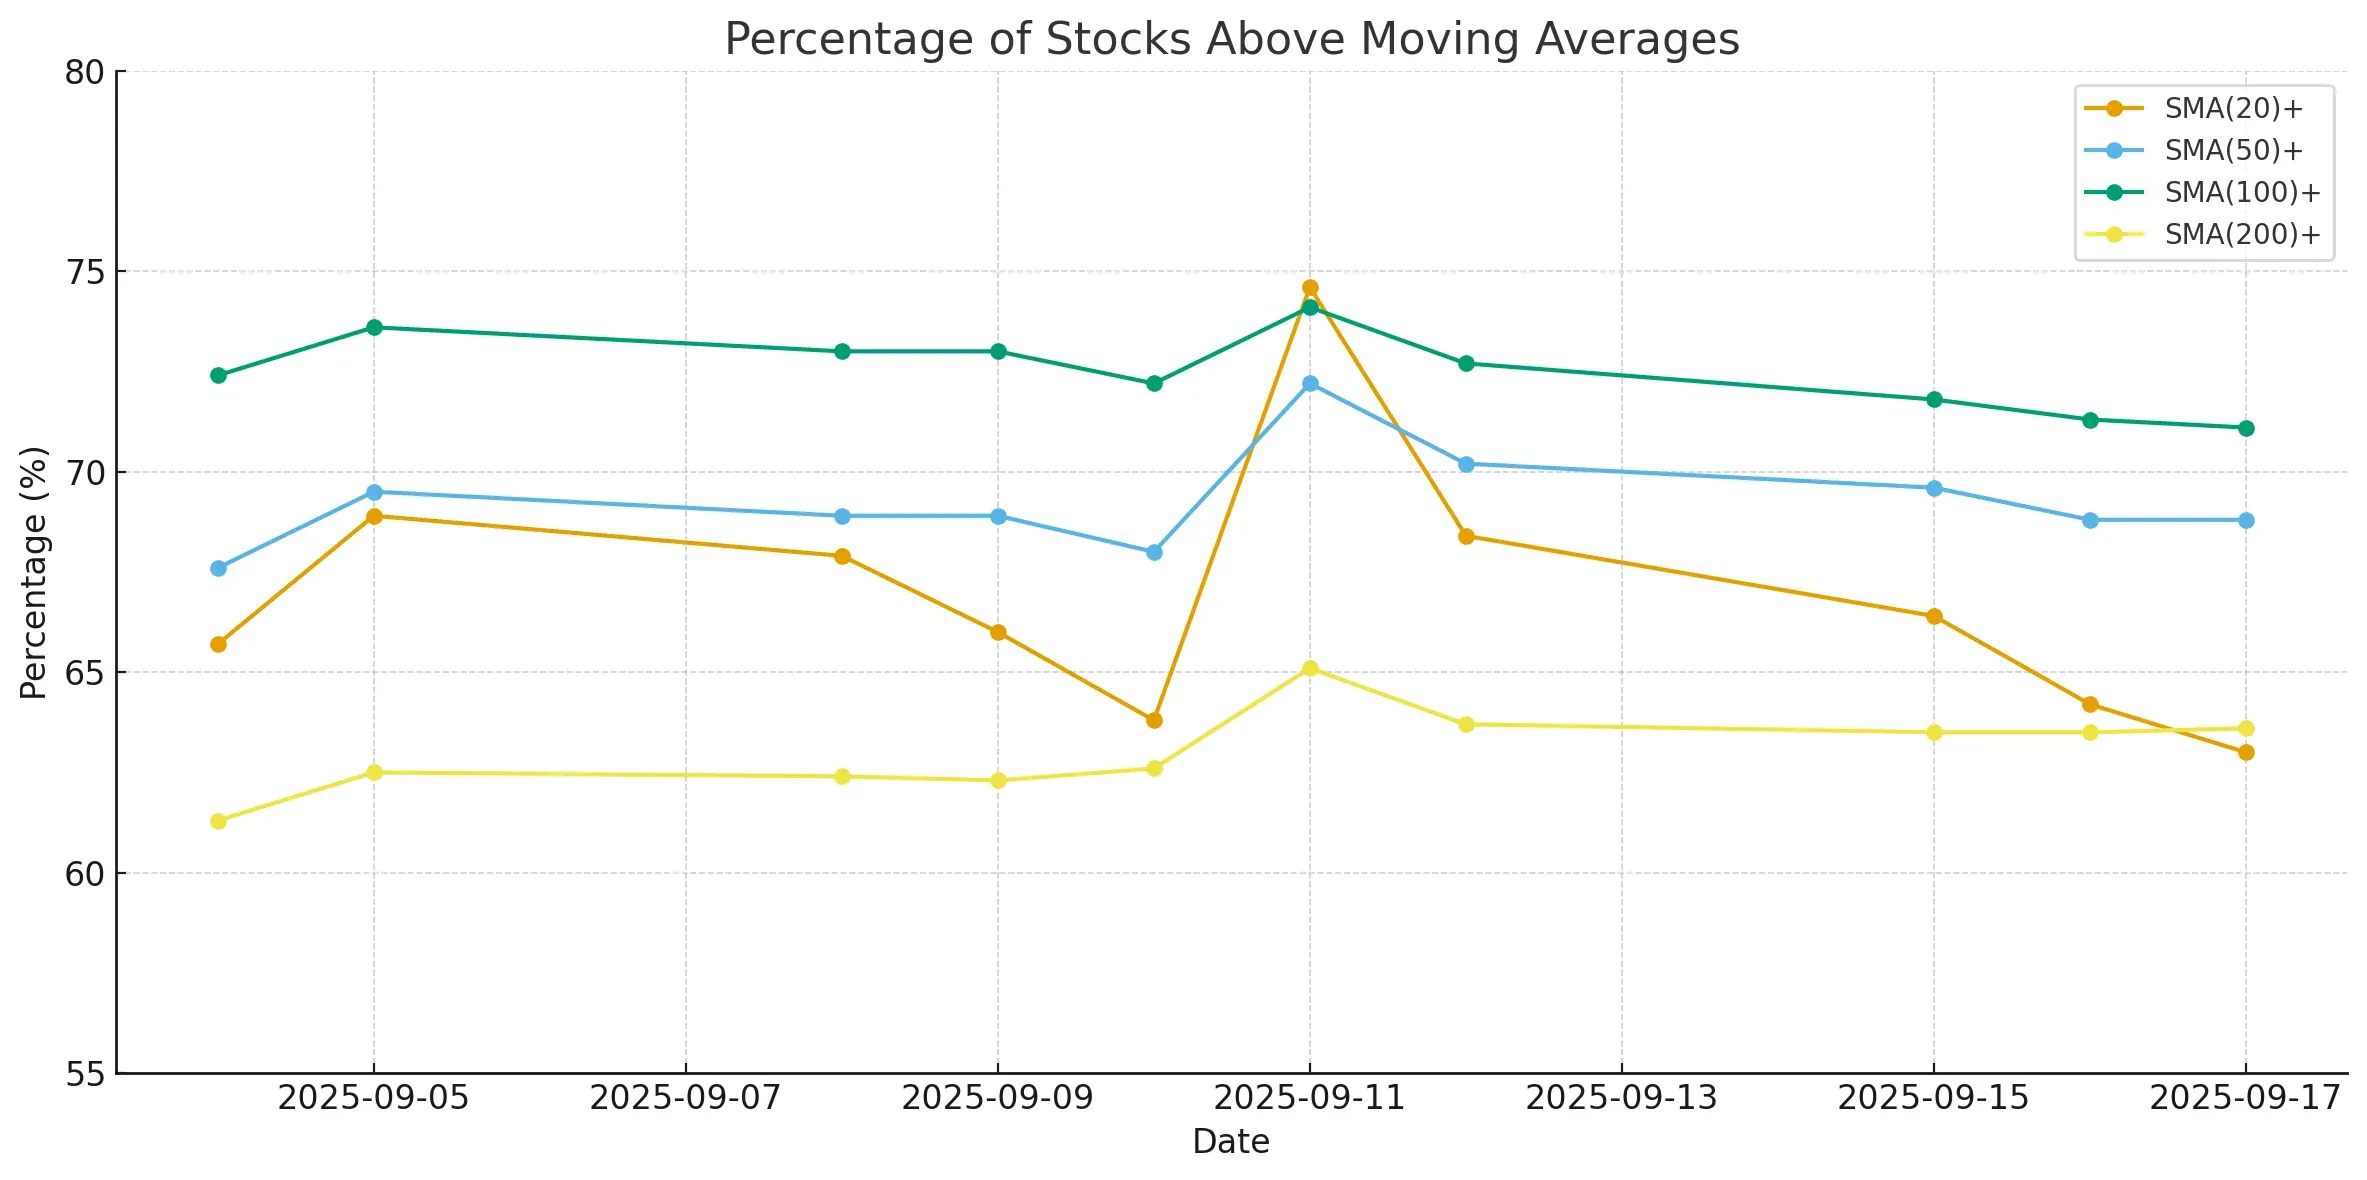
The 200-day SMA stayed resilient at 63.6%, almost unchanged in recent days, indicating that longer-term structures are intact despite near-term softness.
New highs and lows provided little new information, with 10% of stocks hitting fresh 20-day highs versus 1% making new lows, broadly in line with Tuesday’s readings.
On a broader timeframe, the weekly and monthly advance/decline ratios also remained stable, suggesting that sellers have not gained much traction despite two sessions of modest declines.
Compared to Monday’s stronger breadth reading (56.4% advancers), the market has cooled, but without the decisiveness of last week’s sharp swings (e.g., September 11 with nearly 80% advancing). The current tone suggests hesitation rather than deterioration.
Breadth Trend Rating: 4 – Neutral While participation has slipped from Monday’s more positive breadth, the overall structure remains balanced.
Sellers have not managed to dominate, and the longer-term averages still show stability. For now, the market breadth picture remains neutral, awaiting a clearer directional catalyst.

Kristoff - ChartMill
Next to read: Wall Street Whipsawed as Fed Kicks Off Rate Cuts