LEARN HOW TO SWING TRADE | A complete step by step guide for swing traders
Introduction
This comprehensive guide is an extension of our basic "what is swing trading" article and contains a lot of valuable information and insights for beginning swing traders, specifically designed to:
- teach you the basic principles and conditions which are typical of this type of trading,
- quickly get you started with this trading strategy,
- recognize expensive beginner's mistakes early on and know how to avoid them!
A lot of swing trading strategy basics are covered in this article. Of course, it is impossible to provide a detailed explanation of all subjects in just one article. That's why you'll find a lot of links leading you to other pages on our website where you can read much more about these specific subjects.
However, I recommend that you first read the article in its entirety. Afterward, you can use the links to consult the subjects for which you still want to know more.
Table of contents
- Why swing trading?
- Is swing trading (still) profitable?
- The basics
- Main benefits and drawbacks of swing trading
- Best swing trading ideas
- What is considered a good stocks to swing trade?
- Swing trade stock screener
- Do you have the right attitude?
- Money- and risk-management, the holy grail in trading
- A swing trade example from start to finish
- Knowledge is power: why you should keep a trading journal…
- Key takeaways
- A last word before you jump into swing trading
Why swing trading?
Swing trading has gained considerable popularity in recent years. This is mainly due to the fact that ‘the swing trading approach’ is the perfect middle ground between the volatile and fast day trading method and the rather calm buy-and-hold approach.
Moreover, the swing trading method is possible both in rising and falling markets which ensures that you can continue trading regardless of market conditions.
The extensive online trading possibilities have ensured that active trading today has become much more accessible, efficient, and affordable than in the past. And in a rapidly changing society such as the one we live in today, being able to quickly respond to new opportunities is a great advantage.
Is swing trading (still) profitable?
The short answer is definitely yes, especially in the current volatile market environment as we already touched on in the paragraph above. After years of benefiting from a bull market, we are currently facing very challenging market conditions. A strategy that can quickly switch between equities and cash is definitely a plus in that case.
However, the long answer is quite a bit more nuanced. After all, to become and remain profitable as an investor or trader, you need a lot more than just a strategy. The way you handle your capital and the risk associated with investing in general play a very large and decisive role.
Let me put it another way. You may use the best-proven swing trading strategies but if you make a mess of your risk management you will lose this game anyway. Period.
By the way, the importance of good risk management is discussed in detail later in this article.
The basics
Let's start with a few typical characteristics that are inherent to swing trading.
The timeframe used
The concept of swing trading refers to a strategy in which a position is held for several days to weeks. The intention is to maximize the benefit of a specific movement or "swing" in that time period.
Contrary to a day-trader, a swing trader will carry positions over to the next day. So you have to take well into account the overnight risk that goes with it! We'll elaborate on that later on in this article.
Some swing traders only use EOD (end-of-day) quotes based on the daily chart and only scan for potential trade setups after the trading day has closed. This gives them the advantage of being able to view and analyze the charts without any stress. Specific buy or sell orders are then prepared for the upcoming trading day.
Other swing traders try to refine their entry by also taking into account the intraday chart, usually based on the 1h or 4h chart. This is purely a personal preference. A disadvantage that you should definitely take into account is that this forces you to keep an eye on the intraday chart. For those who have a full-time job besides trading, this may not always be possible.
Because of the timeframe used and the active trading style involved, swing trading is considered a rather speculative trading strategy. As opposed to the position trader for instance.
Moreover, the direction in which the stock is heading is not important, when swing trading, one can speculate on either an upward or a downward trend (long or short positions).
Technical versus fundamental analysis
Most swing trading strategies are mainly based on the use of technical analysis in which support and resistance levels and specific trading patterns play a major role.
Technical indicators are also part of this, although there are traders who base their strategy purely on price action, without the use of any indicators.
The same applies to the use of fundamental analysis. Some traders will first make a selection on the basis of specific fundamental parameters in order to find undervalued stocks for instance. Only after this first fundamental selection, the technical aspect will be examined next.
A discretionary or systematic approach
This strategy allows trading based on an automated rules-based system or on a discretionary approach.
With a system-based approach, the execution will be fully automated based on a number of fixed rules which will take care of entry, stop-loss, and further trade management. No human intervention is foreseen.
If, on the other hand, we are talking about a purely discretionary approach, then it is the swing trader himself who, based on his own rules, will take care of the manual execution and further follow-up of the entire trade.
A combination of both methods is also an option. In that case, the swing trader will closely monitor an automated system and intervene based on his own experience and insights, which depend largely on the market conditions. For example, specific events which may have a significant and long-lasting impact on the financial markets may cause the trader to intervene in the automated system.
In this article, we will mainly focus on the discretionary approach because it is the basis from which one starts anyway, even when creating a fully automated system.
Main benefits and drawbacks of swing trading
Positive
- Swing trading requires less time than trading on intraday timeframes (day trading and scalping). In general, setups are reviewed after the market closes and then orders are prepared for the upcoming trading day. This way of trading is much calmer than scalping or day trading but still remains much more active than what a typical position trader does.
- Furthermore, the swing trader can combine his activities with a full-time job.
- Invested capital is released much faster than with strategies where positions are held as long as possible. It is therefore possible to respond more quickly to new opportunities.
- The basis of swing trading is technical analysis, which is a lot easier to learn than strategies that make use of fundamental analysis.
Negative
- Unlike day trading, swing trading does involve overnight risk. This means that an open position that was still in profit yesterday can suddenly show a large loss today. This can happen if, for example, the company has announced bad news after trading hours. So when swing trading, keep an eye on when the company publishes important news such as quarterly figures.
- A swing trader may be forced to close the entire position on the day before important news is announced because the stop loss does not provide full protection if the stock opens with a significant gap.
- Daily monitoring remains necessary, even though it is much less than with intraday trading.
- Transaction costs are higher because there is a lot more active trading than in strategies where positions are held in port for as long as possible. This can be quite a disadvantage if the swing trader has a relatively small trading capital compared to the minimum fees and taxes each time a trade is opened and closed. So always keep a close eye on costs and see what percentage they make up of the total profit/loss result.
Best swing trading ideas
Within the concept of swing trading, there are several setup methods in order to catch the swing. In this section, we will take a closer look at the different types of possible swing trading setups.
Breakouts
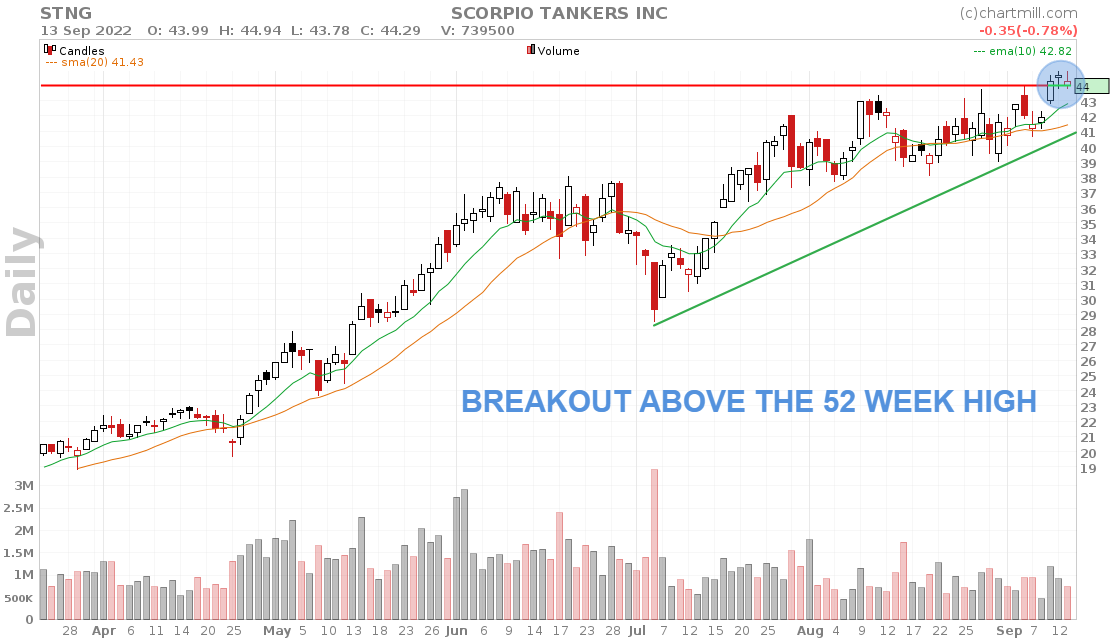
As the name implies, these are setups where the stock is breaking out above or below a specific level that previously acted as a support or resistance zone.
This type of setup is not tied to a specific timeframe and occurs both on long-term weekly charts or on a 5m intraday chart. This means that these setups can also serve as entry signals for a swing trading strategy on the daily chart.
The advantage of breakouts is that they are fairly easy to recognize. This in turn ensures that a lot of traders actually take them into account which explains to a large extent the effectiveness of a successful breakout, especially if it is visible on several time frames simultaneously. The more traders spot the breakout and try to act on it, the smaller the risk of a failed breakout becomes.
In this separate article on breakouts, we will discuss these setups in detail and address the most common mistake when trading breakout setups.
Pullbacks or retracements
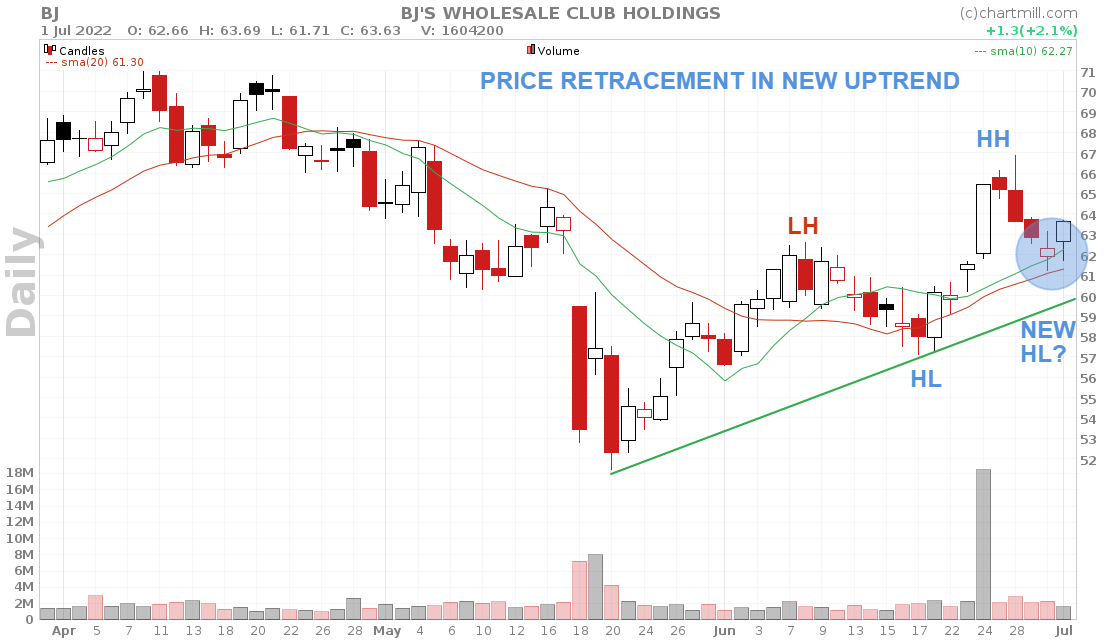
A pullback, or retracement is a price movement that occurs after a period of clearly rising prices in an uptrend (or declining ones in an existing downtrend). In response to the initial rise, a correction takes place. A pullback is best described as a pause in an existing long-term trend.
A pullback after a previously rising trend will cause prices to correct downward, while prices will rebound after a declining long-term trend. You will frequently recognize these typical waves, both in rising and falling long-term trends.
Such pullbacks are popular with swing traders because the correction can be used to open positions in the direction of the main trend.
The difficulty with pullbacks is to recognize early on when something more than a mild correction is going on and a real trend reversal is imminent. In an attempt to accurately evaluate the correction within an existing trend, technical investors use support and resistance levels, moving averages, Fibonacci levels, and, of course, technical indicators.
For more information, see this separate article which takes a closer look at the pullback concept.
Mean reversion setups
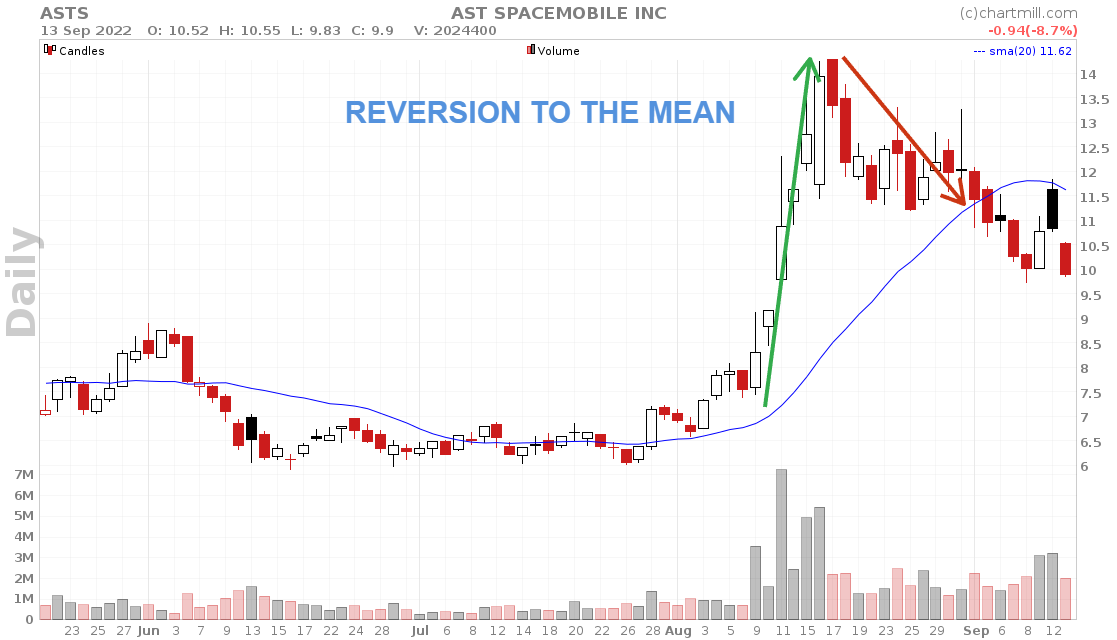
The mean reversion theory assumes that the price of an asset, after an extreme movement, will always return to its long-term average position.
The reason for this is quite logical. An extreme up or down movement in one direction is simply not sustainable for a long time. Although the theory is easy to understand, the difficulty lies in correctly defining what an extreme price movement actually is and how you can recognize it on the chart.
There are several ways to define that degree of extremity. From a technical point of view, this can be purely on the basis of the movement itself, the degree of volatility, or a specific technical indicator that indicates oversold and overbought levels.
Keep in mind that this is a pure countertrend strategy, as the trader wants to take a position opposite to the current trend assuming that the stock has deviated too far from the average price.
It is a fairly aggressive strategy where risk and trade management are extremely important. Going against a strong existing trend is far from obvious and requires a lot of experience. This strategy is perhaps not the best option if you are just starting out or if you are still experimenting with swing trades.
Some additional information on the mean reversion setup can be found in this basic article.
Bear in mind...
When choosing a swing trading strategy, keep in mind that it should fit your personal trading style as well as possible. If you are less confident about opening a long position when a stock breaks out above an existing high, don't make it hard on yourself. In that case, it makes little sense to trade breakout setups and you are better off opting for a pullback setup.
To the question "Which setup gives the best results?" the answer is simple. It doesn't matter. Any of these swing trading setups can give the best results, it depends entirely on the way you manage a position once it has been opened.
Even if only four out of 10 swing trades are profitable, you can realize a nice return as long as your profitable positions are 2 times larger than your losing ones.
And you can still lose money even if 7 out of 10 trades were closed with a profit if the average loss for the other three swing trades was 2.5 times the average profit.
The fact that there are several options doesn't mean that you should use them all. Especially when you only have little experience it's recommended to concentrate on one single method and to apply this consistently until you really have mastered the technique. At a later stage, you can always add other setups if you want.
What is considered a good stock to swing trade?
When selecting stocks for your swing trade strategy, it is best to first apply a number of basic criteria that will exclude a lot of stocks. These will especially target the very low-priced and less liquid stocks.
After this first basic filtering, you can concentrate on the stocks that best meet the conditions of your specific swing trade strategy.
Minimum price
Every investor likes to buy when stocks are cheap in order to hopefully sell them at a much higher price, right? (For the sake of convenience, I'll leave the concept of short positions out of the equation here).
Nevertheless, it is advisable to use a minimum price of $5 to avoid the typical penny stocks. Why? Because precisely those low-priced stocks are a lot more sensitive to extreme volatility and possible price manipulation (pump and dump fraud). Applying this filter is a simple way to avoid a lot of risk.
Yes… there are examples of penny stocks that rise many hundreds or even thousands of percent but you must realize that these are very rare exceptions. Buying penny stocks in the hope of one big hit is not a sustainable strategy. It is more like an ordinary lottery where the chances of losing are much greater than the chances of an exceptionally huge winner.
In the first place, you have to ask yourself why a stock is trading below $5 anyway? There is usually a good reason. Just remember that a low-priced stock is not the same as an undervalued stock (a mistake many beginners and even experienced investors still make...).
Thus, a stock quoted at $2 can still be "expensive" if the company is on the verge of bankruptcy. Just as "expensive shares" can apparently be "a real bargain" if the company behind it is a world player with a very strong market position and a rock-solid balance sheet.
Minimum volume, average volume, and relative volume
The importance of volume cannot be overemphasized. The higher the volume the higher the liquidity and the easier it is to buy and sell the stock. Moreover, the spread between the buying and selling price will narrow as the volume increases.
The behavior of the volume in a strong trend movement, a pullback or a break-out is of great importance to active investors because it says something about the strength or weakness of that specific movement.
In this article, we take a closer look at why volume is so important. A video is also available.
Market cap
When the price of a stock is multiplied by the number of shares outstanding you get the market capitalization which is a measure of the size of a company. Depending on the total amount, a company is classified into one of the following categories:
- Micro-cap: $50 million - $300 million
- Small-cap: $300 million-$2 billion
- Mid-cap: $2 billion-$10 billion
- Large-cap: $10 billion-$200 billion
- Mega-cap: $200billion or more
As a minimum, it is best to use small or mid-caps. The general rule is that the larger the market capitalization, the smaller the risk for investors.
This is not to say that large caps cannot suddenly fall significantly in value or go bankrupt. However, the probability is much smaller in percentage terms than with micro caps in which we find the typical low-priced stocks.
A more detailed explanation of market capitalization can be found here.
So far, we have only touched on some general characteristics. Obviously, you can also make a rudimentary basic selection from a more fundamental viewpoint. For example, you could first set some fundamental filters to focus purely on financially sound companies. Which filter settings you can use to achieve this can be read in the article "How to measure a company's Financial Health?".
Sector/industry
Equity markets include several sectors, and depending on market conditions, certain sectors will outperform others. Within those sectors, as a swing trader, you can then look for individual stocks that exhibit the best setups and offer the most potential.
It would take us too far to go into it in more detail at this point but be sure to watch this video where I explain how to analyze sectors through our sectors page.
A quick visual overview of the long-term trend for individual sectors is also possible via this link which shows the weekly charts of the various US sector ETFs.
Relative Strength
The relative strength of a stock shows the extent to which the stock compares to an index or another stock over a period of time.
Stocks with high relative strength will rise harder in rising markets than those with significantly lower RS. However, in a negative market environment, it is also the stocks with high RS that will fall the least.
As an investor, it is therefore interesting to keep an eye mainly on stocks with a high RS. After all, during a general market correction, these will be the stocks that - when the main positive trend returns - will be the first to recover.
In ChartMill there are several ways to filter stocks by relative strength, in the articles below you can read more about the different ways relative strength is displayed and used.
Swing trade stock screener
A good stock screener for swing trading which provides a first basic selection is indispensable when looking for specific swing trading setups. It ensures that you don't waste hours of time manually searching through thousands of charts. It allows you to work much faster and more efficiently and focus purely on the setups that really matter.
ChartMill is a very versatile screener and multiple predefined filters are available for every possible swing trading setup. You can use these off-the-shelf but the beauty is that you can just as easily customize them to your specific needs.
Here are a few technical ideas to get you started.
Breakout swings trading ideas:
- Momentum breakout setups above the 52-week high with increased volume
- Bull Flag setups
- Strong stock near new high
- Stocks nearing a resistance line
- Momentum squeeze play setups
Retracement swings trading ideas:
- Retracement setups - price near SMA50
- Retracement setups - price near SMA20
- Bullish hammer patterns during minor retracements
- Minor retracements using force index indicator
Mean reversion swings trading ideas:
Do you have the right attitude?
Getting started with swing trading obviously requires a specific strategy that you will then have to apply consistently. But it doesn't stop here... On the contrary, it is rather the starting point on your road to success.
Active swing trading requires discipline and a lot of patience, even in periods when things are not going so well (with the assumption that your system still provides an edge in the market in which you trade).
Your biggest enemy is the mental aspect. Not a single investor has a hard time if the strategy he or she uses turns out to be successful. But that changes very quickly when multiple loss positions follow one another. Doubts grow and emotions gain the upper hand, suddenly questioning the strategy used and finally breaking the basic rules... with all the consequences that entails.
However, it is precisely during these challenging periods that you must try to be consistent in your approach. Again, loss positions are inextricably linked to any strategy. So you better learn to deal with them!
The only way to overcome such periods is to rely on your money and risk management rules, which are discussed below.
Money- and risk-management, the holy grail in trading
What is discussed in this paragraph applies not only to swing trading but to all forms of investing, no matter what strategy or specific setups you use.
The most important thing is your working capital. This deserves the highest protection because without it, it is simply impossible to invest. How you protect it depends on your trading method.
Swing trading means that you will buy and sell shares on a regular basis. In doing so, a number of things determine your risk:
- How big is your position relative to your total capital?
- What % loss are you willing to accept if you are stopped out at your initial stoploss?
- How many open positions can you have at most?
Position sizing
The size of your exposure to a specific stock in your portfolio plays a primary role when it comes to delineating risk. Investing too much in one specific stock increases your chances of a significant loss quite a bit, even if you use a stoploss.
An example:
Suppose you have a trading capital of $50,000. Based on your strategy, you decide to buy stock 'X'. The stock is currently trading at $252 (this is your purchase price). You set the stoploss at $249. You wish to limit your risk to 1% of your total account, which represents a maximum loss of $500 (1% of $50,000).
Since the difference between your purchase price and your stoploss price is $3, you can buy a maximum of 166 shares (500/$3).
So the investment for this will be the number of shares you buy (166) * the price at which you buy the shares ($252) = $41,832.
Therefore, this position will take more than 80% of your total capital!
What if the company suddenly announces very bad news aftermarket? Chances are this wil have a serious impact on the stock price and the stock will open much lower the next trading day. Even lower than your foreseen stoploss.... Consequently, your loss will be greater than what you anticipated. In case the stock opens 40% lower the following day, you will suddenly have a huge loss on your position, despite the short stoploss.
Fortunately, you can easily avoid this by making sure that a stock position can only occupy a certain % of your portfolio, max. 10 to 20% for example.
Risk%
The risk% serves to define your maximum loss per position by means of a stoploss. Thereby it is important to take into account the rules concerning position sizing since a stoploss does not offer a 100% guarantee if the price suddenly opens much lower (in case of a long position).
Defensive investors apply a risk% of 0.5 to maximum 1%, for those who trade more aggressively this can go up to 2%. These may seem small differences, but they are quite large if you assume a few consecutive loss positions.
Ask yourself up to what loss rate you can still sleep peacefully and then analyze your strategy to find out how many consecutive losing trades can occur in the worst case scenario.
10 consecutive losing trades with a risk% of 1% means a loss of -10%, with a risk% of 0.5% that would have been only -5%....
For a typical trend trader who tries to catch big swings and where the success rate is at most 30-40%, the probability of facing multiple consecutive loss positions will be higher than someone who uses a breakout strategy and averages 50-60% profitable trades.
Want to know more? Be sure to read our 6-part article series on money and risk management.
Did you know that ChartMill features a standard position sizing tool that helps you calculate exactly how much you can and should buy, taking into account your available capital and desired risk?
This article explains how the PST-tool works and where to find it.
A swing trade example from start to finish
Now that we've seen the different types of setups and understand the basic rules regarding risk management, it's time to show how it all works at the time you decide to buy. Below we will discuss a typical swing trade in an individual stock.
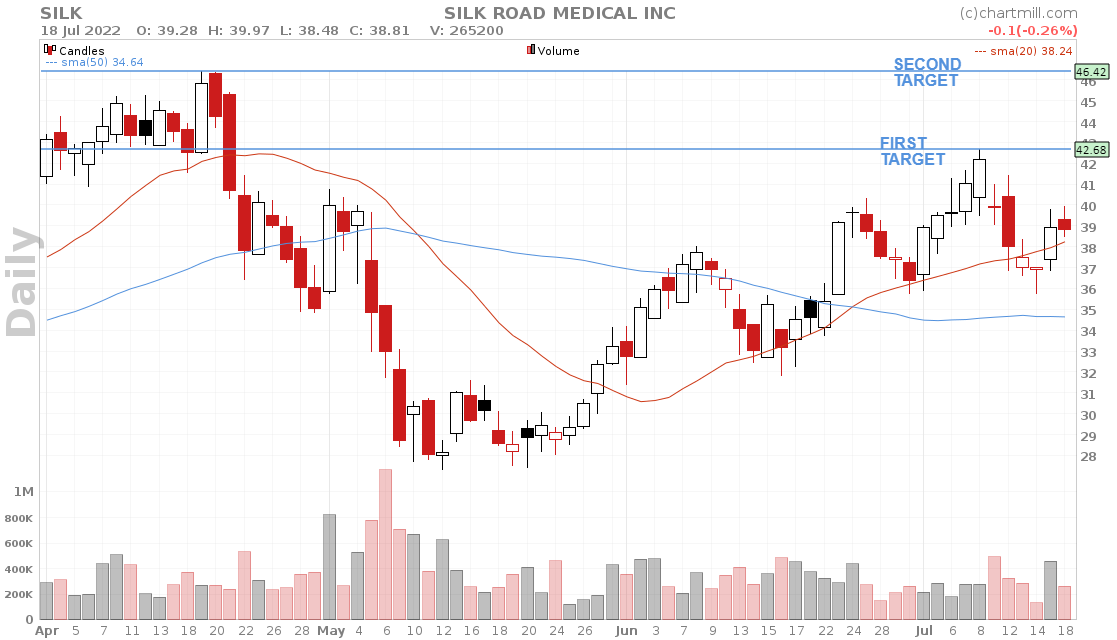
Silk Road Medical Inc. stock was one of the results from this pull back trading idea filter (bullish hammer pattern during minor price retracements on date of 2022-07-14).
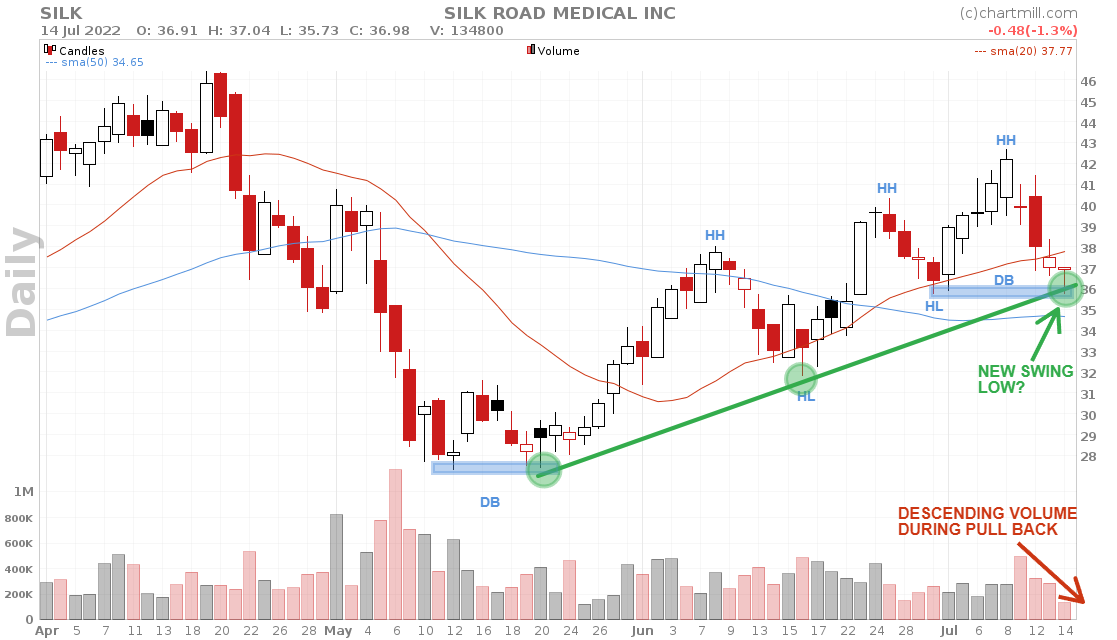
Before the trade
A few things that stood out at the time of screening:
- The trend is positive with multiple higher tops and bottoms
- The last week of June saw a bullish upward crossing of the sma20 with the sma50 confirming the current upward trend
- The price has fallen back slightly recently but selling volume declined rapidly in the process
- The bullish hammer is forming at the level of the most recent higher low where a potential double bottom now exists
We consider the bullish hammer pattern as a warning signal at best. The mere presence of this pattern is insufficient to consider a buy setup. However, taking into account the additional elements, the stock was added to a watchlist for further monitoring.
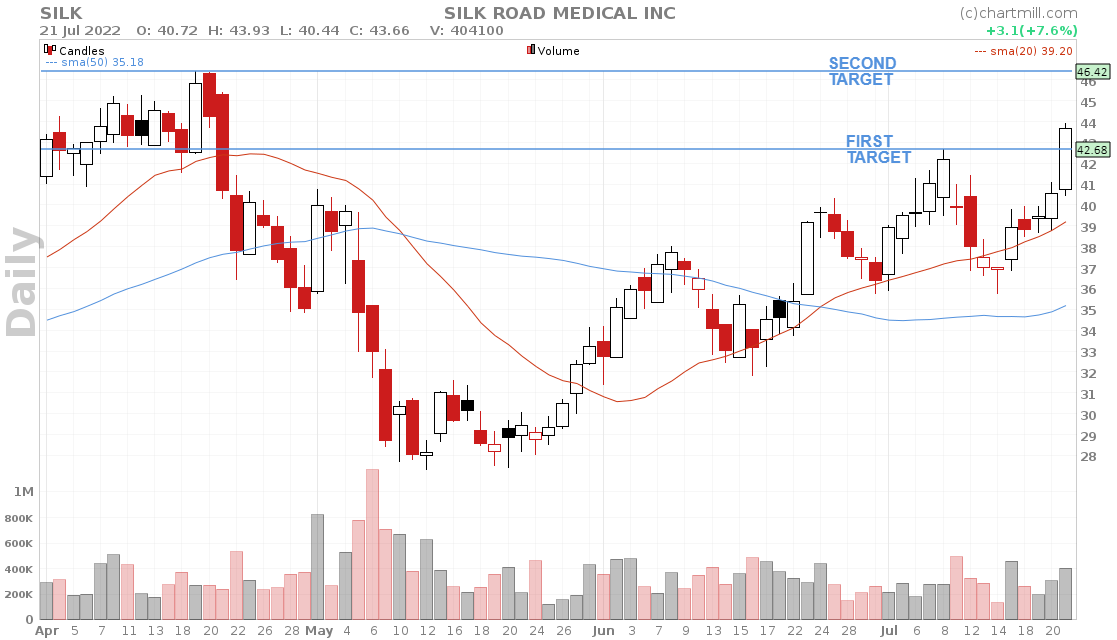
The following day, July 15, 2022 the chart looked like this:
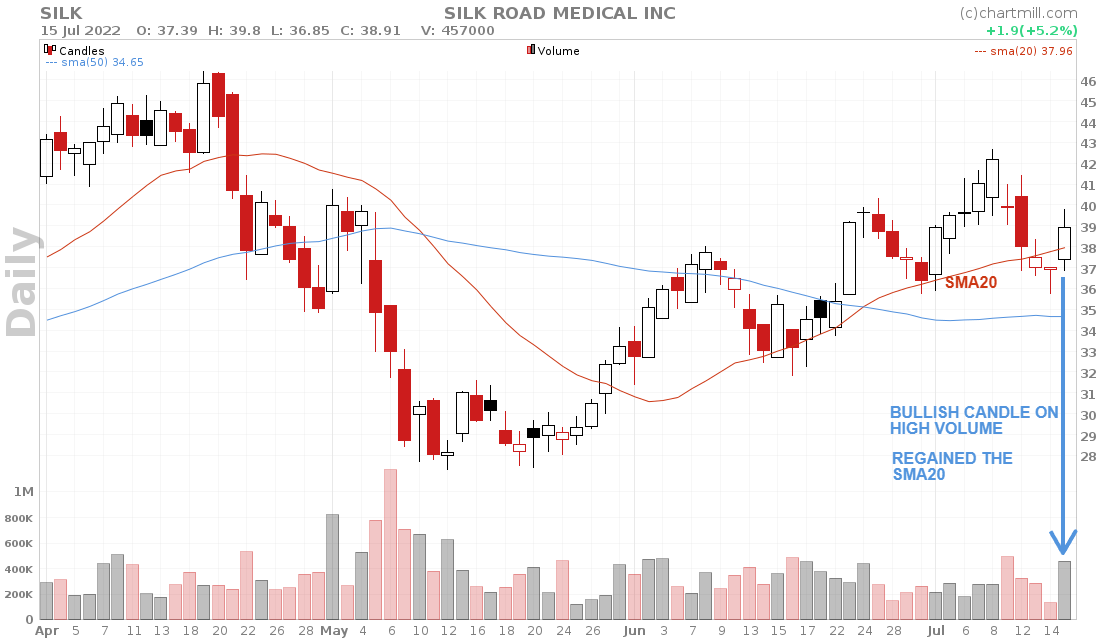
A bullish candle with sharply increased volume is visible whereby the price could once again close above the rising SMA20.
Together with the bullish hammer candle from the day before, this has now evolved into a real reversal pattern where it can be assumed that the existing trend will resume, at least to the previous high of the current upward trend.
Defining the levels
Stoploss
The first and most important level to determine is our stoploss. Ask yourself at what price level you assume the setup is no longer valid.
In this case, I define the bottom of the bullish hammer candle as the crucial price level ($35.69). As soon as the price falls below that level I believe the reversal pattern has failed and the position should be closed irrevocably.
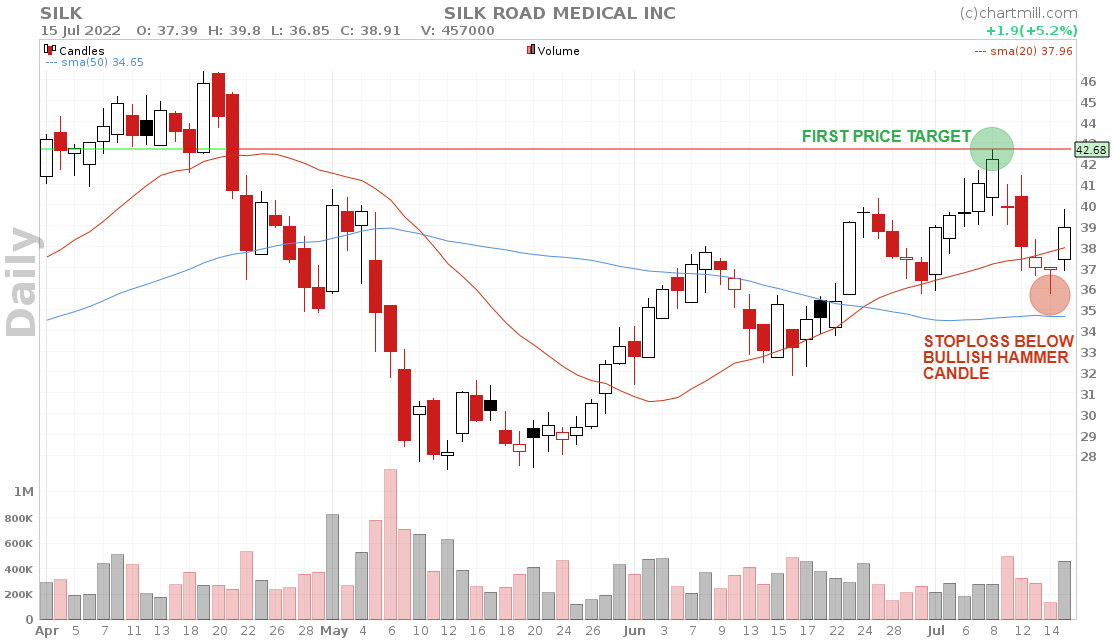
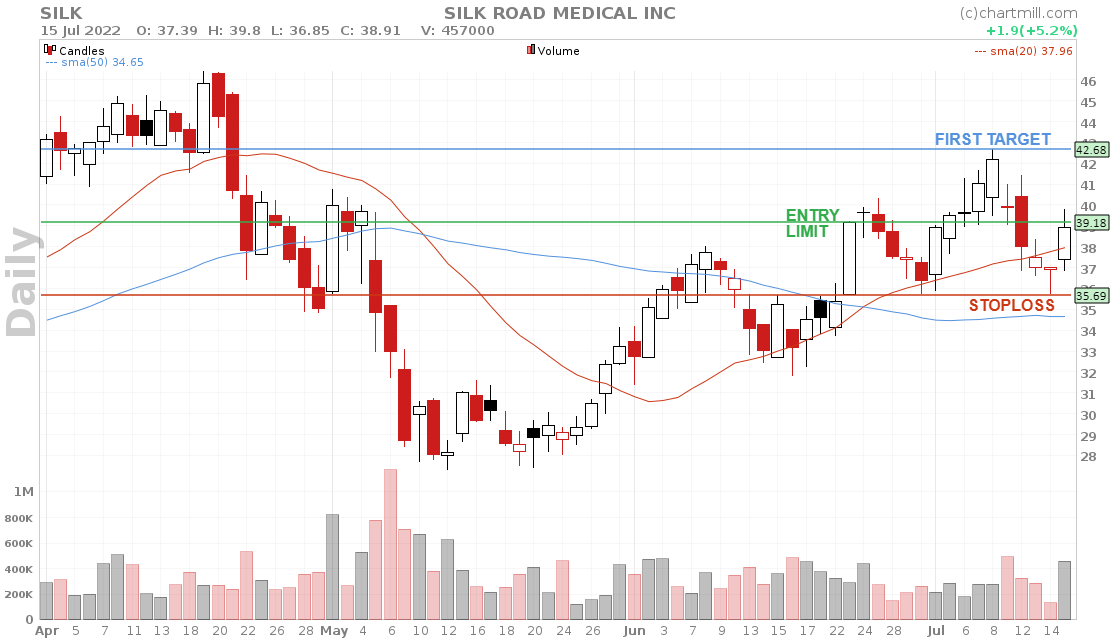
Price targets
In the chart above we use the most recent higher high ($42.68) as our first target
Entry price
Since we want at least a reward/risk ratio of 1/1 for the closest price target, a buy order is placed in the market with a limit of $39.18. This price level is equally distanced from the stoploss as it is from the price target.
How many shares to buy?
knowing what price we are willing to pay for the shares and at what price level our stoploss will be set, all that remains is to determine how many shares we will buy.
To do so we use the position sizing tool. In this example we assume an available trading capital of $25,000 and a risk percentage of 1%. This means that if we are stopped out at the set stoploss the loss will be at most $250 (1% of $25,000).
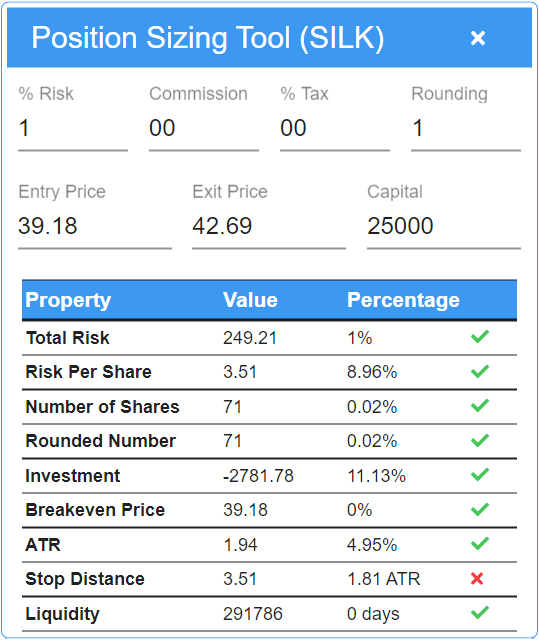
The tool indicates that with the set parameters, we can buy exactly 71 shares for a total investment of about $2780, representing 11.13% of the available capital.
We do notice a warning that has to do with the stop distance. This is because it is lower than twice the ATR-distance (Average True Range), which is the minimum value in the tool to avoid getting a warning. If desired, you can solve this by increasing the stopping distance.
Which buy order to use?
Now that we know at what price and how many shares we are going to buy, all we need to do is put the order in the market. For this, it is advisable to use a limit order where you specify a maximum price. After all, we do not know at what price level the market will open the day after.
When using a normal market order, the shares will be bought anyway, even if the price would unexpectedly open much higher... It is precisely to avoid this that limit orders exist. This kind or order allows a condition to be attached to the buy order. In this case, a maximum price of $39.18.
Subsequently, three scenarios are possible:
- The price opens higher than the limit price and continues to rise throughout the day. Therefore, our buy order will not be executed.
- The price opens higher than the limit price but descends at or below the limit price. The buy order will be executed as soon as the price drops to the limit price.
- The price opens below the limit price. Our buy order will be immediately executed at the current market price.
The buy order was triggered on Monday 2022/07/18. The price opened slightly higher but intraday it fell below the set price limit.
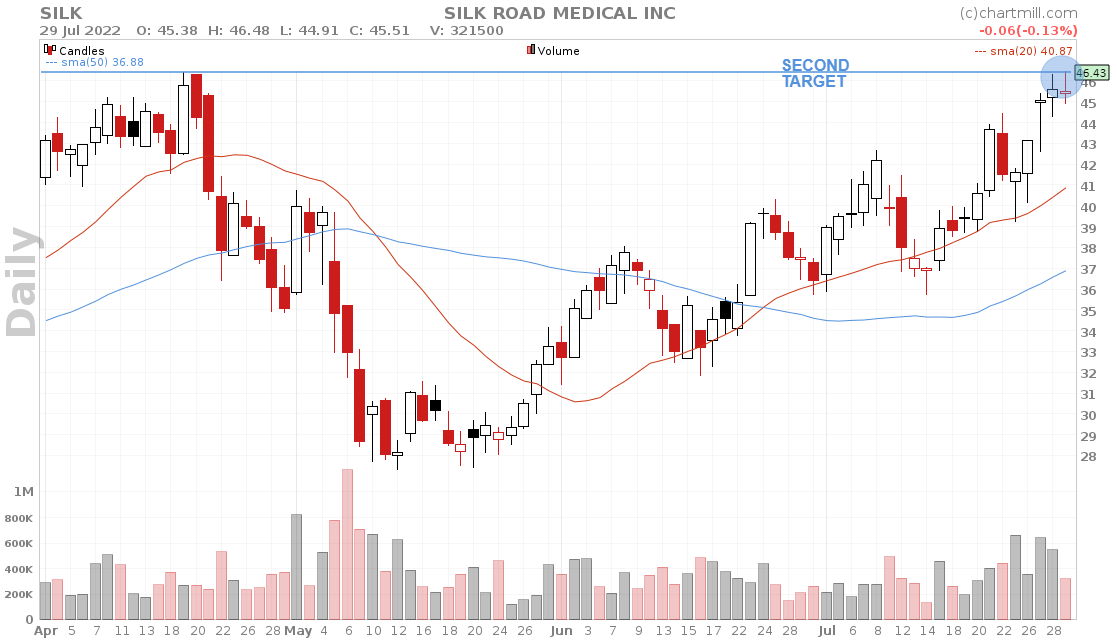
The first price target counts as the breakeven level. The second target was set at the high of 2022/04/20 ($46.42)
The first price target was reached on date of 2022-07-21. Consequently, the position's stoploss was raised to the entry price, our breakeven level. ($39.18).
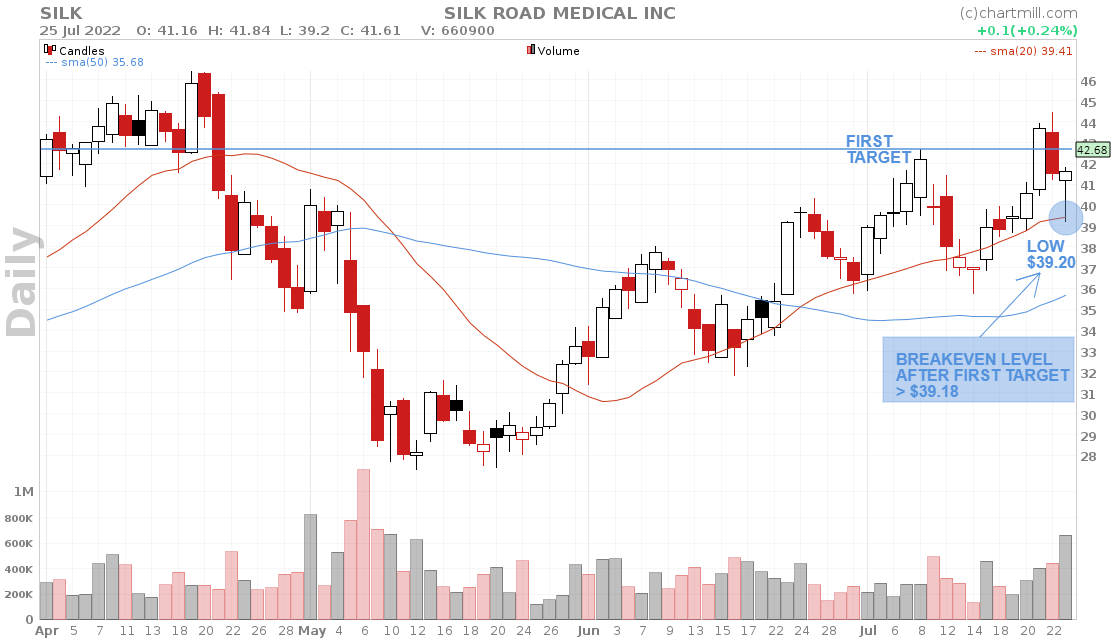
On date of 2022-07-25, things got a little tense.... when the position was barely stopped out. The price fell to $39.20 that day while the breakeven stoploss was at $39.18. Sometimes you gotta have a bit of luck on your side... ;-)
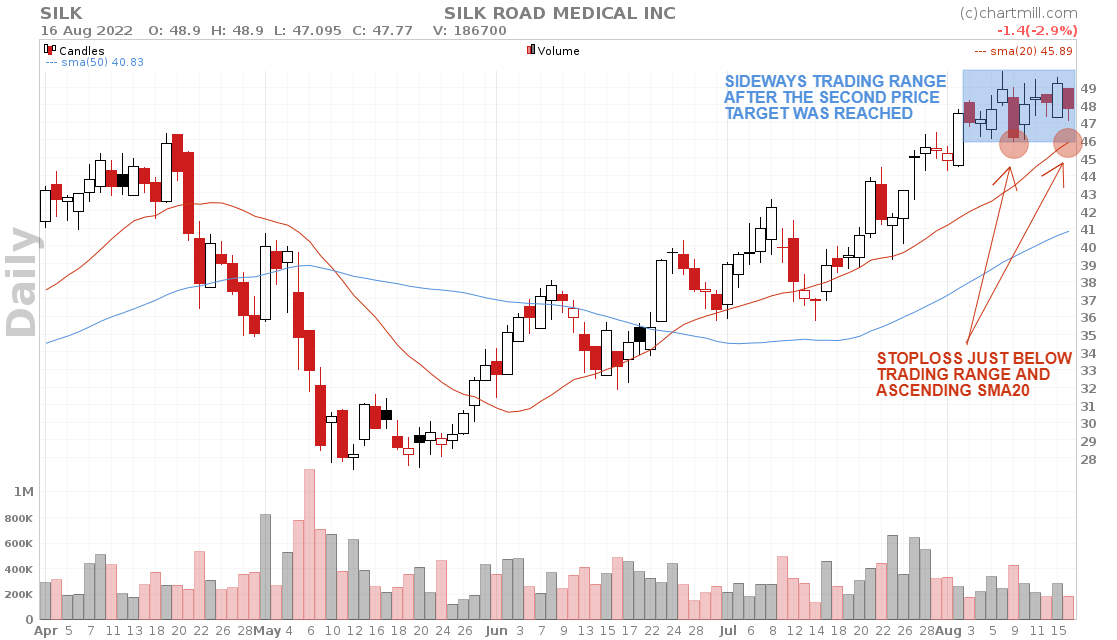
On July 29, the second price level was also reached ($46.42). At this level, several options were possible. You could sell the entire position (or part of it). Or you could have decided to keep the entire position open and raise the stoploss to secure at least part of the realized profit.
Which way you prefer depends largely on your personal trading style, there is no best or worst way. However, it is important that you are consistent in what you do and always put preservation of your capital first.
Tip: choose the method you are sure you can stick with. It makes no sense to hold a position completely if you know that you will always end up selling too early because you are afraid of losing your accumulated profits.
The chart below clearly showed that the price moved sideways after hitting the second price target.
For those who still had the stoploss at the breakeven level, the candle of August 17 really did signal to close the position and secure the remaining profit.
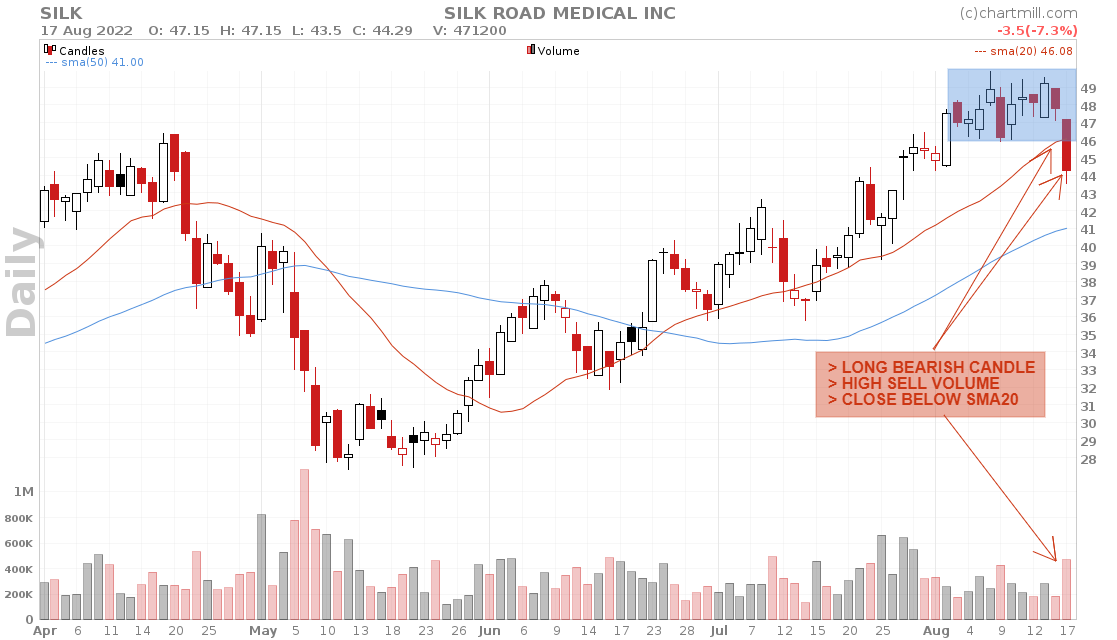
Indeed, the price closed below the SMA20. In addition, there was a downward breakout at the bottom of the sideways trading range. And finally, the selling volume had increased significantly in the process.
The image below shows the swing that the trader took advantage of and where a maximum gross return of 3 times the initial risk was ultimately possible.
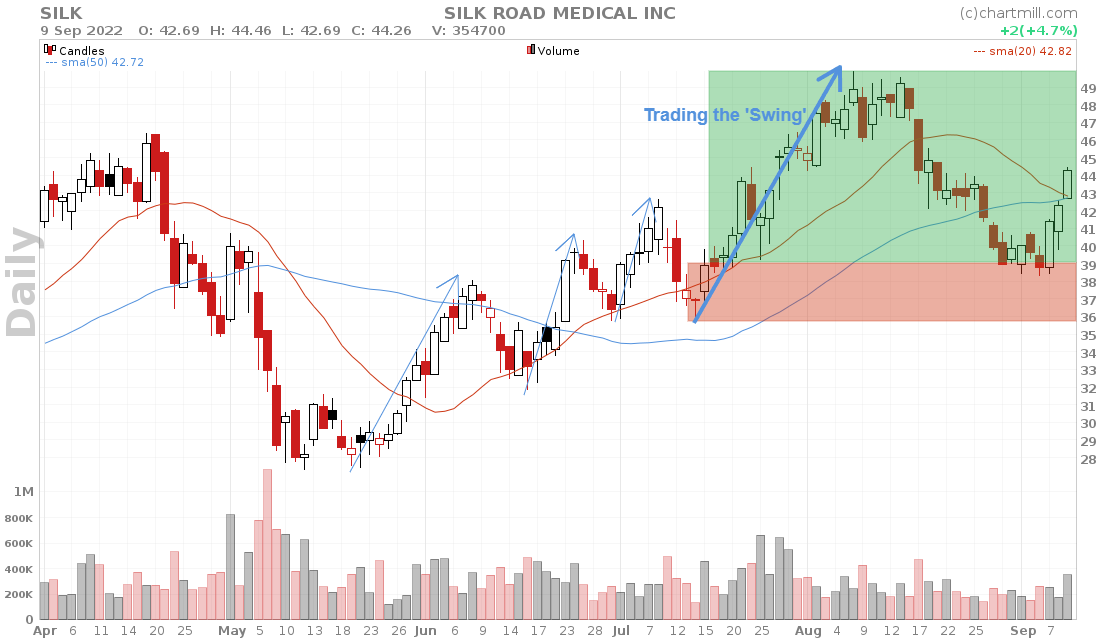
In reality, this position would rather have produced a reward:risk ratio of 2 to 2.5 because it will rarely happen that the position is sold exactly at the highest price.
Knowledge is power: why you should keep a trading journal…
Make sure you keep some kind of journal of all your executed trades. This is important because after a while you will be able to gain new insights on the basis of this document which will allow you to further refine and optimize your trading strategy.
The way you do this is not that important, you can keep it as detailed or basic as you like. Just make sure that you can retrieve at least the following:
- Date / buying price / stoploss / selling price
- The reason why you have retained this particular setup
- The result of the trade
- A brief analysis of the trade itself (what was good, what was less good? Did you follow your own rules well or did you deviate from them)?
This can be in written form but a screenshot of your chart with various annotations on it is also a possible alternative.
Another great advantage of such a logbook is that when things are not going so well you are able to look back to past periods when the same thing happened.
Especially when your logbook already covers a somewhat longer period, the chance that you were confronted with challenging market conditions in the past is a lot higher. Being able to look back at that period can allow you to put the current difficult period in a better perspective and it ensures that you might recognize things so you won't repeat the mistakes you made then.
The more information you track the more valuable your log becomes but that also requires a lot more time for those who are actively trading. Still, it is worth that investment. After all, a good diary will quickly show you where potential problems occur most often or where opportunities exist to improve your strategy.
For example, by keeping track of when you did and did not stick to your trading rules, you will be able to quickly and objectively measure the results of those trades. If the result is worse, you know that sticking to your rules is an important work point.
However, if you notice that by deviating from a specific basic rule the average profit for those trades is higher, then it might be interesting to investigate this further and adjust the rule with your newly gained insights.
Just make sure that you do this only on the basis of sufficient objective data and forward test a modified strategy always with minimum risk (or even on a paper trade account) next to your existing strategy in order to compare both strategies in real time.
Key takeaways
- Swing trading is an active trading style that involves buying stocks and holding them in your portfolio for days to weeks to take maximum advantage of the ‘swing momentum’.
- Technical analysis in most cases forms the basis of the strategy where positions are usually taken on the daily timeframe. Some investors also integrate fundamental elements into their stock selection.
- Positions can be opened based on breakout, pullback or mean reversion setups.
- Make sure the stocks you wish to swing trade are sufficiently liquid and avoid underpriced stocks.
- Stocks belonging to strong performing sectors and those with the strongest performance within their sector are ideal swing trading candidates.
- As with any other form of investment, money and risk management are vital to long-term success.
A last word before you jump into swing trading
Just to be crystal clear, swing trading is by no means a way to get rich quickly, even though the opposite is claimed countless times by so-called "stock market gurus" trying to convince you that the money will pour in with their exclusive "success formula" or “magic indicator”....
Successful investing requires discipline and consistency, whether you use technical analysis or fundamental analysis or a combination of both.
Losing positions and periods of sluggishness are an inherent part of this. It's no different with swing trading. But with a solid strategy, the right mindset and a focus on risk management, it's definitely possible to become and stay successful in the long run!
If you don't have any experience with ChartMill yet, I recommend that you take a look at the ChartMill Academy Video series, which will get you started quickly with this stock screener. Creating a ChartMill account is completely free. You only need a valid email address.