Average True Range (ATR) Volatility Indicator
In this article:
- The Volatility Indicator
- Calculating Average True Range
- What is True Range?
- From True Range to Average True Range
- How To Use the Average True Range Indicator?
- Average True Range Stop Loss
- Final thoughts
The Volatility Indicator
The Average True Range (ATR), developed by J. Welles Wilder, is a technical analysis indicator that measures the average volatility of the underlying asset. It was first introduced in the book "New concepts in technical trading systems" and was initially used for trading commodities. However, the indicator is just as useful for stocks or etfs. To do so, it calculates the average of the True Range over a predetermined period. Typically, the ATR is calculated over 14 periods. But those more interested in more recent volatility can reduce the number of periods taken into account. Conversely, those who want to measure volatility over a longer period will have to withhold a higher number.
As with other typical volatility indicators such as the Bollinger Bands and the Keltner Channels, the Average True Range Indicator will indicate when volatility is high or low, with the likelihood of a trend reversal increasing if the ATR rises sharply (high volatility). The lower the ATR value the calmer the price movements are.
Please note that the indicator does not reflect the price direction, a rising ATR is only an indication of increasing volatility, which will manifest itself in both rising and falling prices.

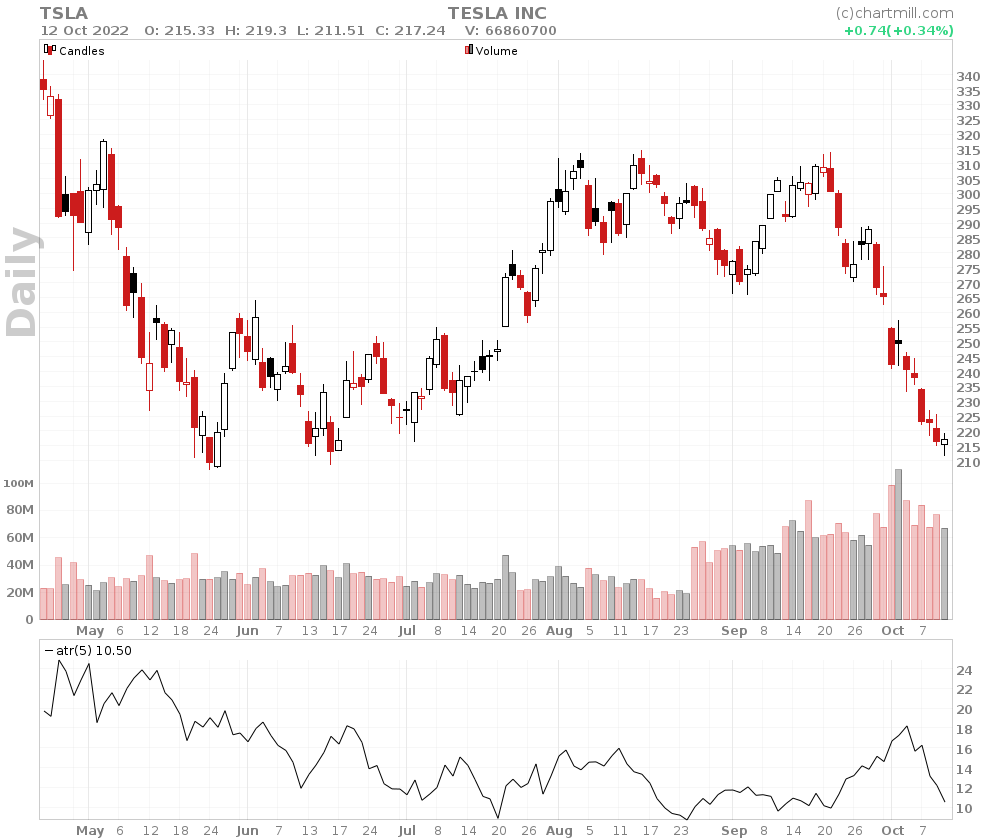
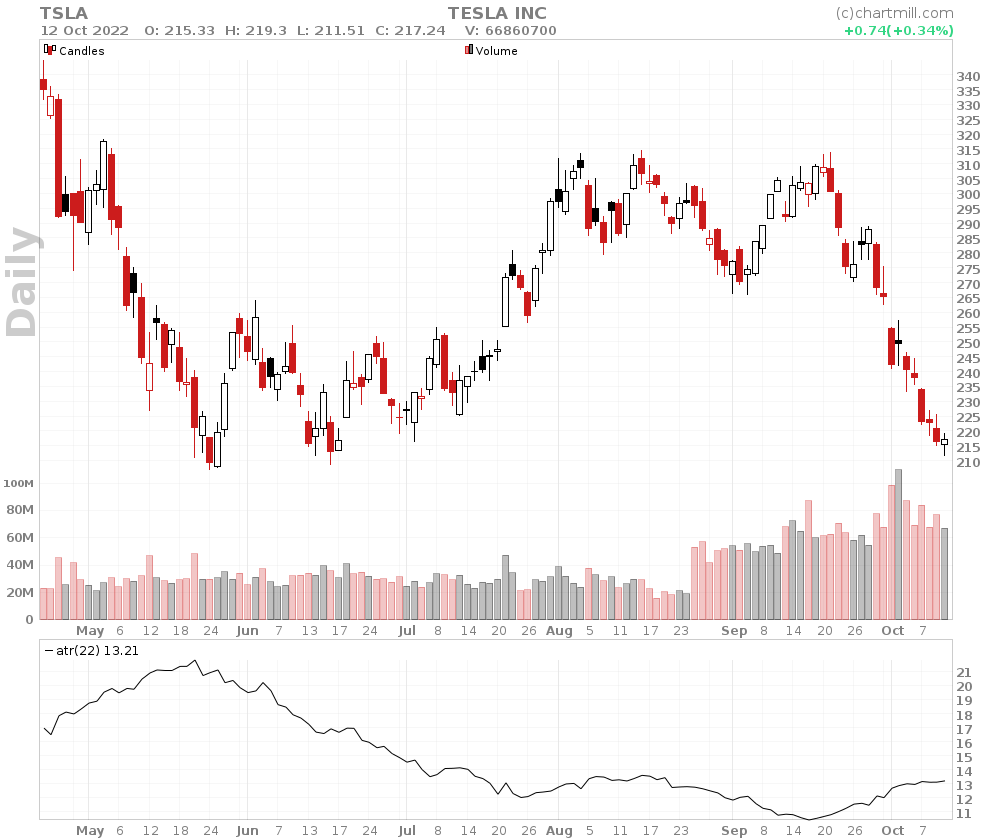
from left to right: ATR(14) - ATR(5) - ATR(22)
The main advantage of the ATR indicator is that it also takes into account the 'missing volatility' created by any gaps between the daily ranges. To be clear, this indicator does not serve to determine/confirm any direction of the price or to show specific buy or sell moments. This indicator is however very suitable to determine the stoploss, taking into account the applicable volatility.
Calculating Average True Range
Calculating average true range is done by the following formula:
ATR = (Previous ATR * (n - 1) + TR) / n
Where:
- ATR = Average True Range
- n = number of periods or bars
- TR = True Range
What is True Range?
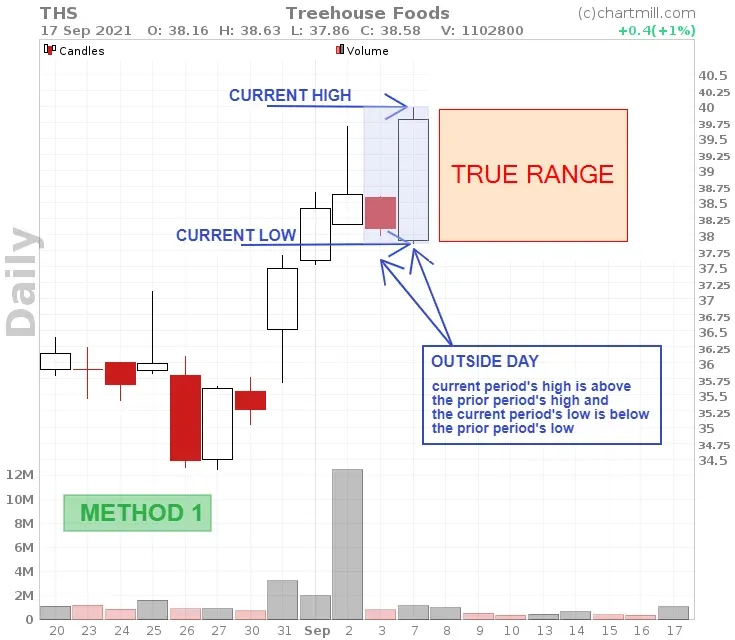
To properly understand the concept of ATR, we must first take a moment to consider the concept of True Range. This is defined as 'the greater of one of the following':
- Method 1: Today's highest price minus today's lowest price
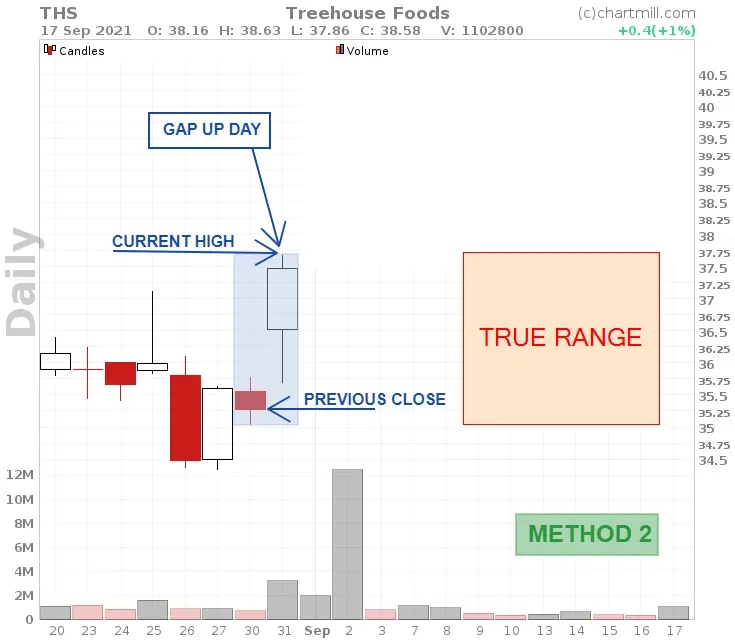
- Method 2: The absolute value of today's highest price minus yesterday's closing price
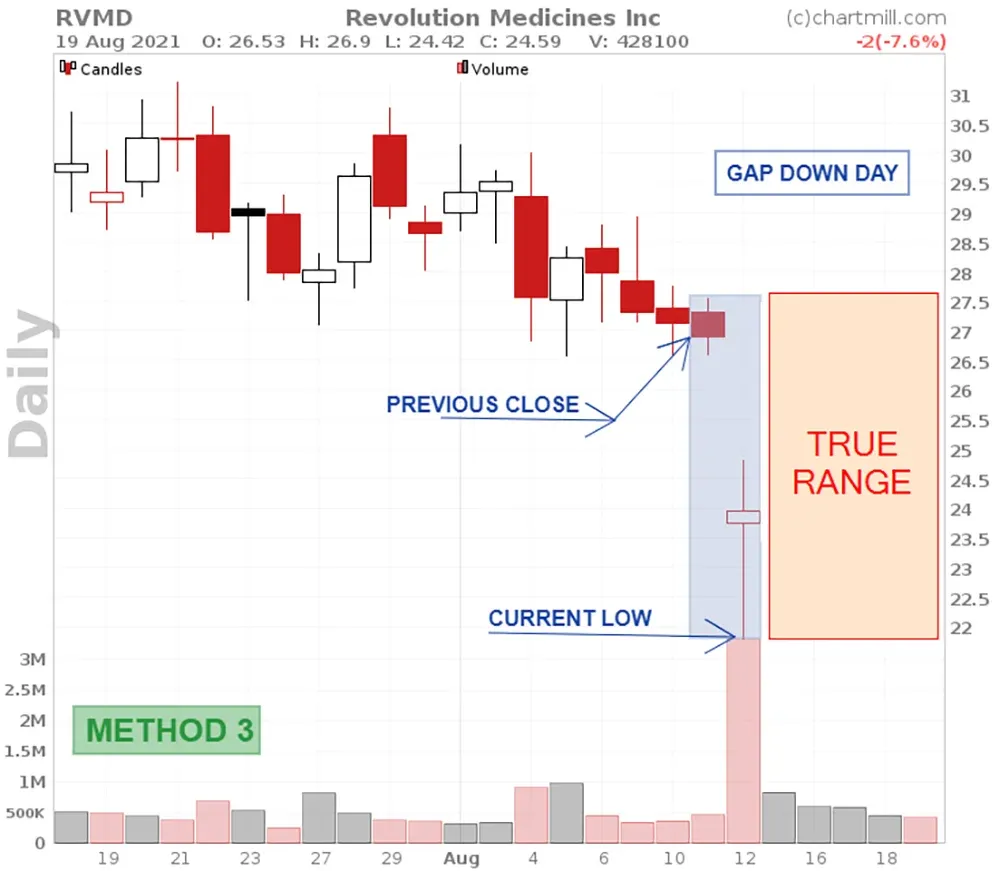
- Method 3: The absolute value of today's lowest price minus yesterday's closing price
Absolute values are used to ensure positive numbers. Thus, all three methods measure the distance between two price levels. The 'True Range' always withholds the method whose result gives the greatest distance.
Method I
Method II
Method III
By default, the ATR indicator is usually set to 14 or 22 periods, which can be days, weeks but also intraday time frames such as 1 hour or 5 minutes.
For the first period of the total range over which the ATR average is calculated, the highest and lowest price of that first period will always be retained. This is so because obviously there must be a beginning. Moreover, the very first 14-day ATR period will be based on the average of the daily True Range values of the last 14 days.
Only from day 15 onwards will the data be smoothed by including the ATR value of the previous period.
From True Range to Average True Range
We know by now that the ATR is calculated as an average of the TR values, which is why this indicator is also shown as a moving average. This gives a more accurate picture of the average volatility of the underlying asset to which the indicator is applied.
Because the calculation is done based on absolute values, you will notice that shares that are priced low will show lower ATR values than shares quoted in a higher price segment.
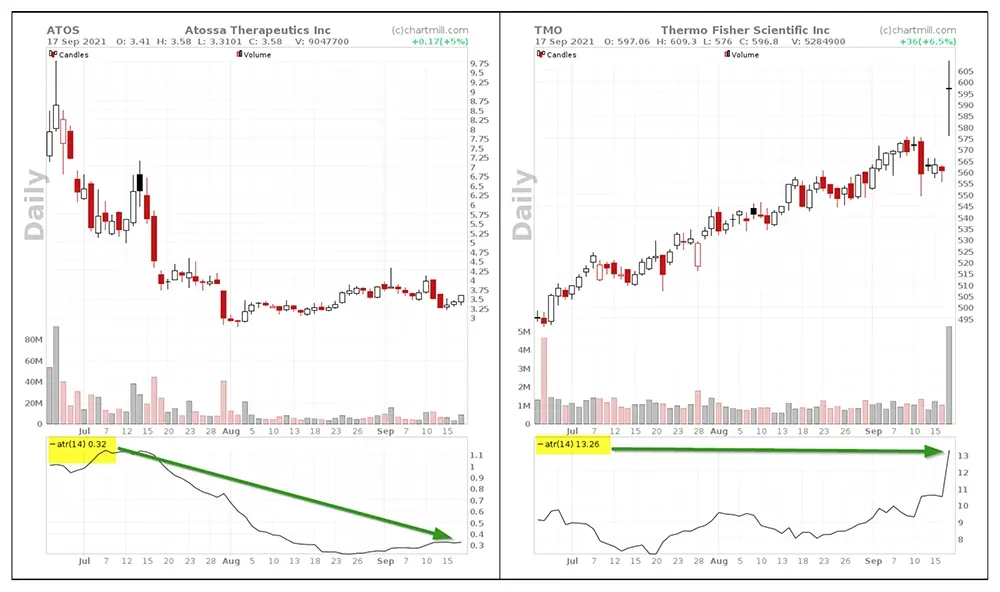
With a closing price at $3.58, ATOS has an ATR value of 0.32 (average ATR over the past 14 days). Compare that to TMO stock which has an ATR value of 13.26. TMO is quoted at a current price of $596.8.
So never try to compare ATR values between different shares. The indicator was never intended for this purpose. The big difference in ATR values between shares does not affect the usefulness of the indicator to show the individual volatility of that share.
How To Use the Average True Range Indicator?
Using the ATR to visualize volatility is rather easy. However, there is one detail to keep in mind, the indicator says nothing about the direction the stock is going. A rising indicator indicates higher volatility. This can be in both rising and falling markets. Take a look at the ATR (14) evolution of the Apple stock (AAPL) :
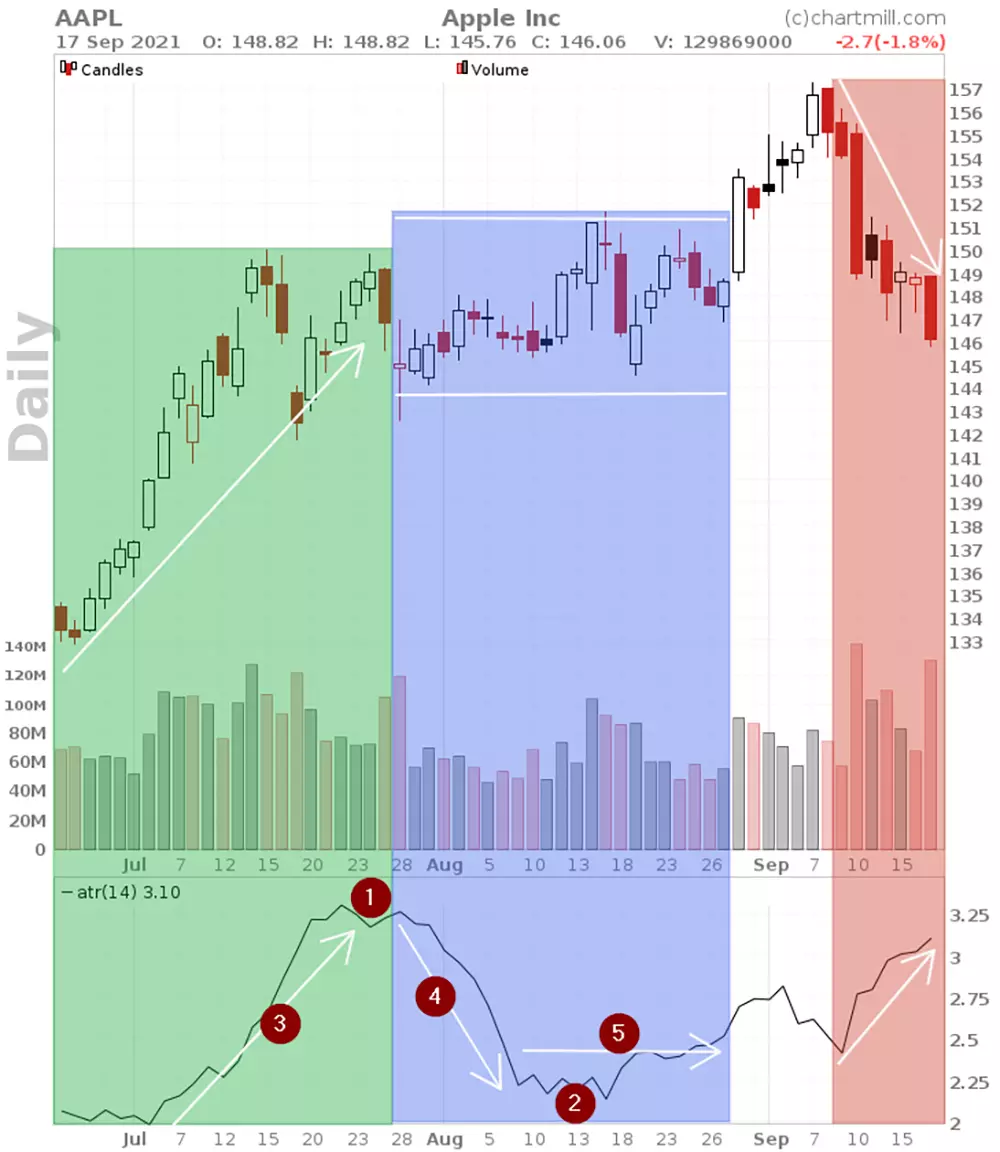
- A higher ATR value (1) is usually the result of a rising or falling underlying value while a lower ATR (2) is a sign that the price movement is rather calm.
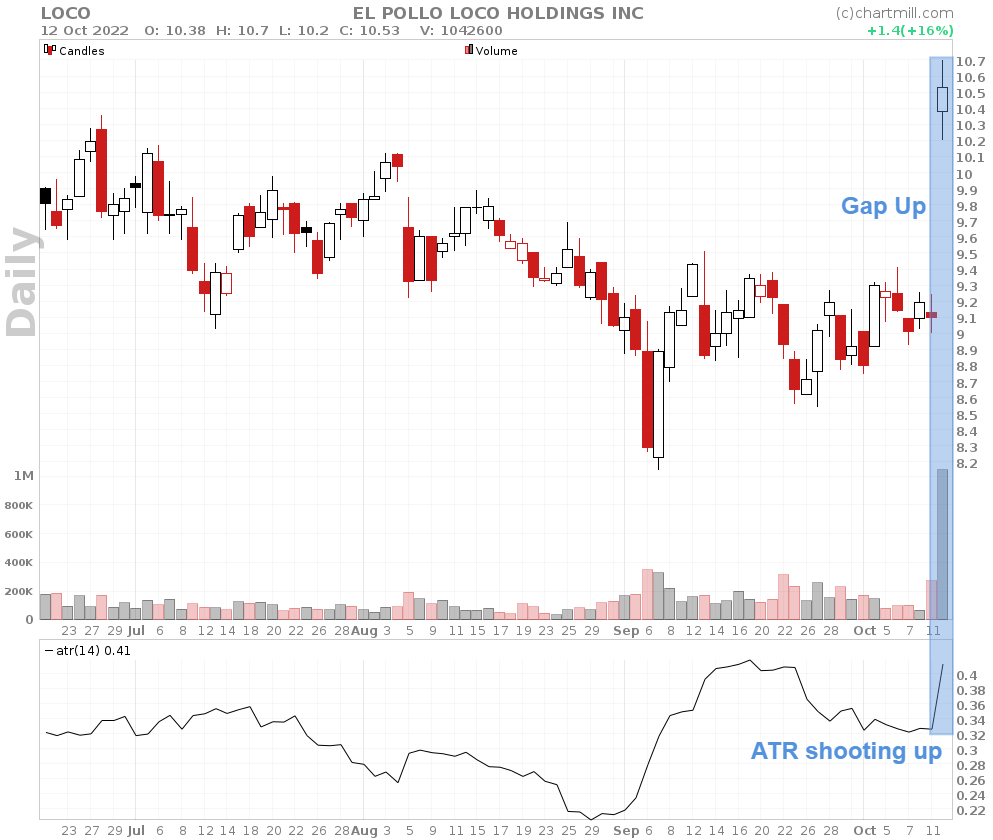
- An ATR that rises sharply in a short time (3) is a sign that the momentum with which the price rises or falls is very aggressive. This is characterized by the presence of gaps between trading periods.
- An ATR value which drops quickly (4) indicates that the momentum has dropped very abruptly.
- An ATR which moves sideways (5) indicates little movement, the price quietly flows on within a more or less defined range.
Average True Range Stop Loss
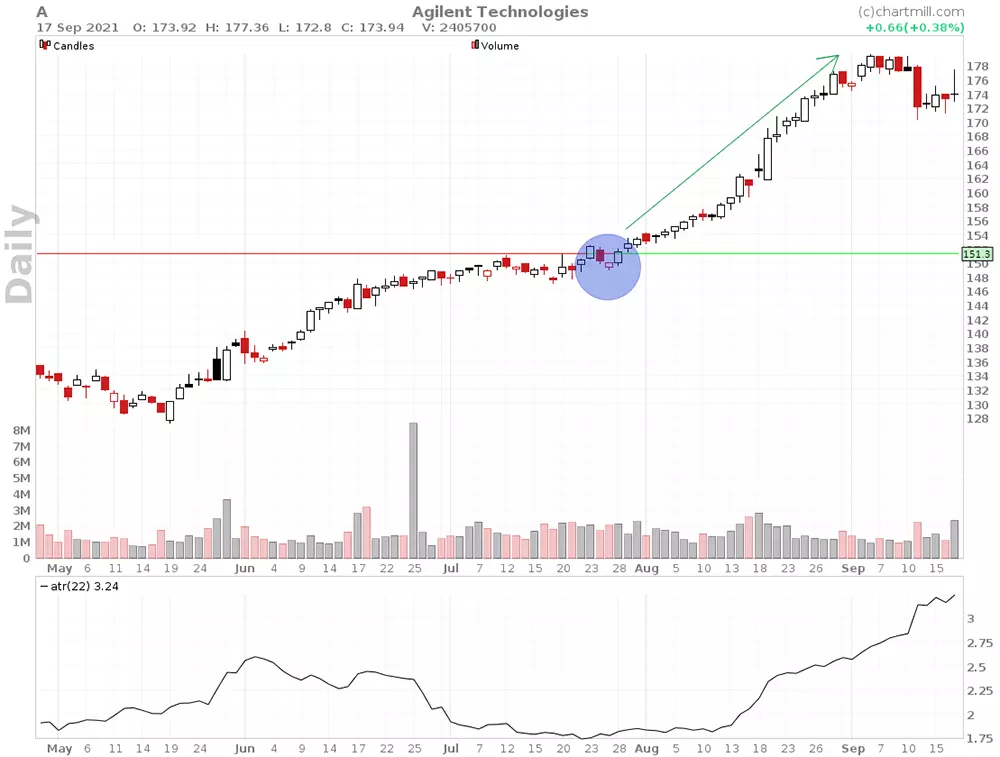
Undoubtedly the most practical application of the ATR indicator is that it allows you to determine your stoploss level, taking into account the volatility of the price. Let's take the chart of Agilent Technologies as of July 23, 2021.
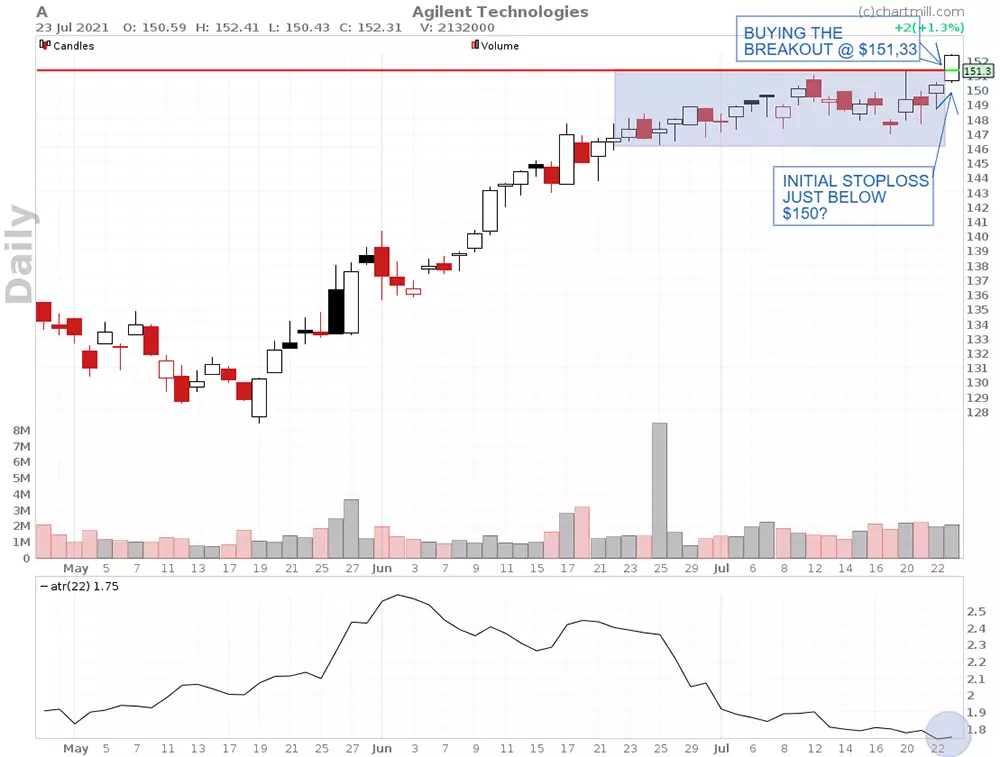
The price had been moving sideways between $151.30 and $146.40 for some time until that day. The ATR indicator is also trading at a low point, confirming very low volatility. On July 23, the stock rises 1.3% and closes above the highest point of the sideways range. This provides an excellent opportunity to take a long position.
Where do we position the initial stoploss? You could opt to place the stoploss just below the $150 level. At first glance that would not seem to be a bad choice. Unfortunately, this resulted in a loss because the stoploss was hit just two days later. Losses are inevitable even with the most successful trading strategies. But could the ATR indicator have added value here in determining the first stoploss level?
Suppose for a moment that we had indeed taken the ATR value into account before setting the stoploss. A general rule of thumb is that your initial stoploss in swing trading should be at least 2 ATR. The reason for this is to not get stopped out too quickly by an intraday move.
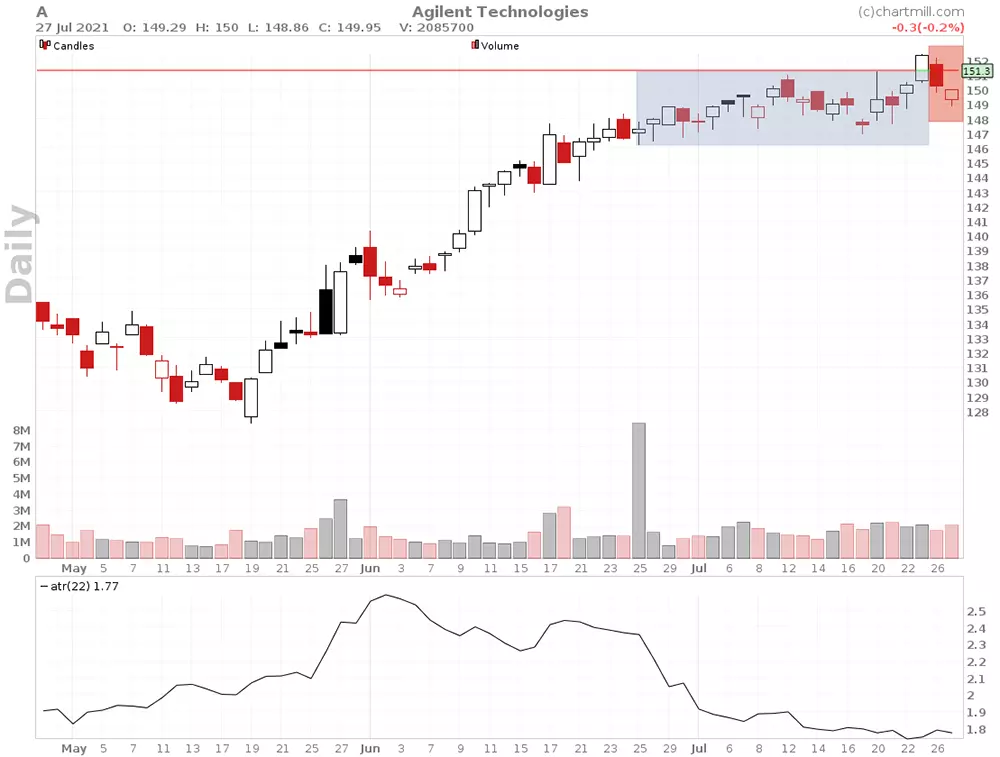
The ATR value at Agillent Technologies was at 1.75 at the time of entry (July 23, 2021). The chart below shows the ATR value on July 27, 2021.
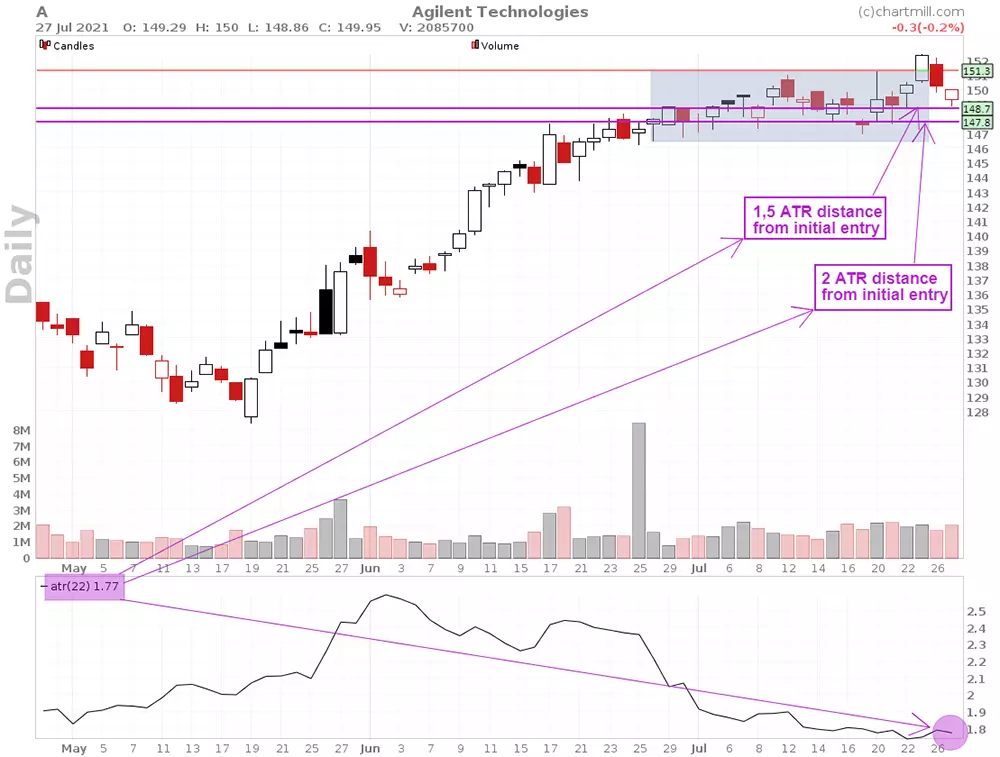
If we calculate twice the ATR as the minimum distance we get to 1.75*2= 3.5. So a stoploss at 2 ATR from the entry price ($151.33) would equate to $147.83 (lower purple horizontal line). And even with an ATR distance of only 1.5 times the ATR value, this would mean that the initial stoploss would be at $148.7.
In that case neither stop would have been hit on the decline after the initial breakout because the post-breakout low was at $148.86. In the case of Agilent Technologies, that makes a big difference when we consider the further price movement....
TIP: ChartMill offers the ability to enter a trailing stop based on an ATR value to protect your open position.
The chart below shows an example of such a trailing ATR stop at a distance of 3 ATR. The stoploss can only increase but never decrease, thus securing a larger portion of the profit each time.
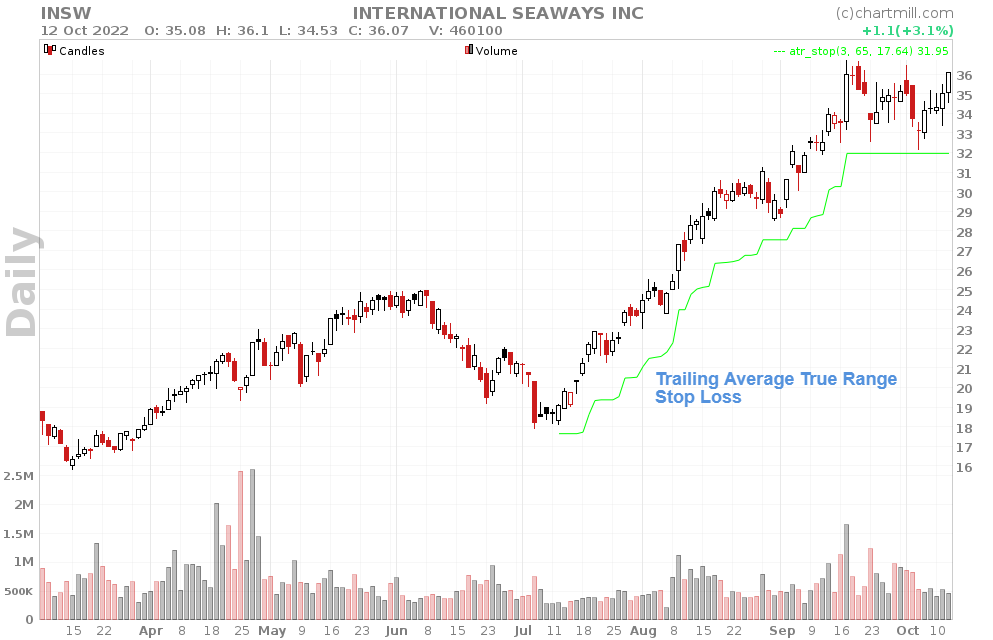
Read more in this article on the ATR-based stop
Final thoughts
The ATR indicator is a popular indicator, especially for the more experienced traders. Novice traders might overlook it because this indicator does not generate the typical buy or sell signals that they get from so many other indicators. And that's a real pity because this indicator definitely deserves a place in the toolbox of every trader who builds his or her trading strategy mainly on price action.
Even if you are a pure price action trader the indicator is very useful to avoid the temptation to place the stoploss too close to your entry price and get stopped out too soon.