
Best Indicators For Swing Trading Stocks | Enhance Your Swing Trading Setups.
Swing trading stocks can be an exciting and potentially profitable approach to the financial markets. It involves capturing short- to medium-term price movements within a larger trend.
To enhance your swing trading strategy, incorporating effective indicators and patterns can provide valuable insights and increase your chances of success.
In this article, we discuss some of the best indicators and patterns for swing trading in stocks. Using them will make your trading strategy a lot more consistent, allowing you to better control your emotions while trading.
Best Indicators For Swing Trading
Moving Averages:
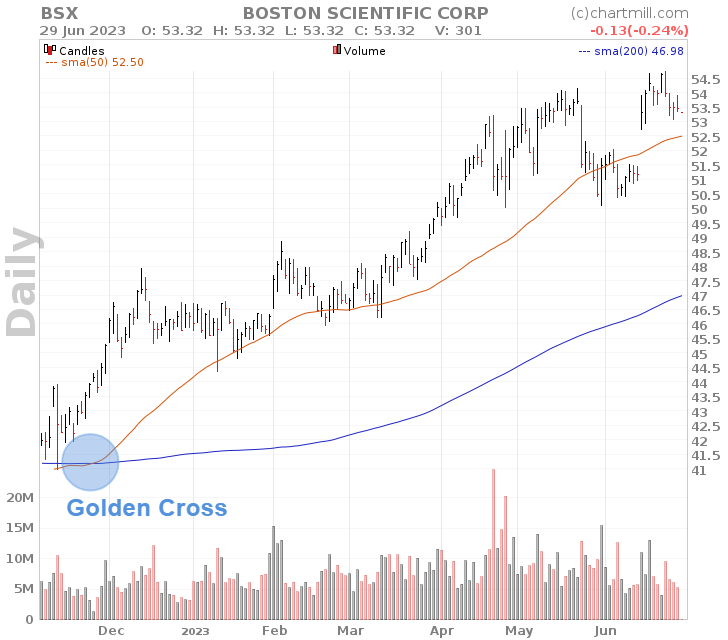
Moving averages are commonly used in swing trading to identify trend directions and potential support or resistance levels. The two most popular moving averages for swing trading are the 50-day and 200-day moving averages.
The crossover of these moving averages, also known as the 'golden cross', can signal potential entry or exit points. For instance, when the shorter-term moving average crosses above the longer-term moving average, it may indicate a bullish signal, while the opposite suggests a bearish signal.
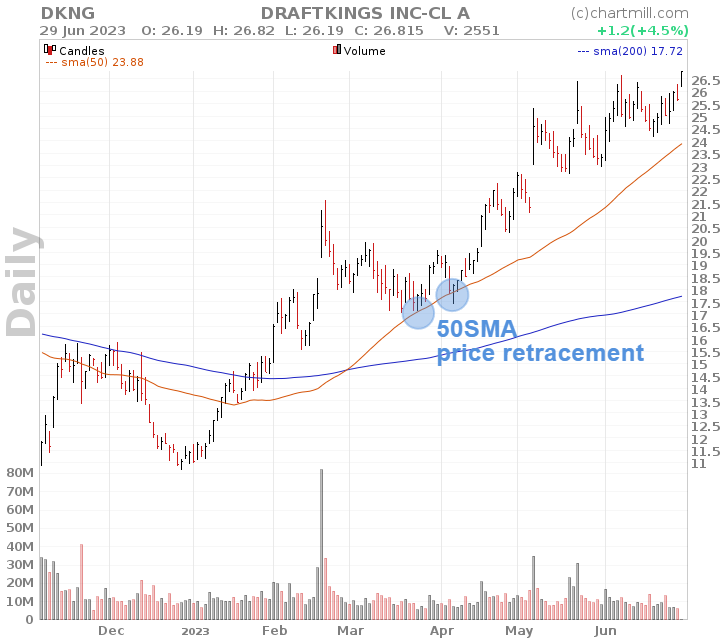
In addition, these two popular averages can also be used as potential support levels. For example, if the 50- and 200-day averages rise and the price falls back to the level of the 50-day average, this offers a good buying opportunity to open a long position since the prevailing long-term trend is positive.
Relative Strength Index (RSI):
The RSI is a momentum oscillator that measures the speed and change of price movements. It ranges from 0 to 100 and helps identify overbought or oversold conditions in a stock.
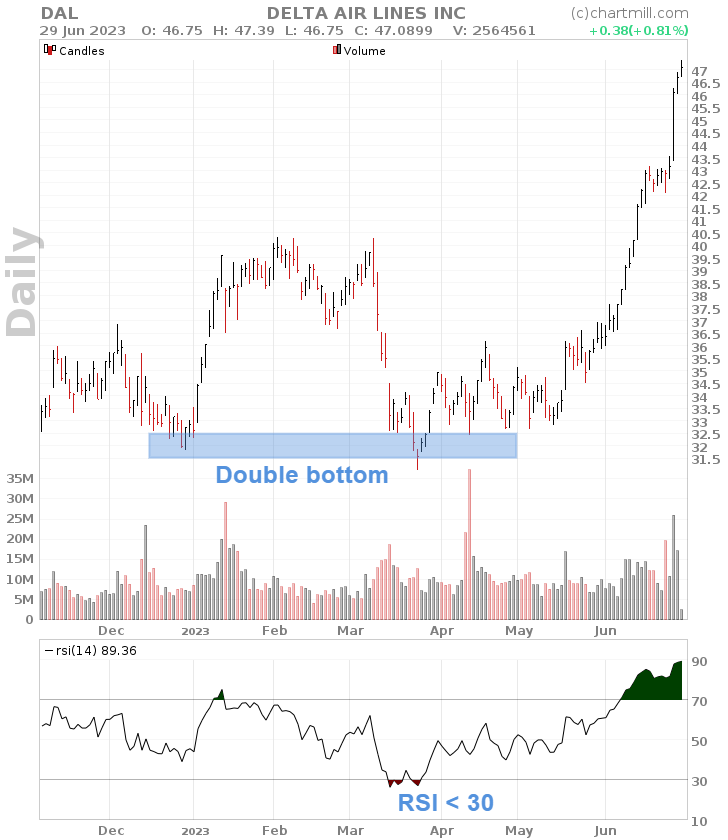
In swing trading, RSI readings above 70 suggest the stock is overbought and may be due for a price correction or reversal, while readings below 30 indicate oversold conditions, potentially signaling a buying opportunity.
Keep in mind that the indicator alone is insufficient to base an entry signal on. It is best used in conjunction with other elements on the chart pointing in the same direction.
This could be the price rebounding from a support level, a price breakout from a bullish flag or triangle pattern, or when a typical candlestick formation occurs at the same time.
Bollinger Bands:
Bollinger Bands consist of a middle-moving average and two standard deviation channels. They help identify volatility and potential price reversals.
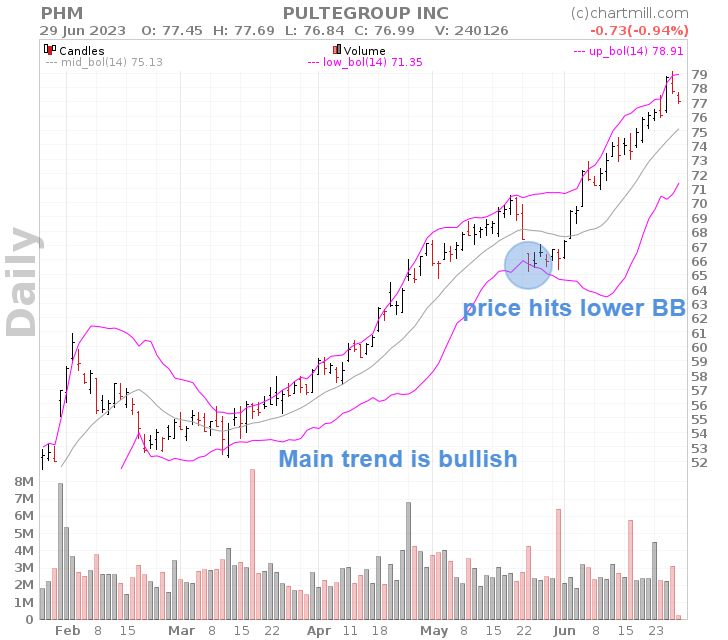
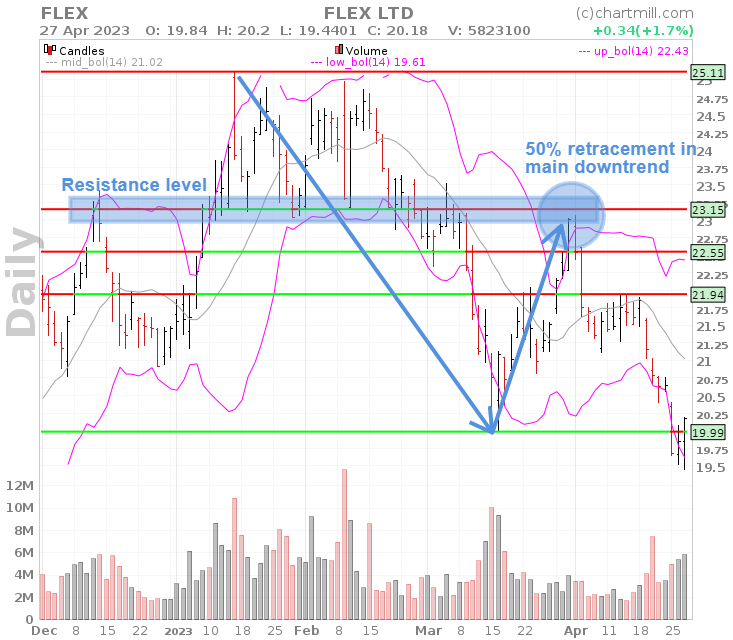
The most popular application of Bollinger Bands occurs when used in a retracement or pullback strategy. In a long-term downtrend, when the price temporarily rises and hits the upper Bollinger Band, this is a selling opportunity.
Conversely, when the price in a long-term downtrend approaches the lower Bollinger Band, it may be oversold, indicating a potential buying opportunity.
Another well-known application is the squeeze play setup, which is a swing trading breakout strategy that uses Bollinger Bands and Keltner Channels. This strategy requires the formation of a narrow sideways trading range after a previous uptrend, where the upper and lower Bollinger band are within the area of the Keltner Channels.
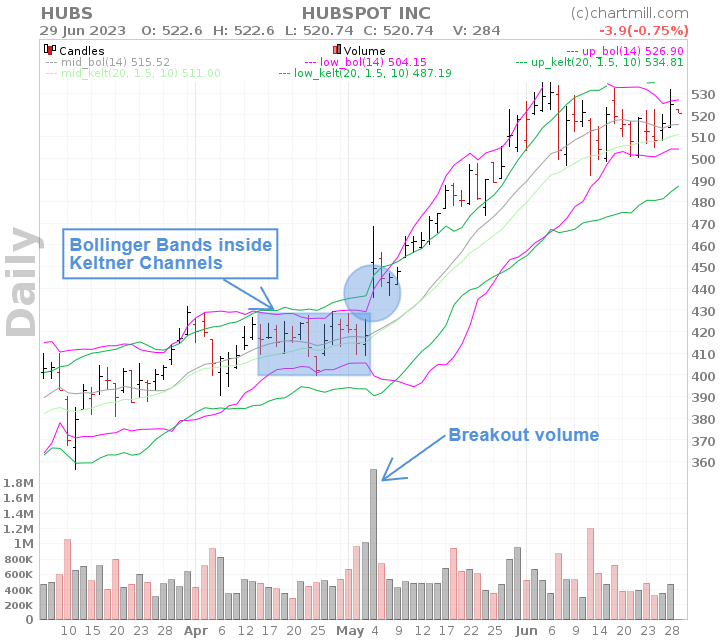
As soon as the price breaks out above the upper Bollinger band, a long position is taken. More information can be found in this video - starting at 05:34 .
Finally, this indicator can also be used in a swing trading mean reversion strategy. This involves looking for shares that have fallen (too) hard in a short period, causing the price to close below the lower Bollinger band.
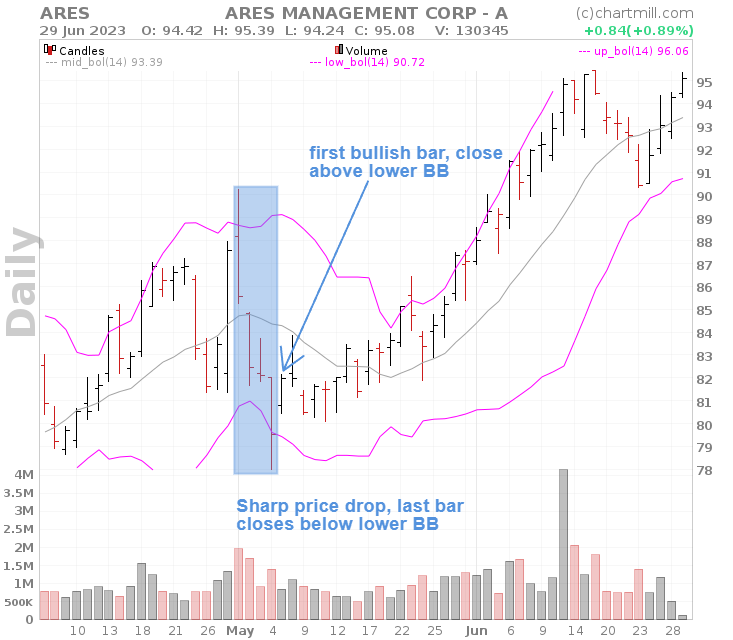
When the following day the price closes above the lower Bollinger band again, this is an entry signal to open a long position. The trader assumes that the price movement was an exaggerated reaction and that the price will recover to an earlier level.
Volume:
Volume is an essential indicator that provides insights into the strength and validity of price movements. Higher-than-average volume during a specific price movement suggests increased market participation and strengthens its significance of it.
It is often used in conjunction with other indicators to confirm signals or identify potential trend reversals.
The importance of volume is all too often underestimated while it is precisely an indicator that contains a lot of essential information for the active investor. Be sure to watch our video "The Importance of Volume in Trading (and Why it Matters!)" in which we explain exactly why that is the case.
Fibonacci Retracement:
Fibonacci retracement levels help identify potential support and resistance levels based on key Fibonacci ratios.
These levels are drawn by identifying significant price swings and can act as areas of price reversal. Swing traders often use Fibonacci retracement levels to determine potential entry or exit points based on the stock's price retracement within a larger trend.
MACD (Moving Average Convergence Divergence):
The MACD is a trend-following momentum indicator that helps identify potential trend reversals. It consists of two lines, the MACD line, and the signal line.
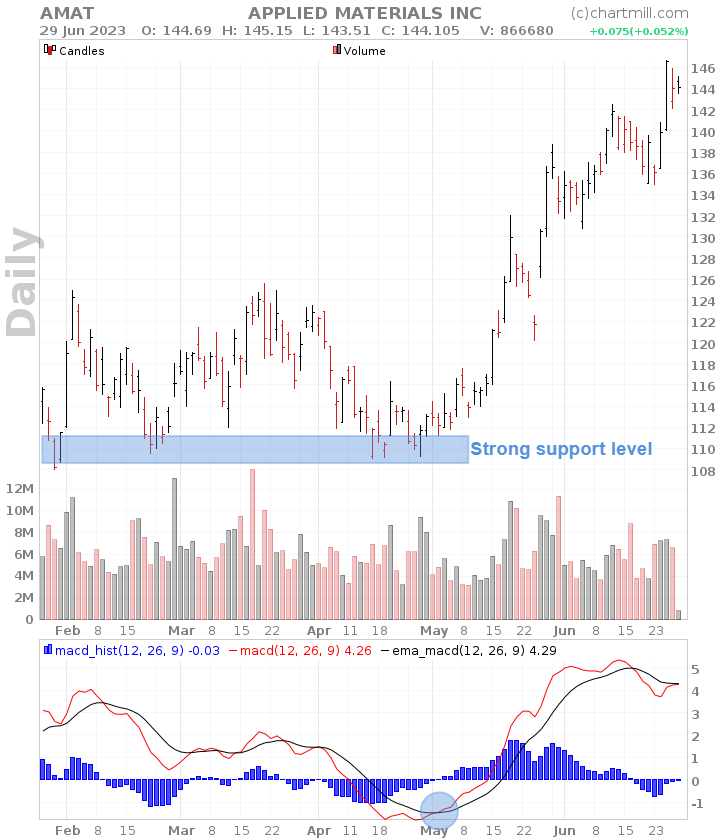
When the MACD line crosses above the signal line, it generates a bullish signal, indicating a potential buying opportunity. Conversely, when the MACD line crosses below the signal line, it generates a bearish signal, suggesting a potential selling opportunity.
As with other indicators, the MACD indicator should never be used alone to generate entry signals.
It's important to note that no single indicator guarantees success. It is crucial to use indicators in conjunction with other factors such as market conditions and company fundamentals.
Using Chart Patterns and Candlestick formations
Triangle Patterns:
Triangle patterns, such as ascending and descending triangles are typical continuation patterns when visible in a clear long-term trend. They can be perfectly used as entry signals in a swing trading strategy.
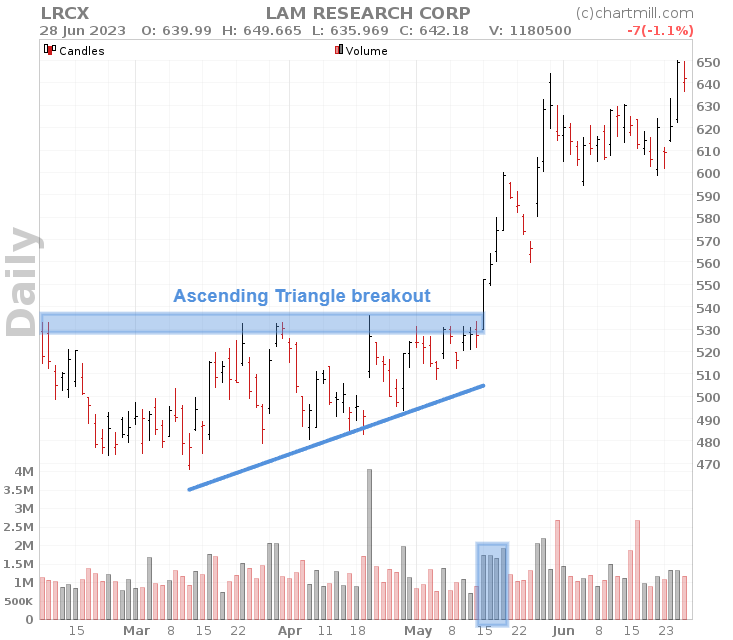
A rising triangle pattern occurring during a long-term uptrend indicates a bullish breakout. The reverse is true for a falling triangle pattern during a long-term downtrend. Here, a bearish breakout is assumed.
A symmetrical triangle pattern is rather neutral, i.e. the breakout occurs in the direction of the existing long-term trend so it is also a continuation pattern. Or the breakout occurs in the opposite direction indicating a reversal pattern.
Bull and Bear Flag Patterns:
Bullish and bearish flags are powerful technical chart patterns and as such are well-suited to be used in swing trading strategies.
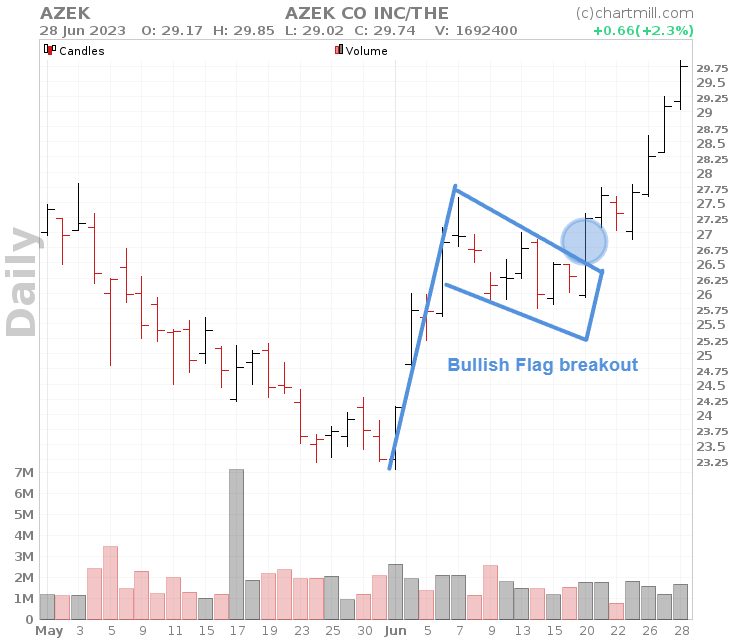
An upward breakout from a bullish flag pattern is an entry signal to take a long position. With the bearish flag pattern, there is a downward breakout and a short position can be considered.
Learn more about the specifics of the bullish flag and how to use it in a trading strategy in our article "Bull Flag Trading: How to do it?”.
Engulfing Candlestick patterns
The bullish engulfing pattern occurs when a small bearish candle is followed by a larger bullish candle that completely engulfs the previous candle's range. It suggests a potential trend reversal from bearish to bullish.
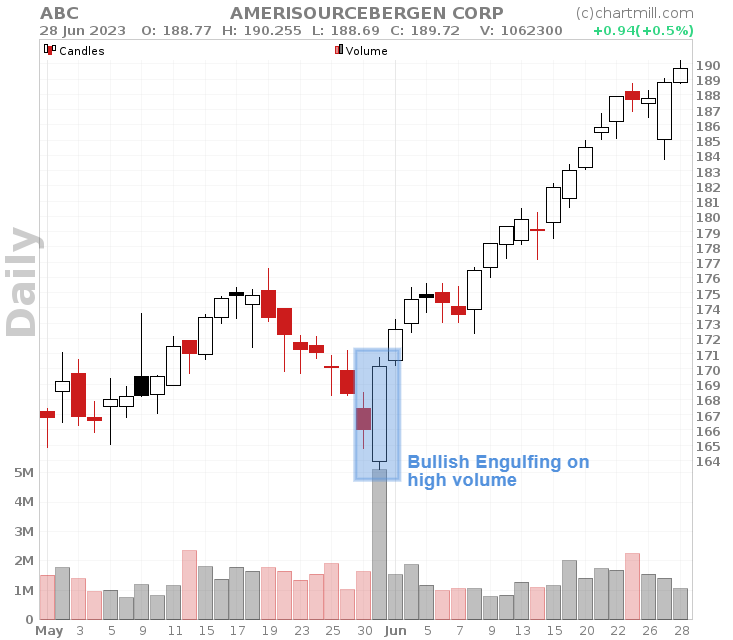
Conversely, the bearish engulfing pattern is the opposite, indicating a potential reversal from bullish to bearish.
The best way to use these engulfing patterns in swing trading is when they are visible after a price pullback in a rising trend (bullish engulfing) or a price pullback in a falling main trend (bearish engulfing).
In that case, both patterns are used to take a position in the direction of the prevailing main trend up to that point.
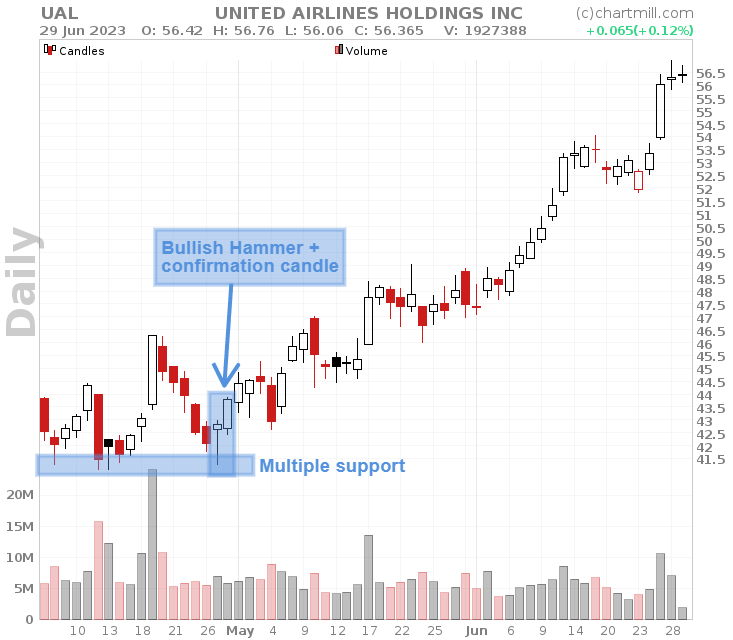
Hammer Candlesticks
The bullish hammer pattern is characterized by a small body and a long lower shadow. It mainly proves its usefulness in active swing trading strategies in which the pattern is used as a warning signal that an existing bearish trend might be reversing.
The bearish hammer or hanging man has similar characteristics but appears in different market conditions. This specific candlestick is mainly visible after an uptrend, signaling a potential reversal to the downside.
Keep in mind that both of these patterns occur frequently, so it is consequently important to wait for a confirmation candle.
Conclusion:
-
Incorporating the right indicators into your swing trading strategy can significantly enhance your ability to identify potential entry and exit points, manage risk, and maximize profits.
-
Remember that swing trading requires a lot of practice and study to master this technique so that you can become more structurally profitable in the long run.
-
You certainly don't have to limit yourself to the indicators and chart or candlestick patterns covered in this article. There are many more possibilities to try out and build a swing trading strategy around them.
-
However, don't make it too complicated. It is much better to have a good understanding of the operation and application of just a few indicators to apply them efficiently in sometimes rapidly changing market conditions.
-
By focusing on only a limited number of indicators, you will build much more know-how and gain experience. As a result, your success rate as far as those few indicators are concerned will undoubtedly increase over time. This is imperative to become structurally profitable in the long run.
You Might Also Be Interested In...
Exploring The Best Moving Averages For Swing Trading Success
In the fast-paced world of financial markets, swing trading has emerged as a popular strategy among traders seeking to profit from short to medium-term price movements. Read More...
Swing Trading Risk Management: Navigating the volatile waters of trading.
In this article, we highlight some decent swing trading risk management practices to minimize your risk, so that your trading capital enjoys maximum protection. Read more...
Learn How To Swing Trade | A complete step by step guide for swing traders
This comprehensive guide is an extension of our basic "what is swing trading" article and contains a lot of valuable information and insights for beginning swing traders. Read more...
How To Find Good Swing Trading Setups? (video)
Popular Screens: Swing Trading
This screen is looking for pull backs in strong stocks. Read more...