
(All data & visualisations by ChartMill.com)
Daily Market Trend Analysis – July 18, 2025 (After Market Close)
a relatively calm stock market day for the us indices
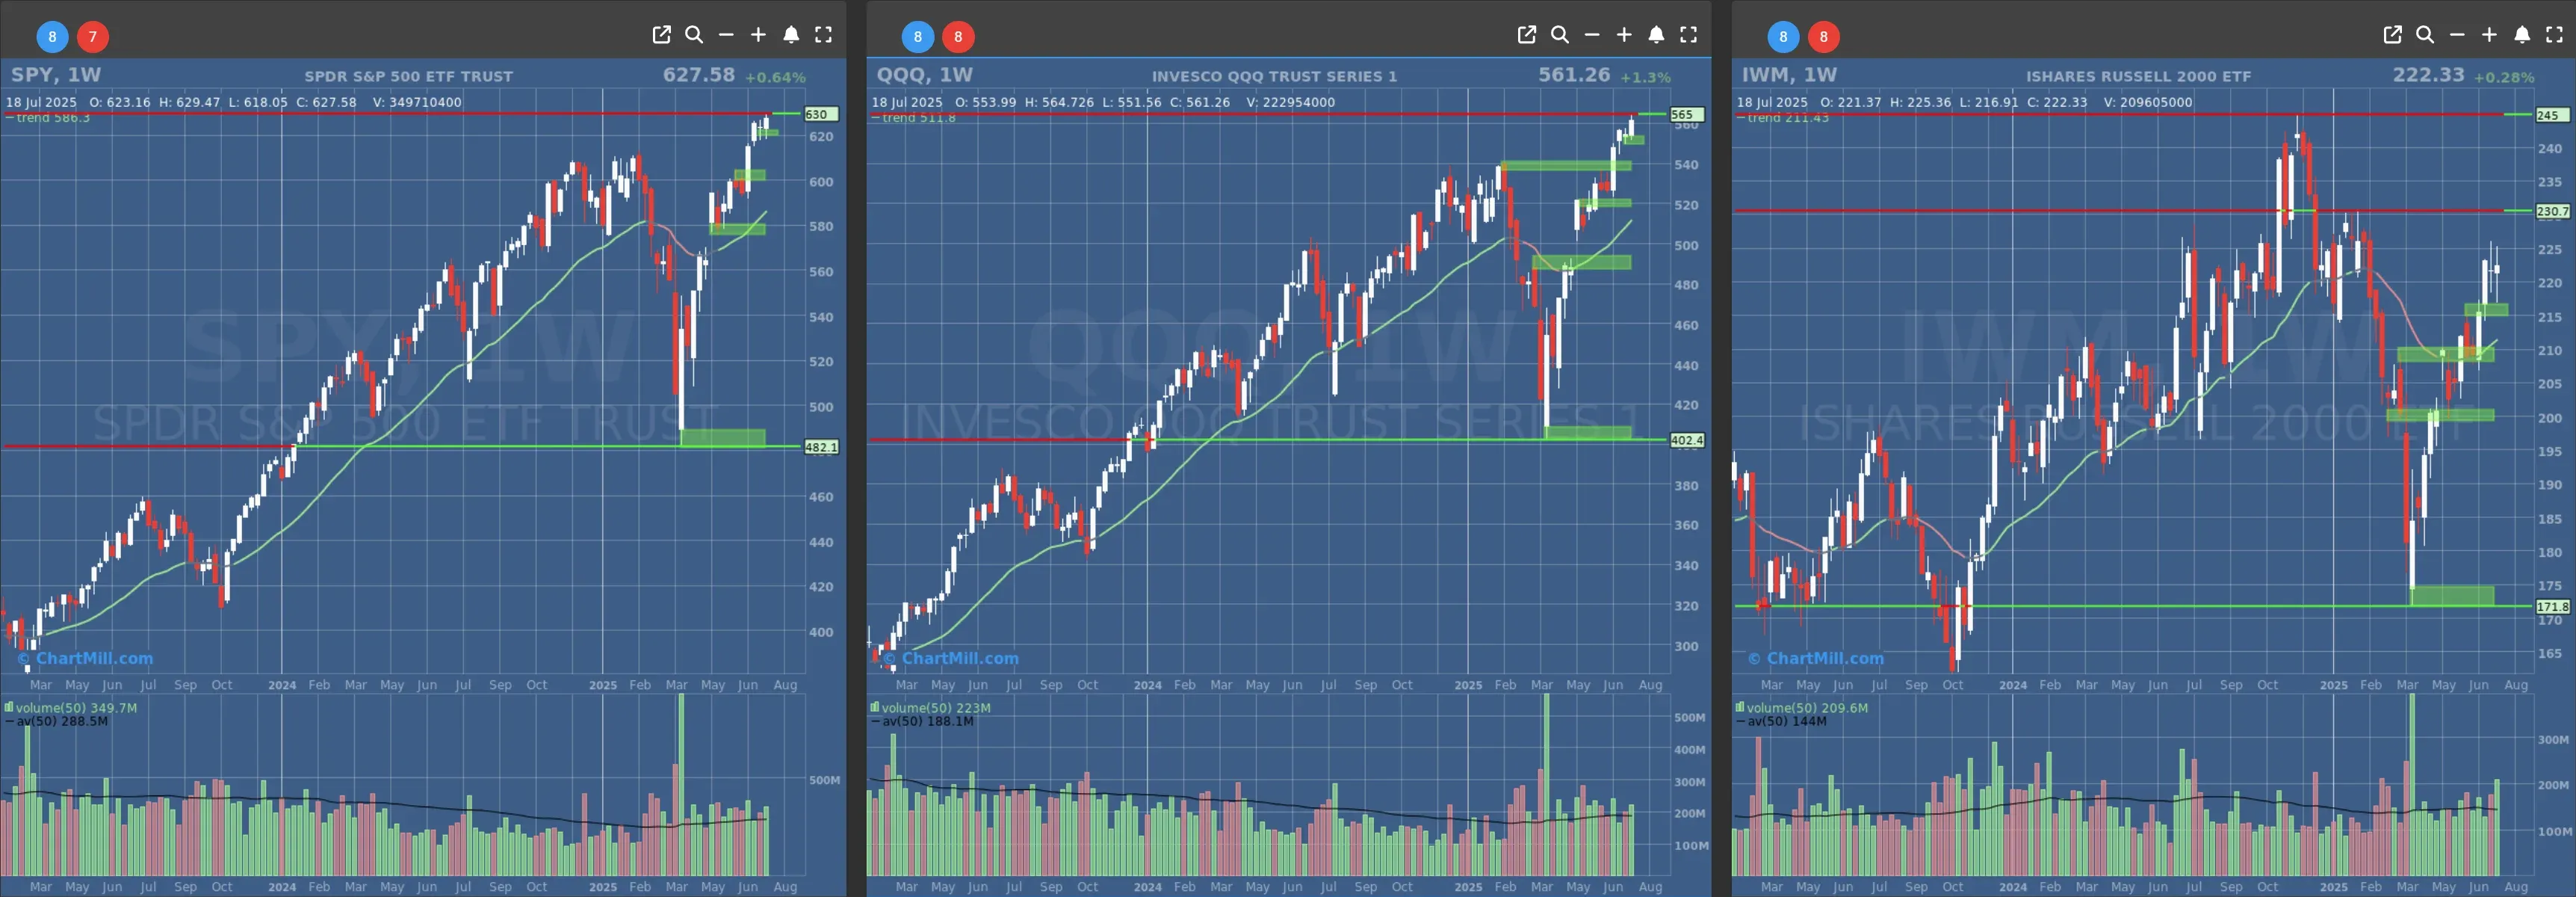
Short Term Trend

- Short-Term Trend: Bullish (no change)
- Next Support at $620 - $600
- Next Resistance at /
- Volume: At Average (50)
- Pattern: Down Day - New Intraday High
- Short-Term Trend: Bullish (no change)
- Next Support at $550 - $540
- Next Resistance at /
- Volume: At Average (50)
- Pattern: Down Day - New Intraday High
- Short-Term Trend: Bullish (no change)
- Next Support at $220
- Next Resistance at $225
- Volume: Above Average (50)
- Pattern: Down Day
Long Term Trend
- Long-Term Trend: Positive (no change)
- Long-Term Trend: Positive (no change)
- Long-Term Trend: Positive (no change)
Daily Market Breadth Analysis – July 18, 2025 (After Market Close)
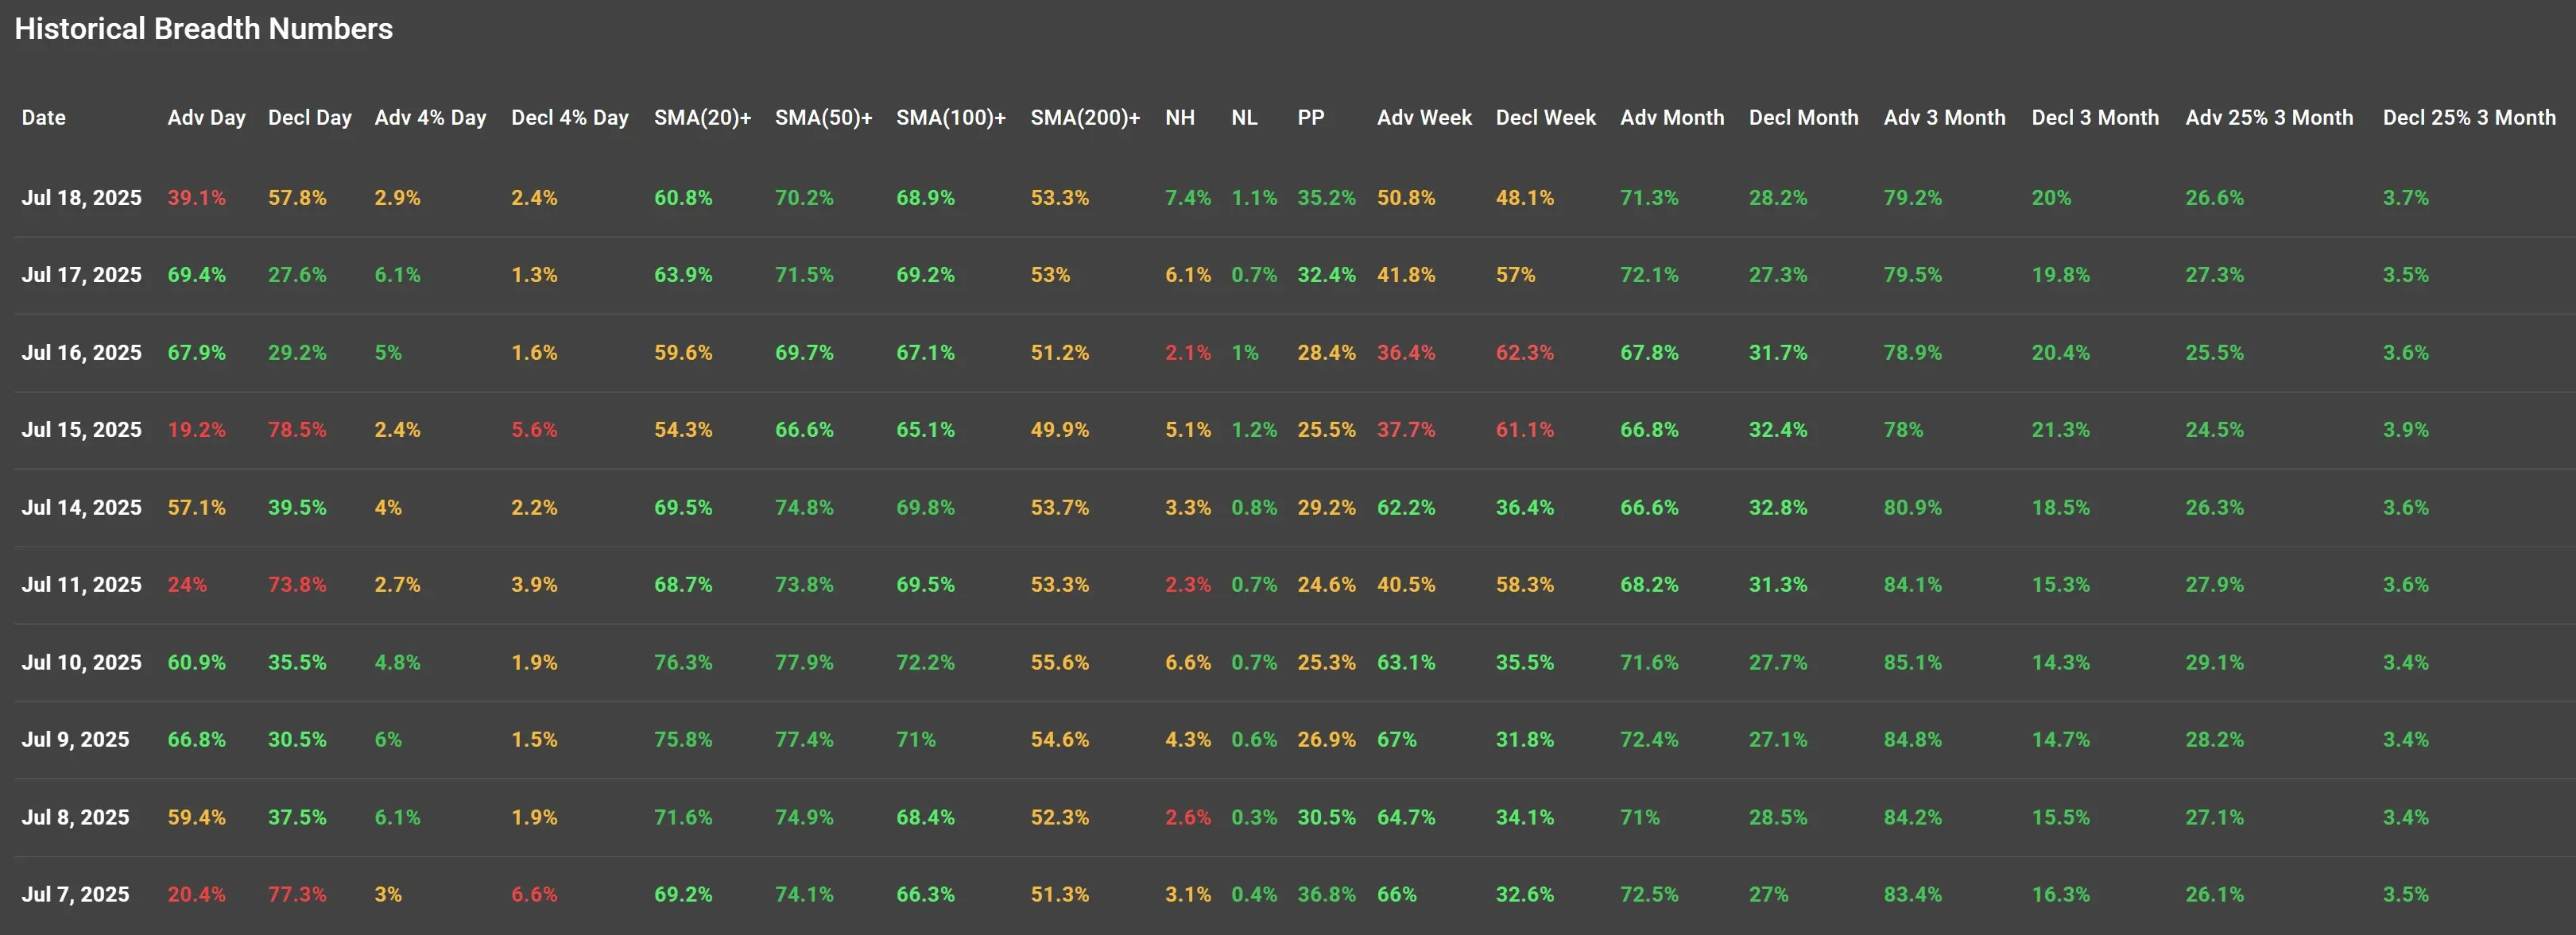
Market breadth data for July 18, 2025, shows a notable shift in sentiment following two strong advancing sessions on July 16 and 17. The figures reflect a mixed-to-weak day for market participation, with declining stocks regaining the upper hand and fewer stocks trading above key moving averages.
Day-over-Day Breadth Weakness Returns
-
Advancing issues dropped to 39.1%, down significantly from 69.4% the day before.
-
Decliners rose to 57.8%, up from 27.6%.
-
Only 2.9% of stocks rose more than 4%, nearly halving the 6.1% seen on July 17, suggesting fewer high-momentum breakouts.
-
Decliners with losses greater than 4% rose slightly to 2.4%.
This shift contrasts sharply with the strong upward breadth seen on July 17 and 16, when over two-thirds of stocks advanced. Friday's session marked a pause in the recent rebound, suggesting sellers stepped in to fade the rally, potentially a reflection of profit-taking ahead of the weekend or caution before upcoming earnings results.
Technical Participation Softens Slightly
The percentage of stocks above short- and medium-term moving averages remains relatively healthy but weakened compared to Thursday:
-
SMA(20)+ fell to 60.8% (vs. 63.9% prior).
-
SMA(50)+ declined slightly to 70.2% (vs. 71.5%).
-
SMA(100)+ dipped to 68.9% (vs. 69.2%).
-
SMA(200)+ remained stable at 53.3%.
While the longer-term trend remains intact (especially above the 50- and 100-day SMAs), Friday's session failed to build further upward momentum.
New Highs Still Low, New Lows Stable
-
New highs (NH) rose slightly to 7.4% (from 6.1%), a positive divergence from the day’s broader weakness.
-
New lows (NL) remained subdued at 1.1%.
This uptick in new highs, despite the lower advance-decline ratio, suggests continued strength in selected leadership stocks - likely large-cap tech and growth names - though broad participation narrowed.
Short-Term Breadth (Past Week) Begins to Fade
-
Weekly advancing breadth eased to 50.8%, down from 41.8% on Thursday (which itself was a rebound from 36.4% Wednesday).
-
Weekly decliners stood at 48.1%, a near balance.
While the weekly picture had improved after Monday–Tuesday weakness, Friday’s stall prevented a full swing back toward bullish dominance.
Medium- to Longer-Term Breadth Still Constructive
-
Advancing stocks over the past month held up at 71.3% (similar to 72.1% Thursday).
-
Advancing 3-month breadth ticked lower to 79.2% (from 79.5%), while decliners over the same period remained stable at 20%.
-
High-volume advancers over 3 months held steady at 26.6%.
These figures show that despite the weak daily result, the broader trend remains positive, with nearly 80% of stocks up over the past three months—a sign of structural market health.
Context & Conclusion
Friday’s breadth data suggests a modest cooling off after a strong two-day run, potentially driven by short-term profit-taking or caution heading into a weekend filled with earnings anticipation. While the daily breadth was weak, the intermediate- and longer-term metrics continue to show robust participation.
However, the lack of broad follow-through after strong sessions on July 16–17 could indicate market participants are becoming more selective, awaiting further catalysts, likely from upcoming major earnings reports or macroeconomic signals.
The key takeaway: The uptrend remains intact, but Friday's session serves as a reminder of fragility in breadth strength, especially if future sessions fail to reclaim the momentum seen mid-week.
Kristoff - ChartMill
Next to read: Market Monitor News, July 21