

(All data & visualisations by ChartMill.com)
Daily Market Trend Analysis – August 18, 2025 (After Market Close)
Calm tape, waiting on Powell
Short Term Trend
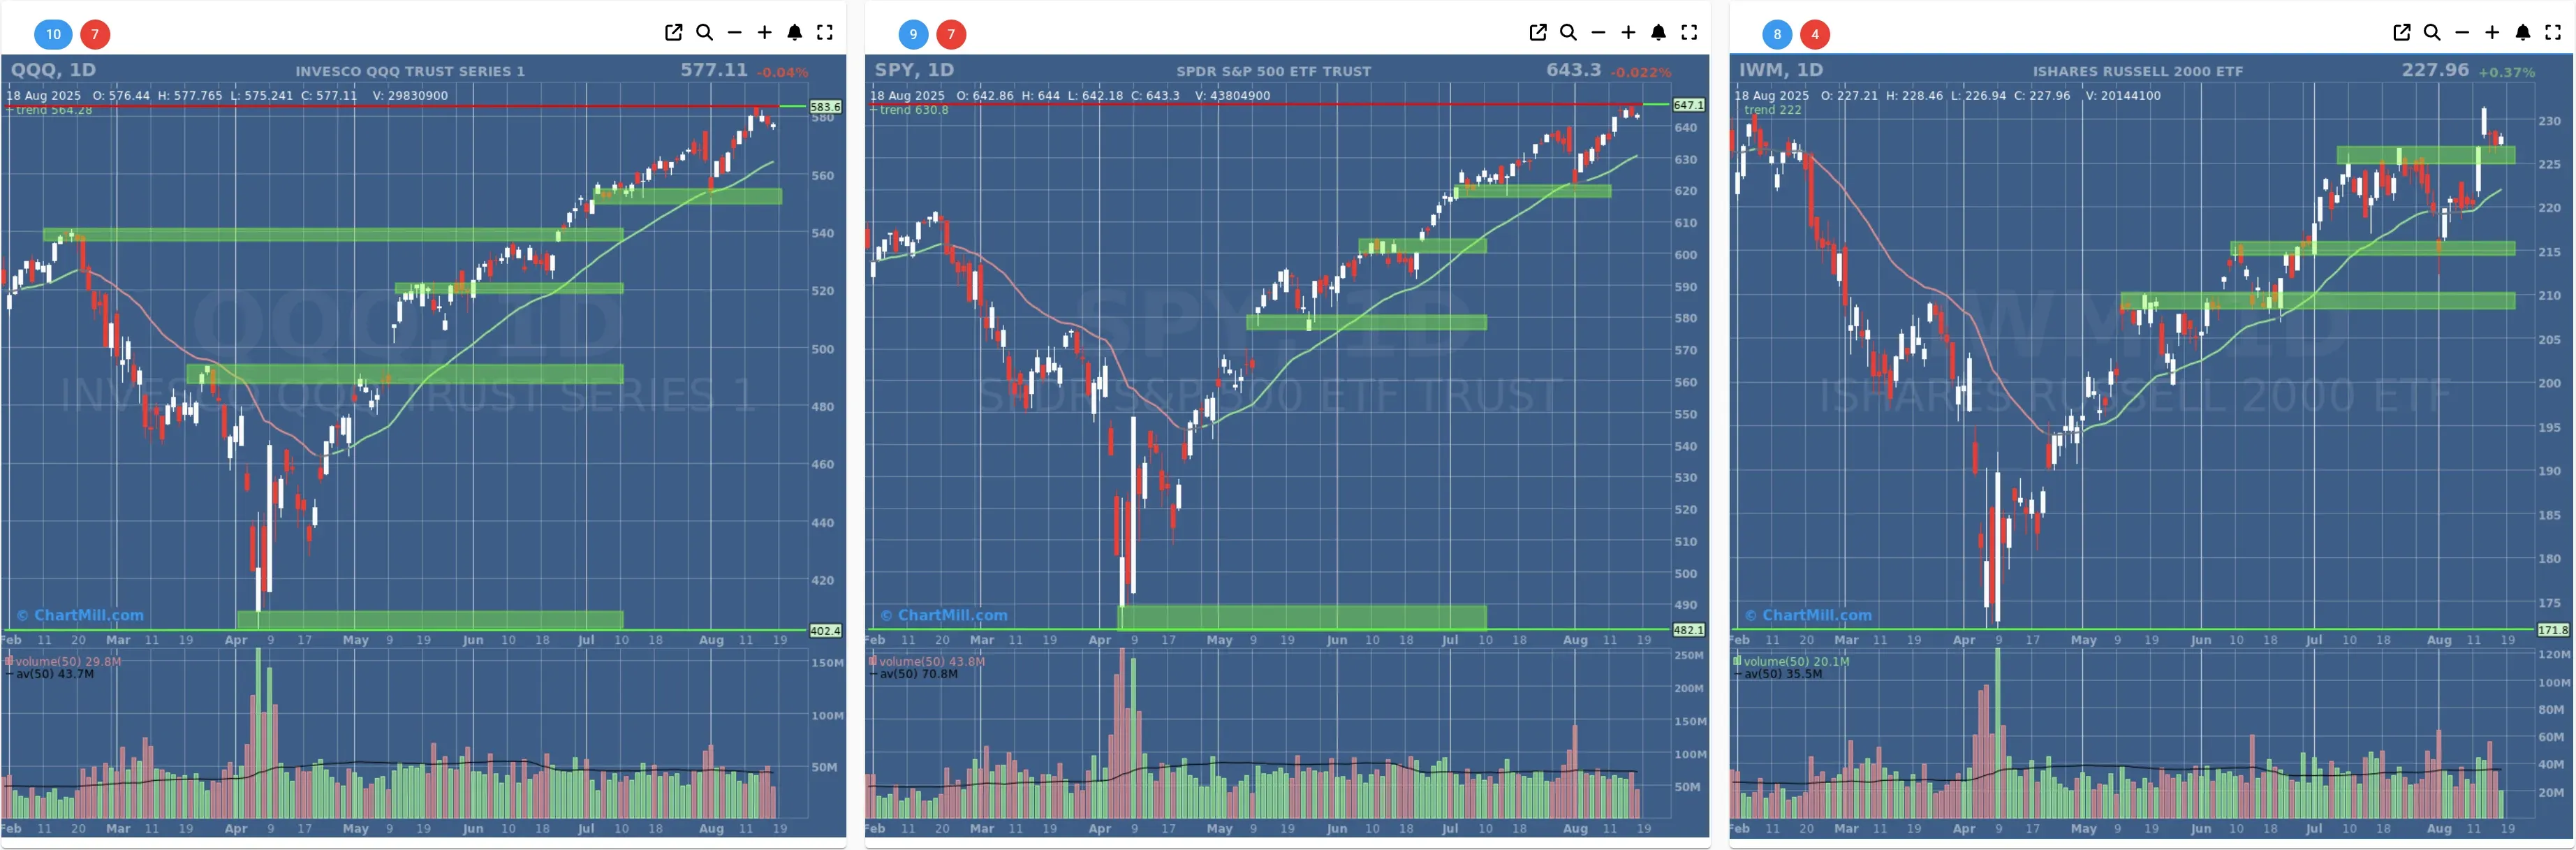
- Short-Term Trend: Bullish (from neutral)
- Next Support at $620 - $600
- Next Resistance at /
- Volume: Well Below Average (50)
- Pattern: Down Day -Narrow Trading Range
- Short-Term Trend: Bullish (no change)
- Next Support at $550 - $540
- Next Resistance at /
- Volume: Well Below Average (50)
- Pattern: Down Day - Bull Flag Pattern
- Short-Term Trend: Positive (from neutral)
- Next Support at $225
- Next Resistance at $245
- Volume: Far Below Average (50)
- Pattern: Up Day - Inside Day
Long Term Trend
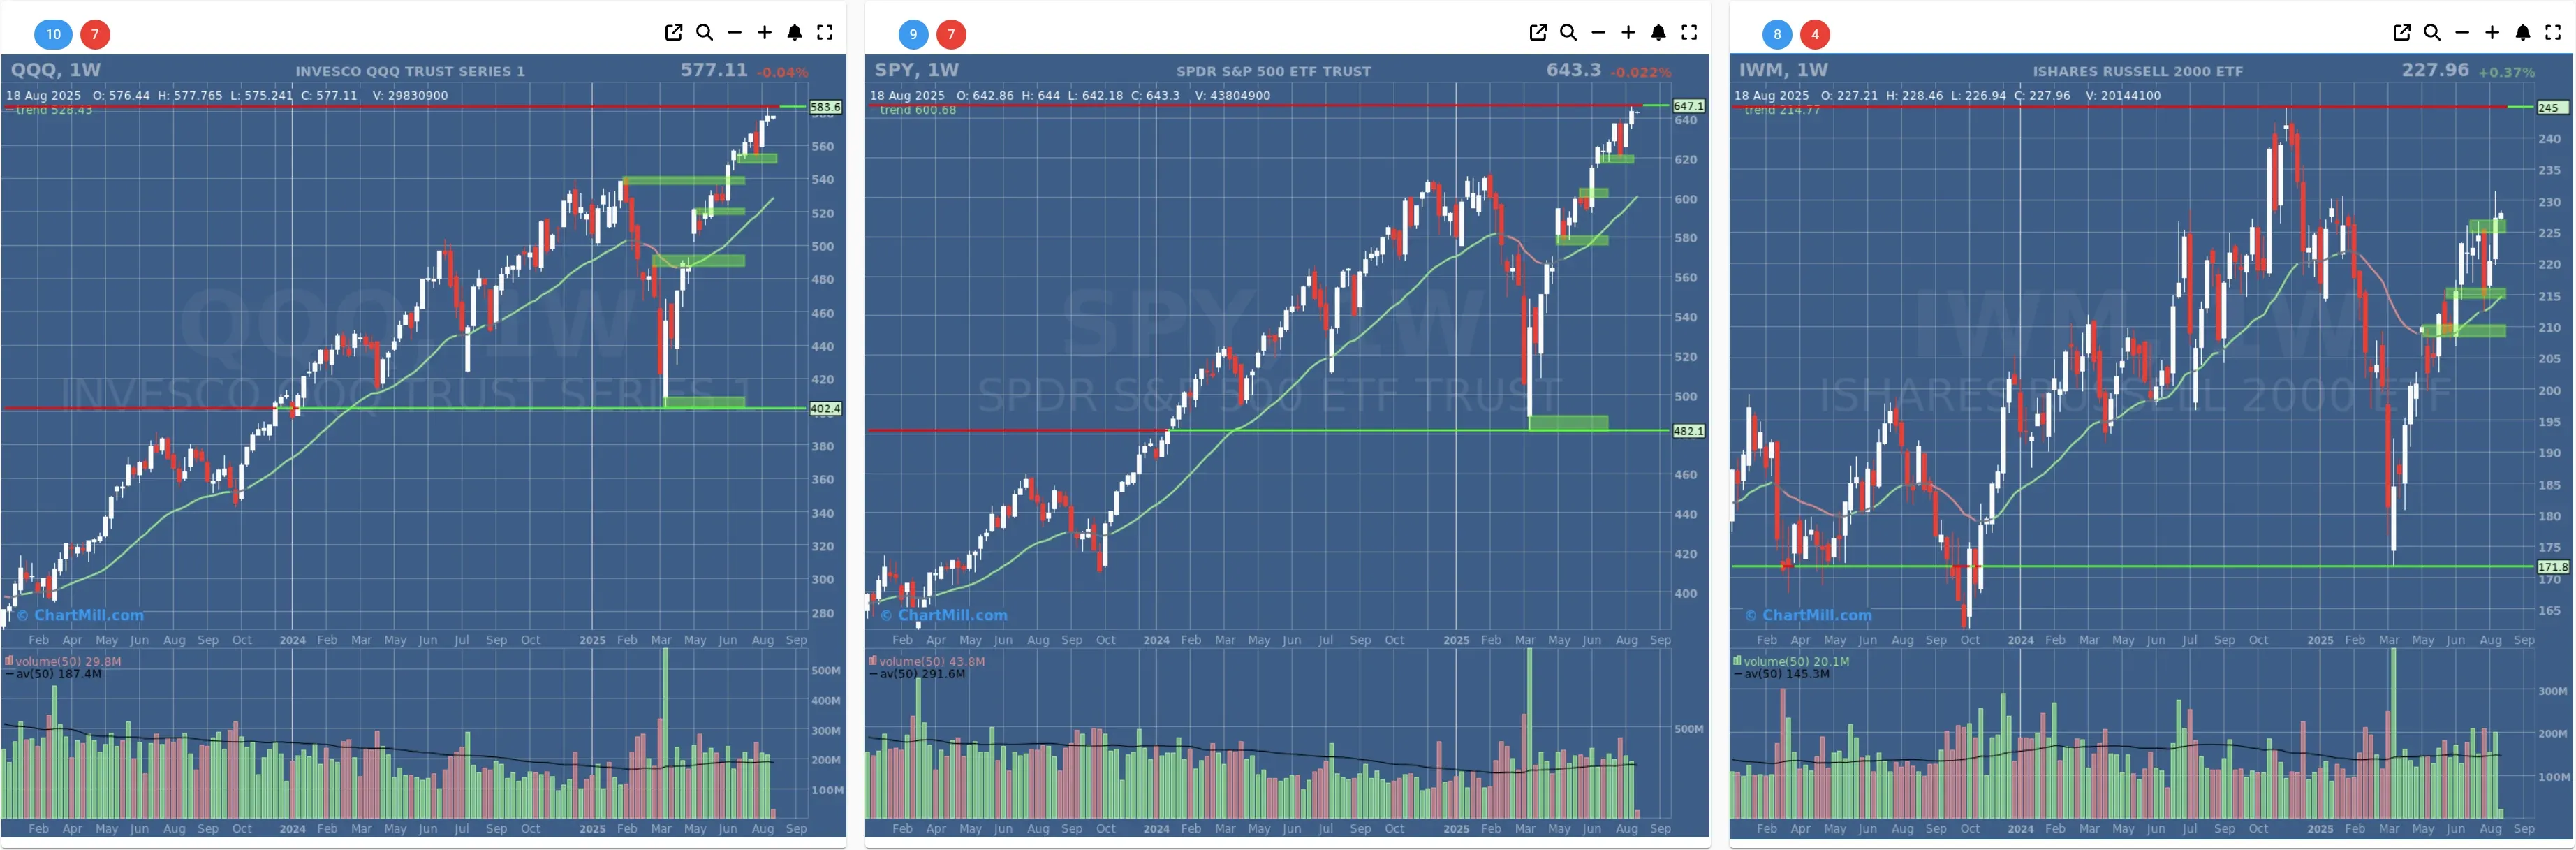
- Long-Term Trend: Positive (no change)
- Long-Term Trend: Positive (no change)
- Long-Term Trend: Positive (from neutral)
Daily Market Breadth Analysis – August 18, 2025 (After Market Close)
After Friday’s cooling, breadth improved modestly. Participation above key moving averages ticked up, weekly and multi‑month advance/decline composites strengthened, while new highs softened—suggesting a constructive trend with leadership still a bit hesitant.
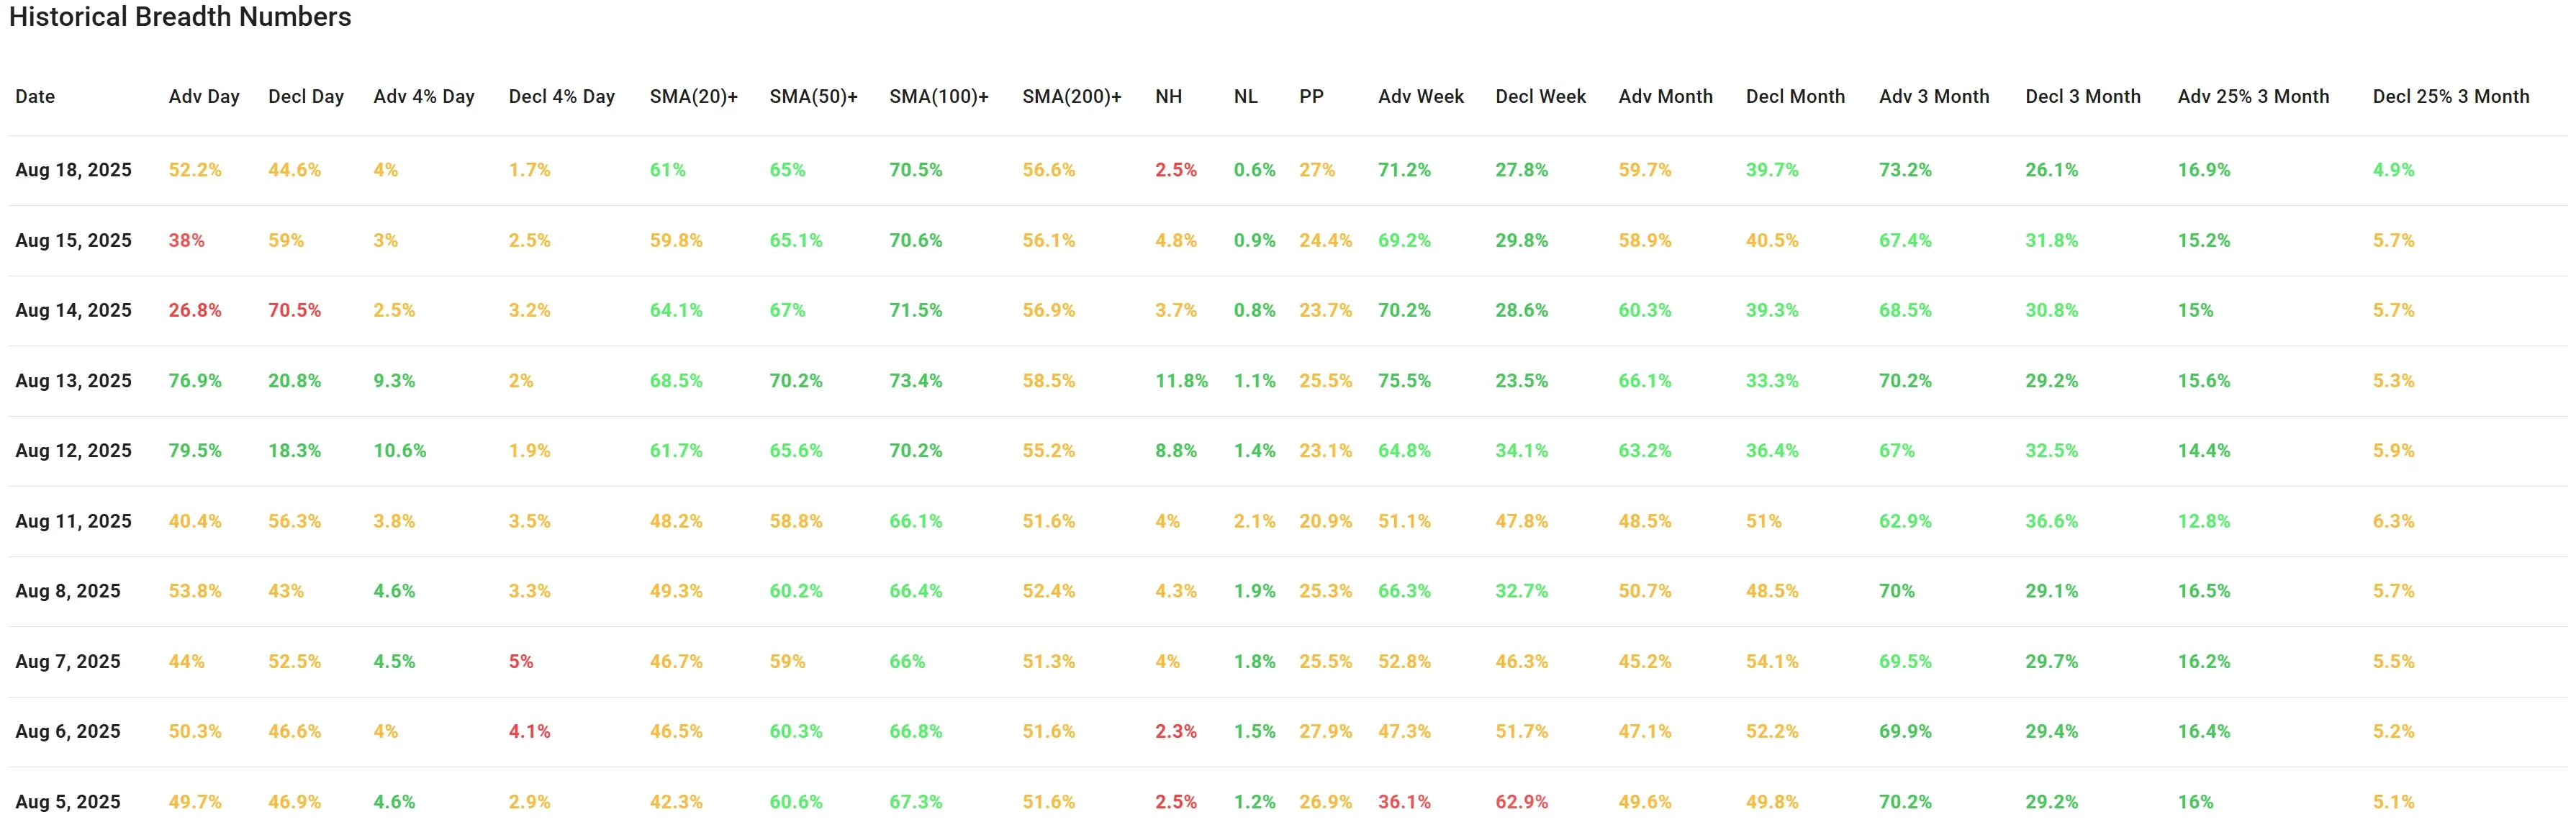
Daily participation (Aug 18, 2025):
-
Advancers 52.2% vs. decliners 44.6% — a small positive swing from Friday’s 38%/59%.
-
Big movers: +4% advancers at 4.0% outpaced −4% decliners at 1.7%, indicating healthier upside momentum than on Friday (3.0% / 2.5%).
-
“Pocket Pivots” improved to 27% (from 24.4%).
Breadth vs. moving averages:
-
Above SMA20: 61% (from 59.8%).
-
Above SMA50: 65% (roughly unchanged vs. 65.1%).
-
Above SMA100: 70.5% (flat).
-
Above SMA200: 56.6% (from 56.1%).
This keeps a majority of stocks above all key SMAs, a constructive backdrop that we highlighted earlier last week despite the mid‑week sell pressure.
Breakouts and breakdowns:
-
New highs: 2.5% (down from 4.8%).
-
New lows: 0.6% (down from 0.9%).
Leadership breadth softened (fewer NH), but stress stayed contained (very few NL).
Multi‑period advance/decline composites:
-
Weekly: Adv 71.2% / Decl 27.8% (better than 69.2% / 29.8%).
-
Monthly: Adv 59.7% / Decl 39.7% (from 58.9% / 40.5%).
-
3‑Month: Adv 73.2% / Decl 26.1% (strong jump from 67.4% / 31.8%).
-
3‑Month, ±25% movers: Adv 16.9% / Decl 4.9% (from 15.2% / 5.7%).
These mark a clear improvement in medium‑term participation, consistent with the broader trend we’ve been tracking since early August.
Context vs. the prior note:
On Friday we noted breadth had cooled after two strong sessions.
Today’s data show a stabilization and mild re‑acceleration: more stocks above short‑term averages, stronger weekly/monthly composites, and fewer deep decliners. The one caveat is weaker new‑highs, implying leadership is still cautious even as participation broadens.
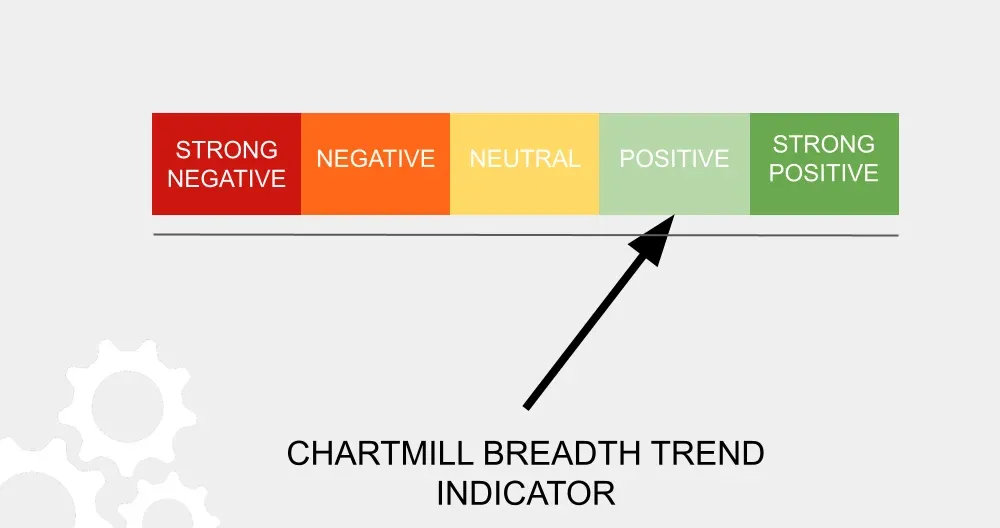
Bottom line — Breadth Trend Rating: Positive
Kristoff - ChartMill
Next to read: Market Monitor News, August 19 BMO