
(All data & visualisations by ChartMill.com)
Daily Market Trend Analysis – August 6, 2025 (After Market Close)
QQQ taking the lead, dull day for IWM
Short Term Trend
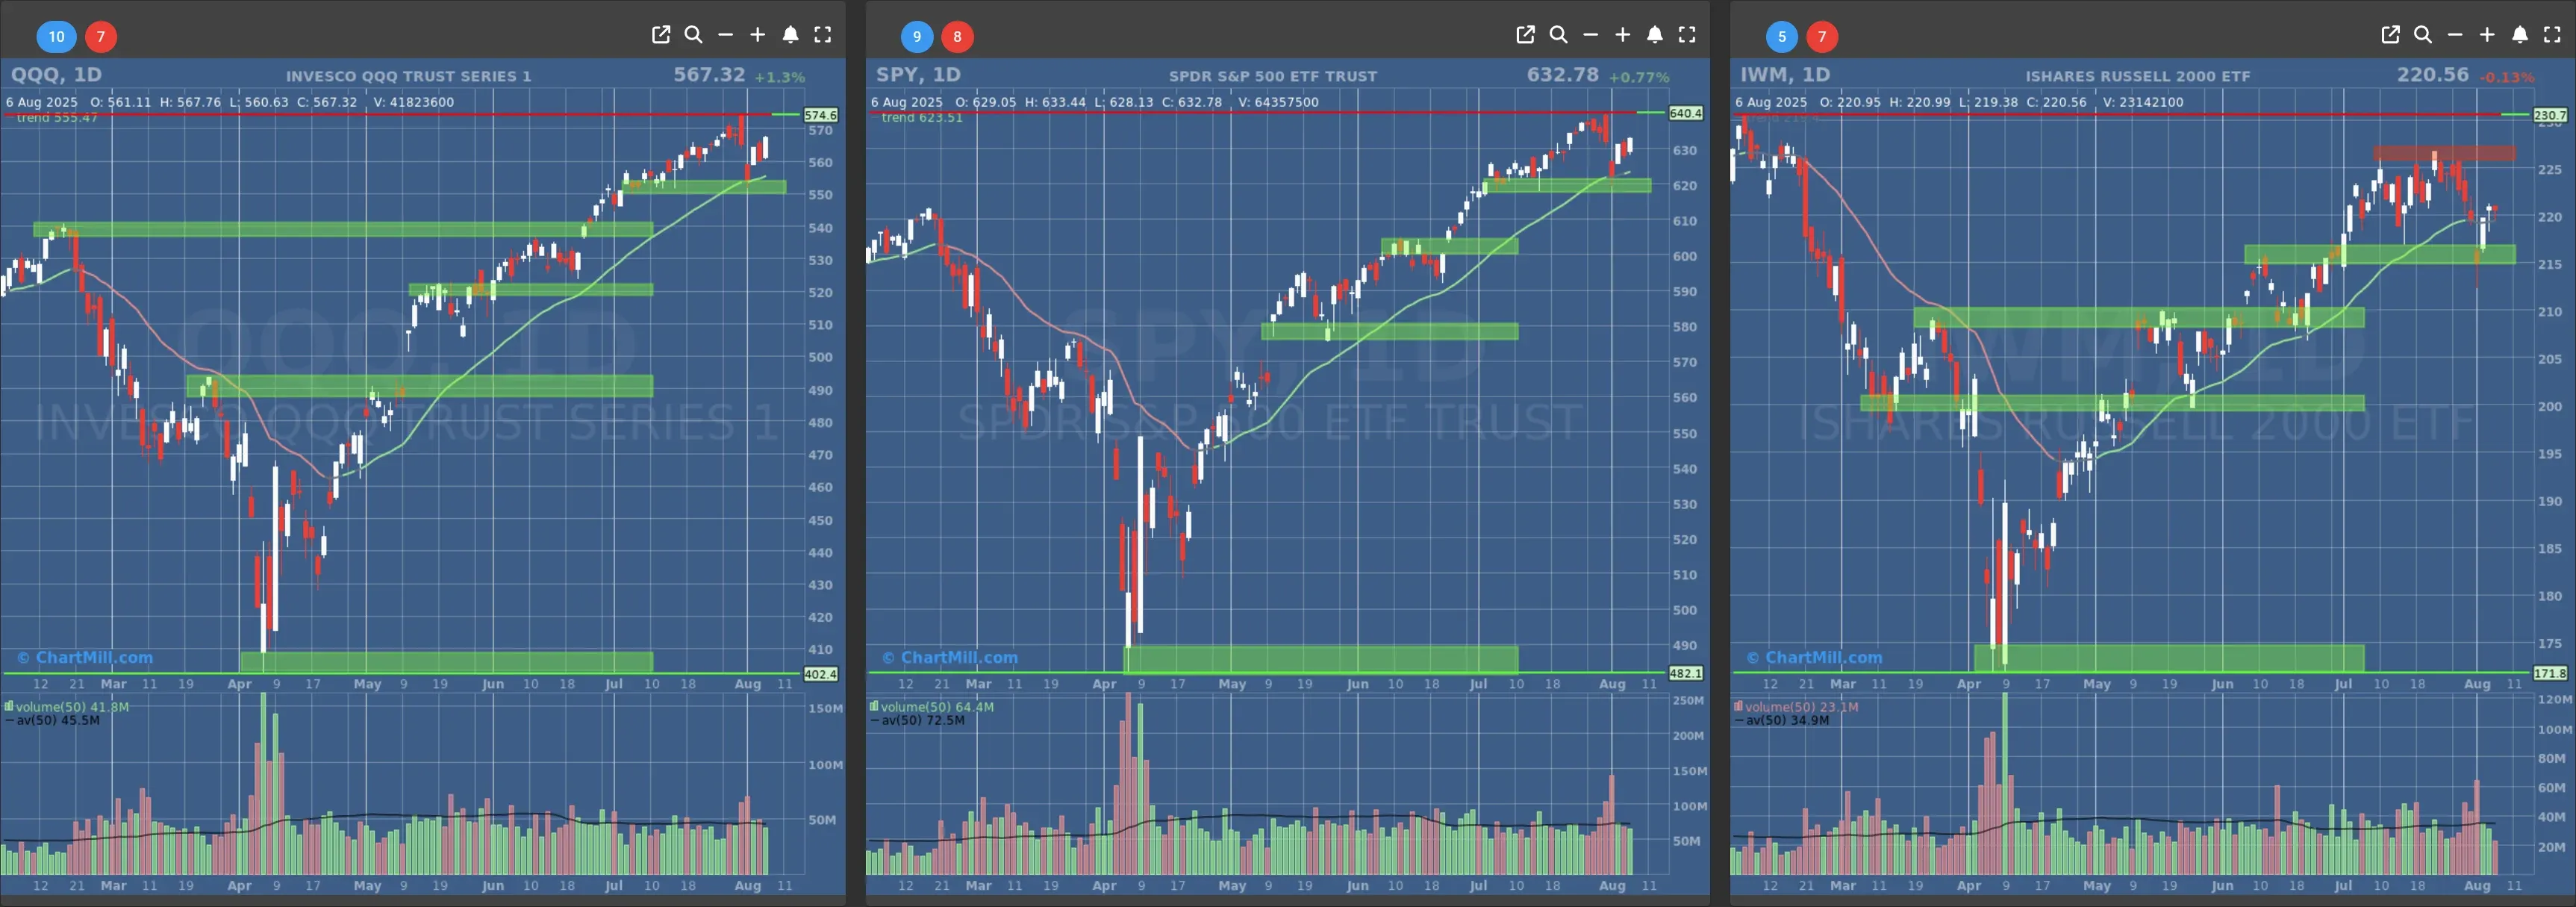
- Short-Term Trend: Bullish (from neutral)
- Next Support at $620 - $600
- Next Resistance at $640
- Volume: At Average (50)
- Pattern: Up Day - searching new all time high
- Short-Term Trend: Bullish (no change)
- Next Support at $550 - $540
- Next Resistance at $575
- Volume: At Average (50)
- Pattern: Up Day -
- Short-Term Trend: Neutral (no change)
- Next Support at $220 - $215
- Next Resistance at $226
- Volume: Below Average (50)
- Pattern: Down Day - Second Hanging Man Candle
Long Term Trend
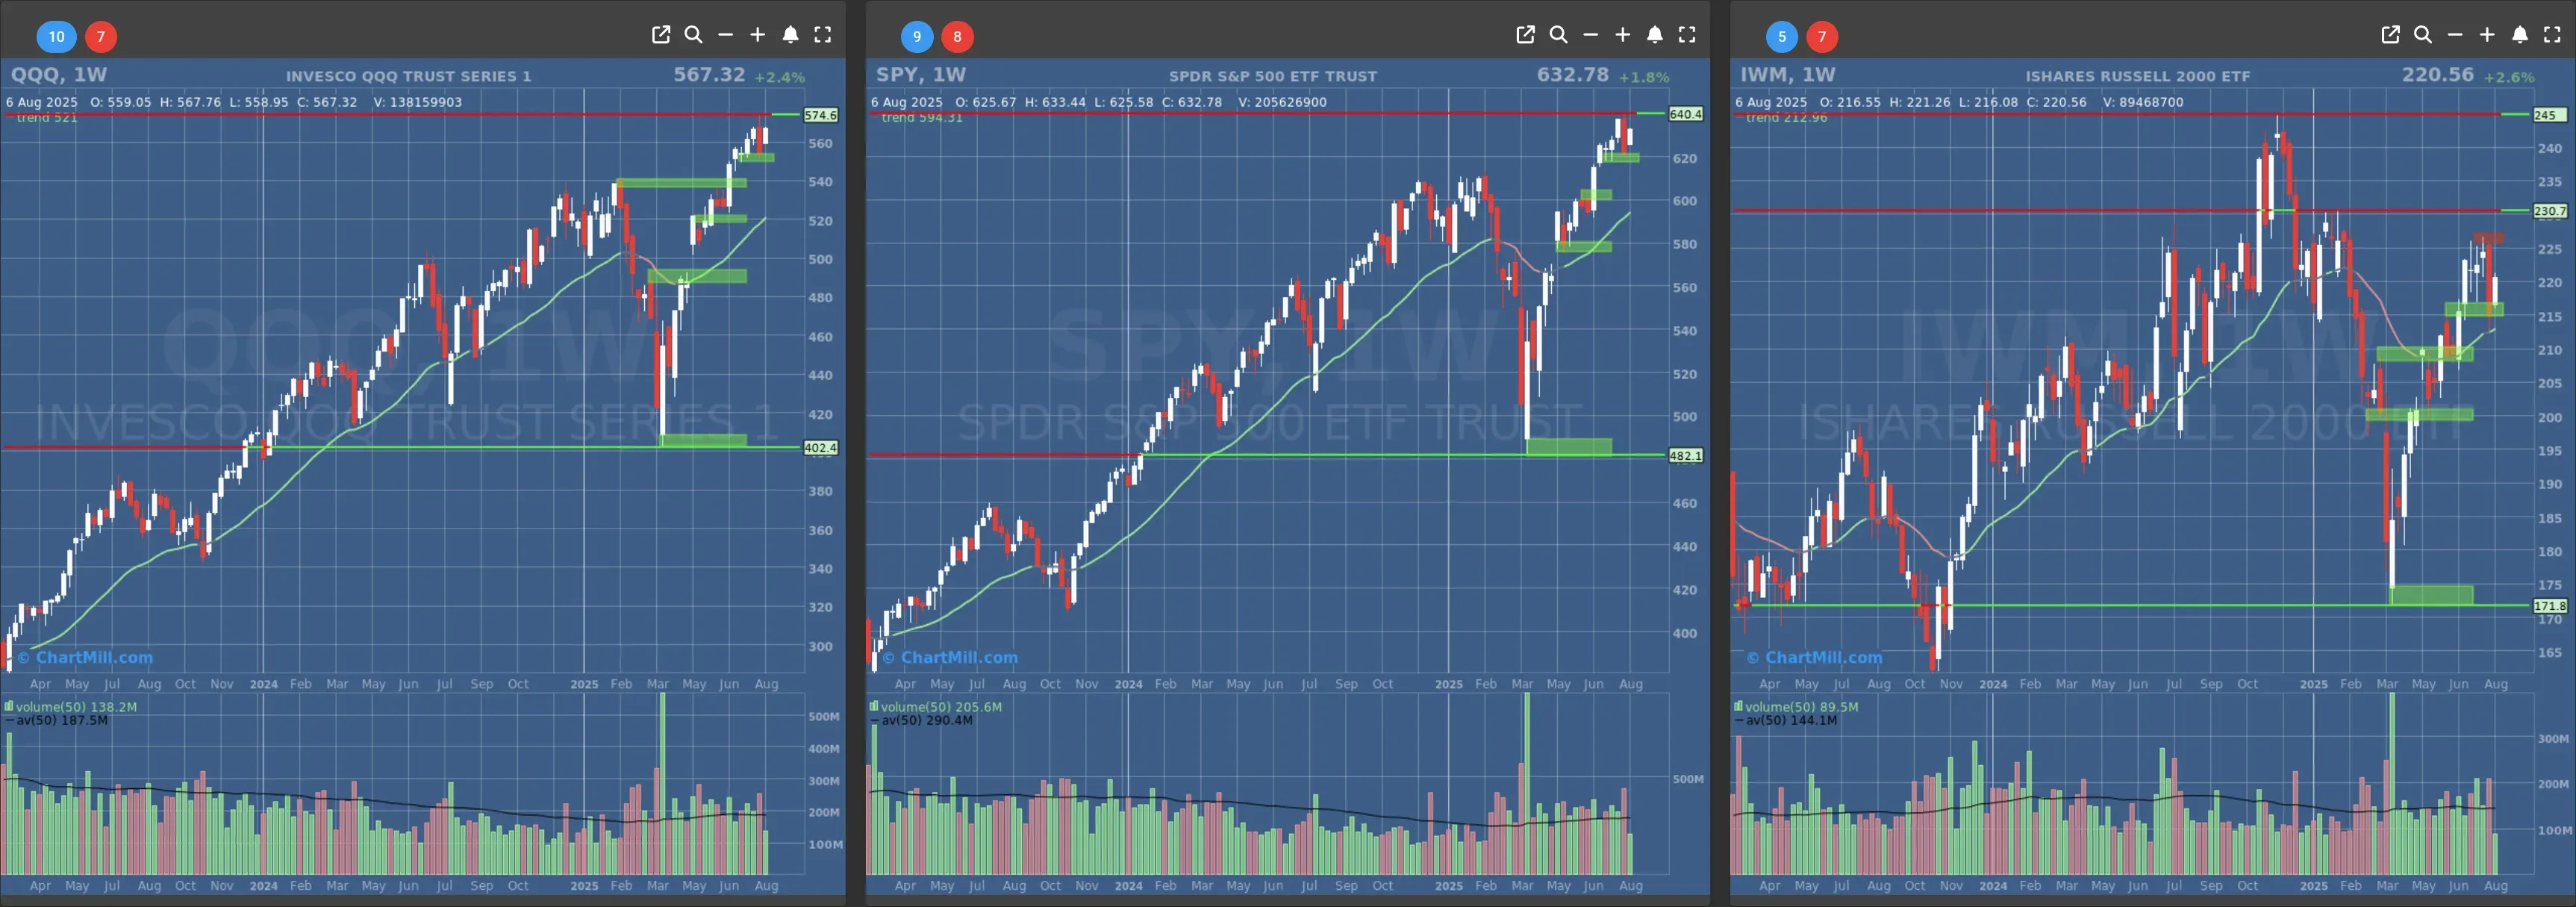
- Long-Term Trend: Positive (no change)
- Long-Term Trend: Positive (no change)
- Long-Term Trend: Positive for now (from neutral), waiting for confirmation close (weekly candle)
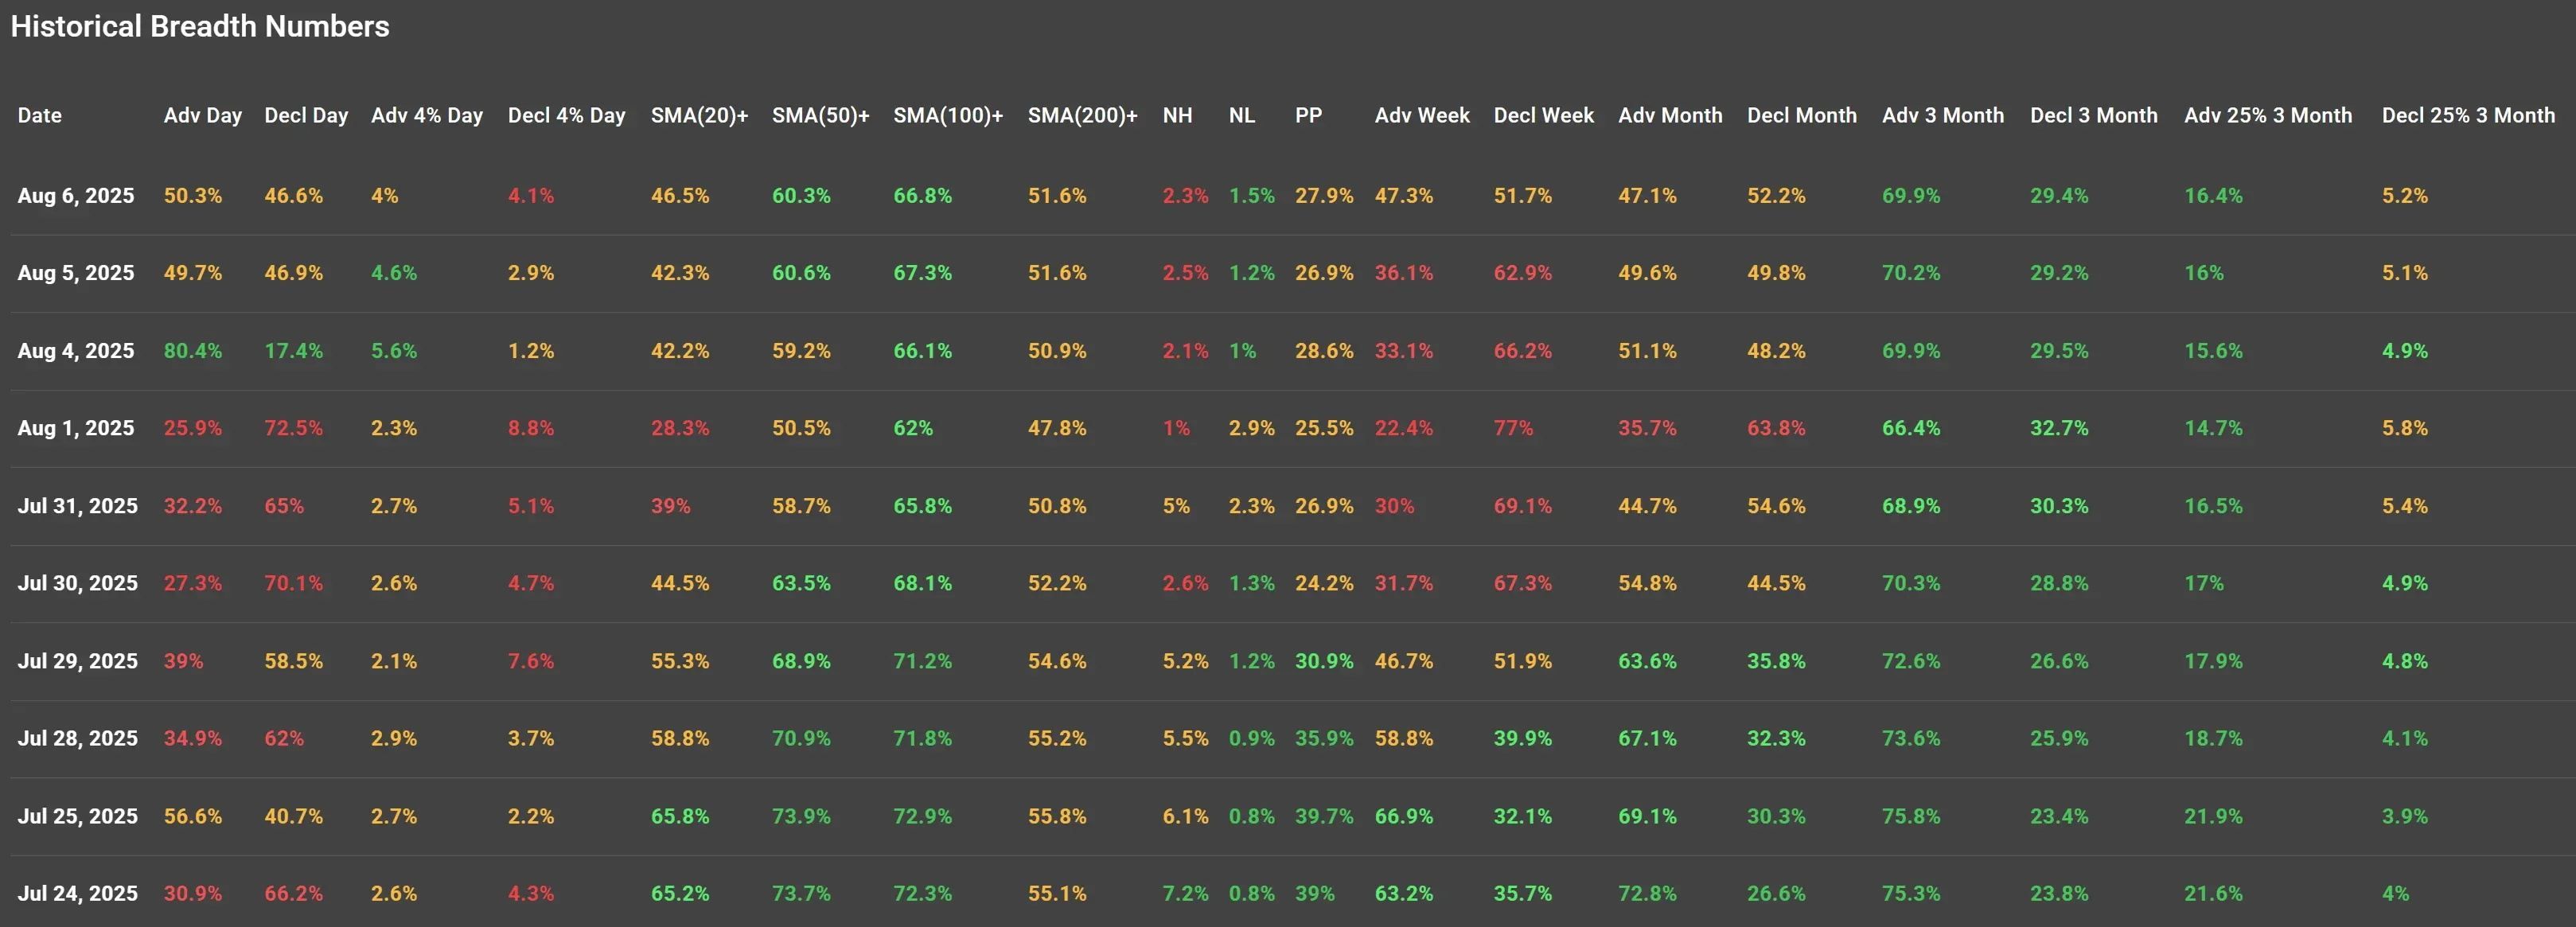
Daily Market Breadth Analysis – August 6, 2025 (After Market Close)
After the impressive breadth surge on Monday (August 4), which was characterized by 80.4% advancers and 5.6% of stocks up more than 4%, Tuesday’s session (August 5) hinted at momentum continuation, while Wednesday (August 6) revealed a pause, not a reversal.
Short-Term Breadth Cooling Off Slightly
The percentage of advancing stocks fell to 50.3% on Aug 6, from 49.7% on Aug 5 and 80.4% on Aug 4.
This shift marks a sharp cooldown from Monday's surge but still keeps the balance tilted slightly toward the bulls.
Advancers gaining >4% dropped to 4.0% (from 4.6% and 5.6%), while decliners >4% ticked higher to 4.1% (from 2.9% and 1.2%). This equalization between strong advancers and decliners introduces some short-term uncertainty.
Moving Averages: Still Supportive
Participation above moving averages remained strong and stable compared to the previous day:
-
SMA(20)+: 46.5% (↑ from 42.3%)
-
SMA(50)+: 60.3% (≈ same)
-
SMA(100)+: 66.8% (↑ slightly)
-
SMA(200)+: 51.6% (unchanged)
These numbers confirm that Monday's thrust helped improve the longer-term trend structure, and this trend is holding steady, at least for now.
New Highs/New Lows and Pocket Pivots
-
New Highs (NH): 2.3%, down slightly from 2.5%, but still above the weaker readings seen in late July.
-
New Lows (NL): 1.5%, rising modestly from 1.2%, but nowhere near concerning levels.
-
Pocket Pivots (PP) — stocks showing a pivot point: 27.9%, almost flat from 26.9% the day before.
Intermediate and Longer-Term Indicators
-
Adv Week: 47.3% (improving gradually, from 36.1%)
-
Decl Week: 51.7% (falling from 62.9%)
→ This shows broad participation improving over a 5-day horizon.
-
Adv Month: 47.1% (slightly down)
-
Decl Month: 52.2% (up slightly)
-
Adv 3 Month: 69.9% (down slightly but still strong)
-
Decl 3 Month: 29.4% (little change)
Despite the one-day pause in acceleration, the intermediate breadth trend is improving, helped by Monday's strong rebound.
Breadth Strength in Winners vs Losers
-
Adv 25% 3 Month: 16.4%, a modest uptick (from 16% on Aug 5)
-
Decl 25% 3 Month: 5.2%, slightly higher but within a stable range
This still leans positively and supports the idea that more stocks are delivering significant gains over a 3-month horizon than those suffering large losses.
Comparison to Previous Observations
The August 4 rally was a critical thrust event, and as mentioned in our previous analysis, the real test would be if the strength could follow through.
-
August 5 suggested continuation (with more than 60% above SMA50 and SMA100, and declining 4%+ losers).
-
August 6 showed a pause, not a collapse, with strong breadth levels holding, and no dramatic deterioration.
Market sentiment was likely influenced by strong earnings results and better-than-expected economic data released in recent days (as priced in before the close of each trading day), helping drive the August 4 surge and stabilize momentum thereafter.
Breadth Trend Rating: 4 – Positive
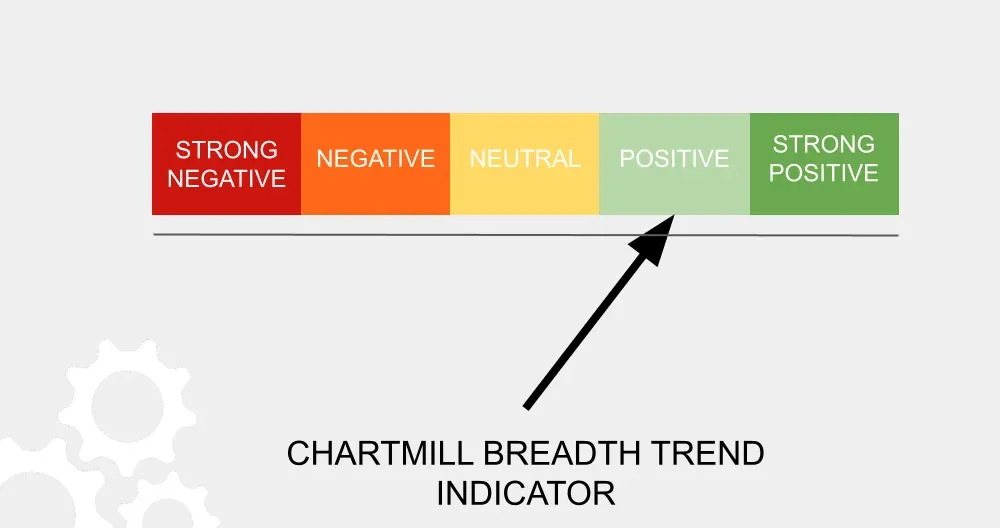
While August 6 didn’t build upon Monday’s forceful rally, it also didn’t reject it. Breadth remains resilient, with key longer-term metrics (50/100/200 MA participation and 3-month advances) supporting a positive trend.
A continuation of improving weekly breadth and stability above key moving averages would confirm a trend reversal from the late-July weakness.
Kristoff - ChartMill
Next to read: Market Monitor News, August 7