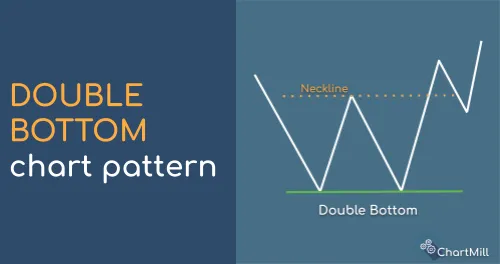
Double Bottom
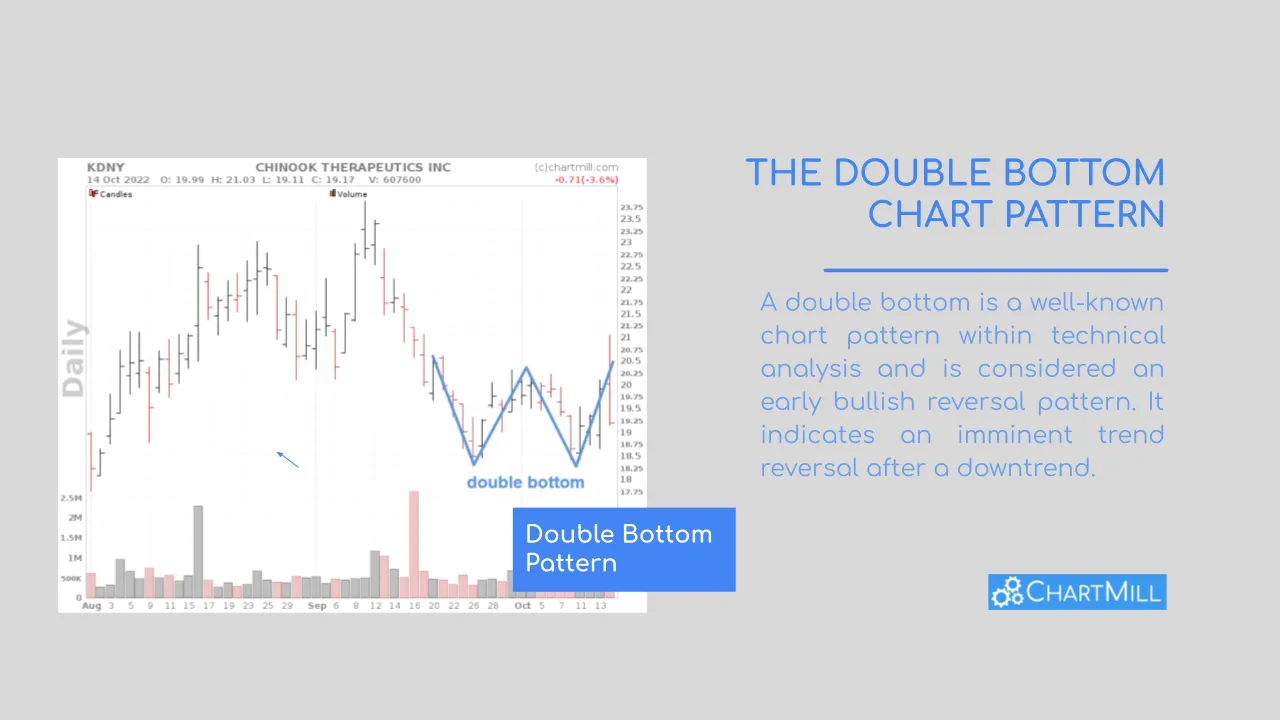
A double bottom is a well-known chart pattern within technical analysis and is considered an early bullish reversal pattern. It indicates an imminent trend reversal after a downtrend.
The formation of two bottoms at the same level, with a price recovery in between, creates the typical W-shape characteristic of double bottoms.
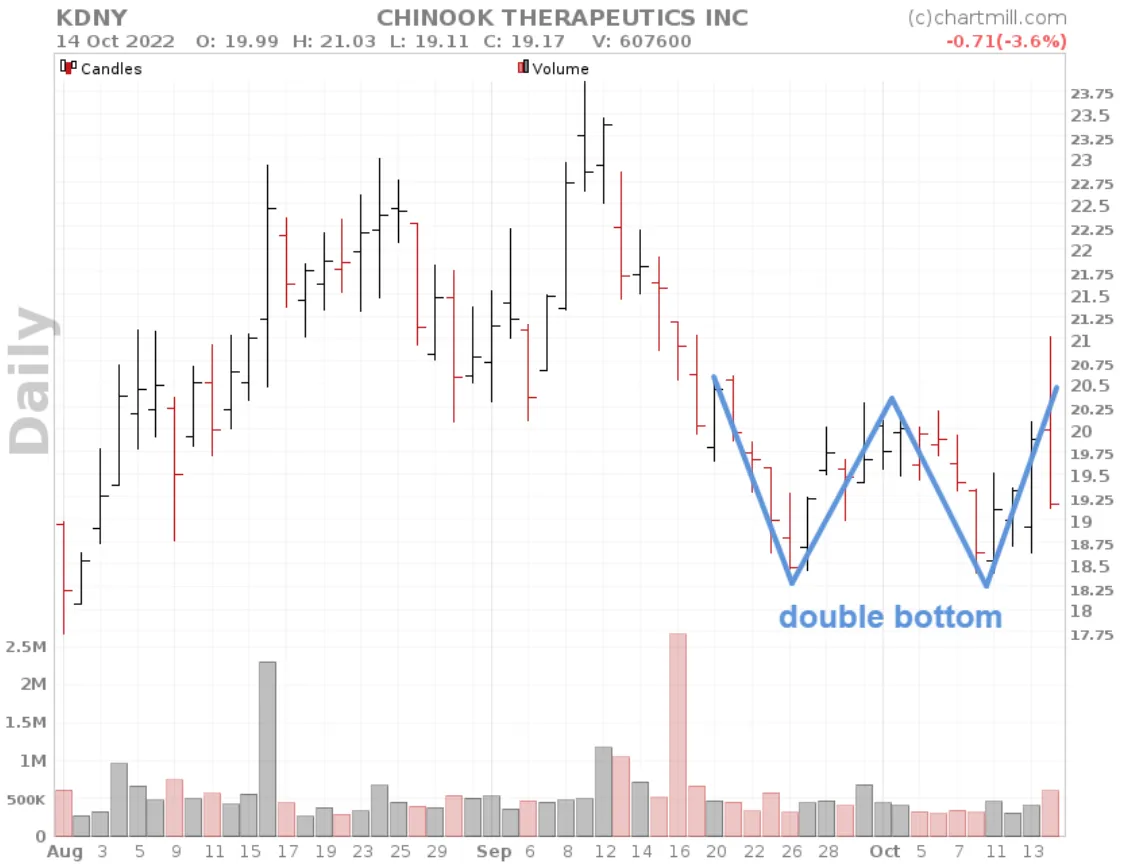
The price recovery between the two bottoms should be clearly visually recognizable but the recovery should not be too pronounced. The intermediate top creates a fairly narrow sideways mini-trend channel.
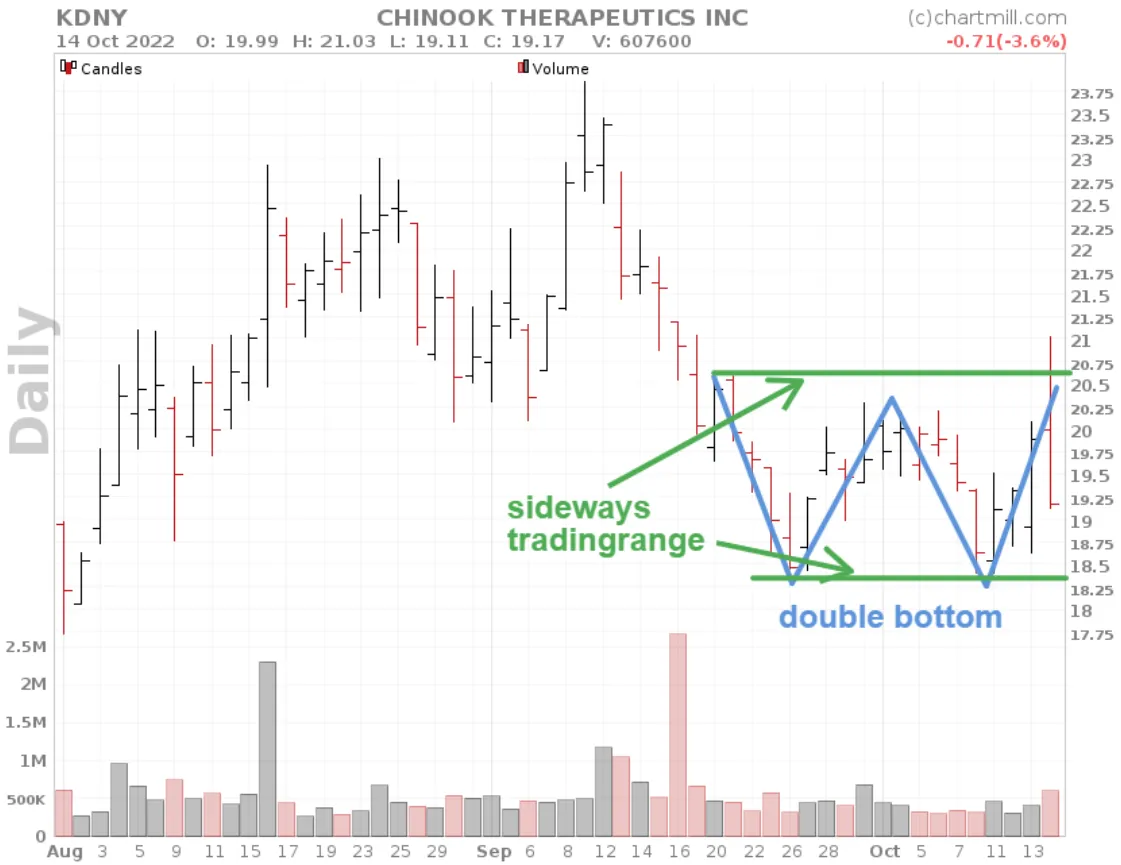
In a normal downtrend, the second bottom would be a lot lower than the first creating a new lower low. However, the fact that a second bottom is formed at the same level indicates that the current trend is losing momentum.
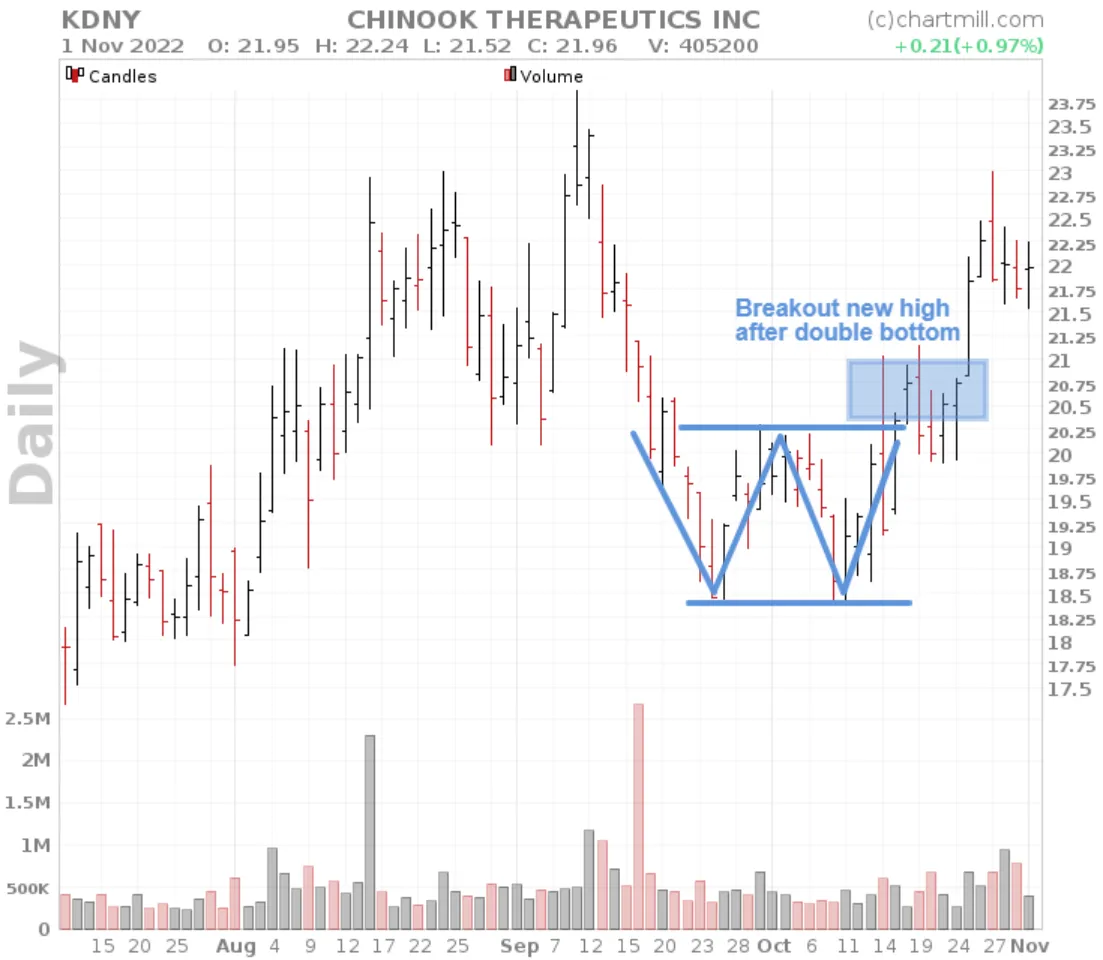
Double price bottoms are early warning signals but are not enough in themselves to assume a real trend reversal. This requires additional confirmation in the form of a price moving higher than the top between the two bottoms. As soon as that happens, the trading range in which the double bottom is formed is broken upwards and consequently a first higher high is formed.
How to use the double bottom pattern when trading?
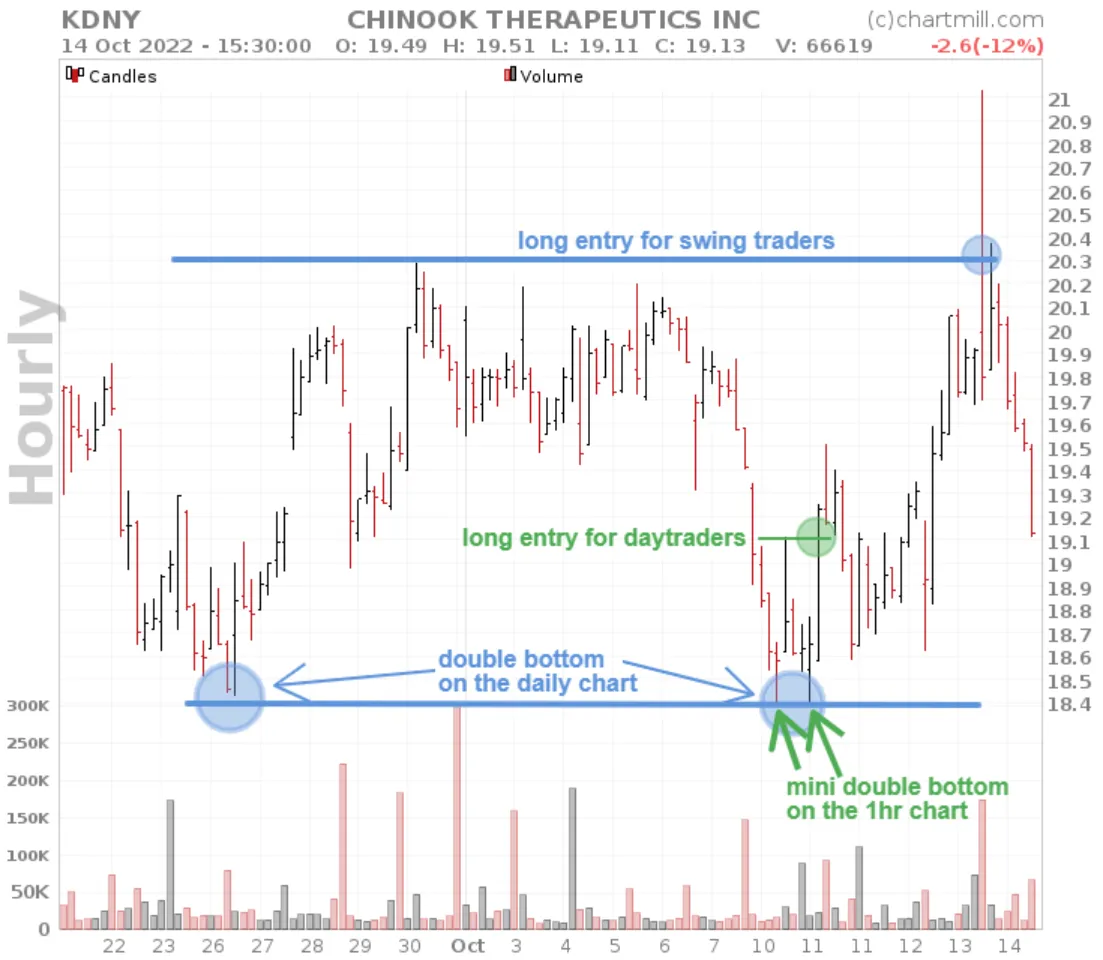
Swing traders who hold positions overnight should wait until the double bottom is confirmed, which is at the moment a new higher high was formed after the double bottom.
Those trading intraday will want to react faster and open a position as soon as the double bottom is visible on an intraday timeframe. Take a look at the 1hr timeframe of the same stock where an extra mini double bottom was formed. An ideal entrypoint for intraday traders. In this case the intermediate top between the two bottoms can be used as the first price target.
Double bottom price target
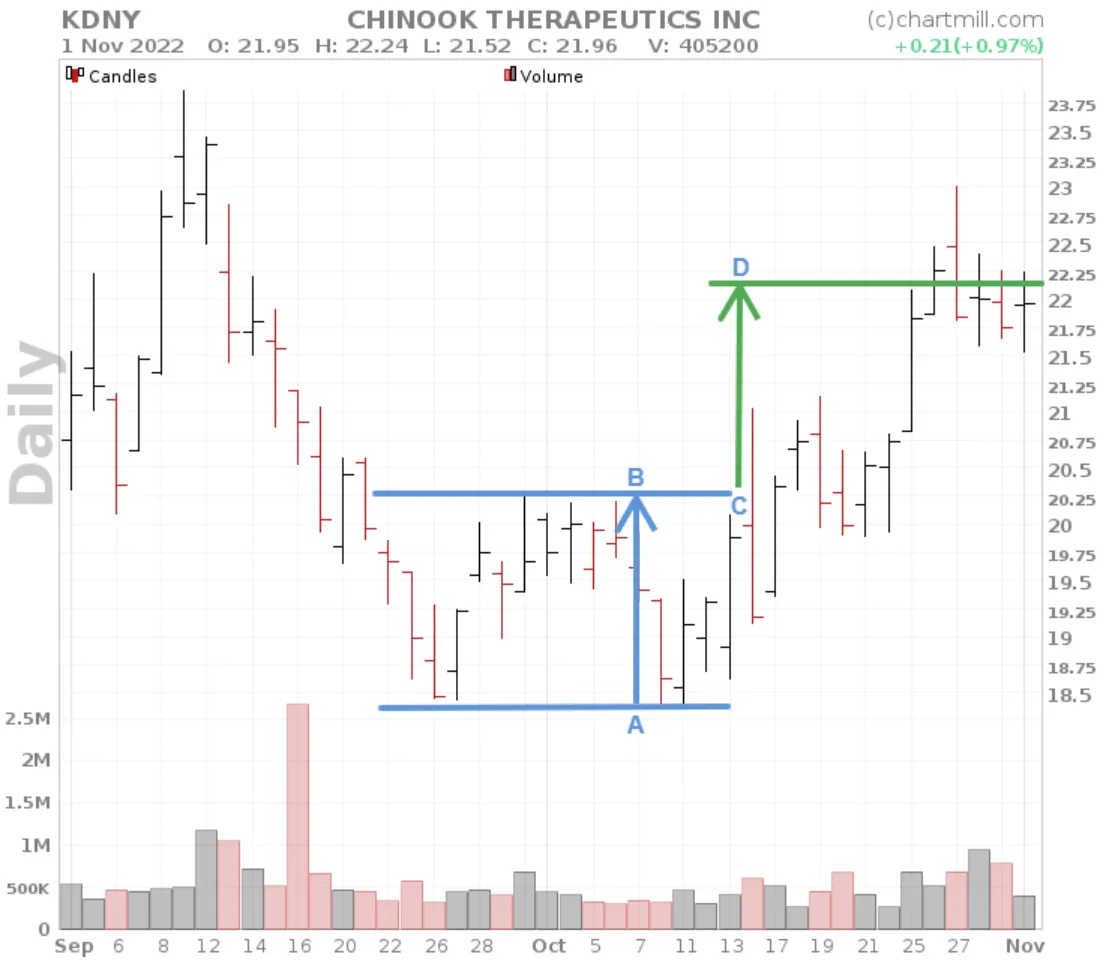
For those going long immediately after the double bottom, the interim top on the daily chart after the first and before the second bottoms applies as the first price target (as showed in the previous chart on the hourly timeframe).
Those taking a long position after the interim high on the daily chart is broken can maintain the distance between the bottom and the highest price of the double bottom pattern as the first price target. However, any pre-existing resistance levels should be taken into account.
Double bottom stoploss
Since a double bottom represents a strong support level, it makes sense to place the stoploss just below the double bottom. As soon as the price closes below the double bottom the formation is considered invalid and you should liquidate your long positions to avoid larger losses. If the price eventually does recover you can always re-enter.
Points to remember
- When a double bottom forms after a negative price trend at the level of pre-existing significant historical support levels, the double bottom pattern becomes a lot more reliable.
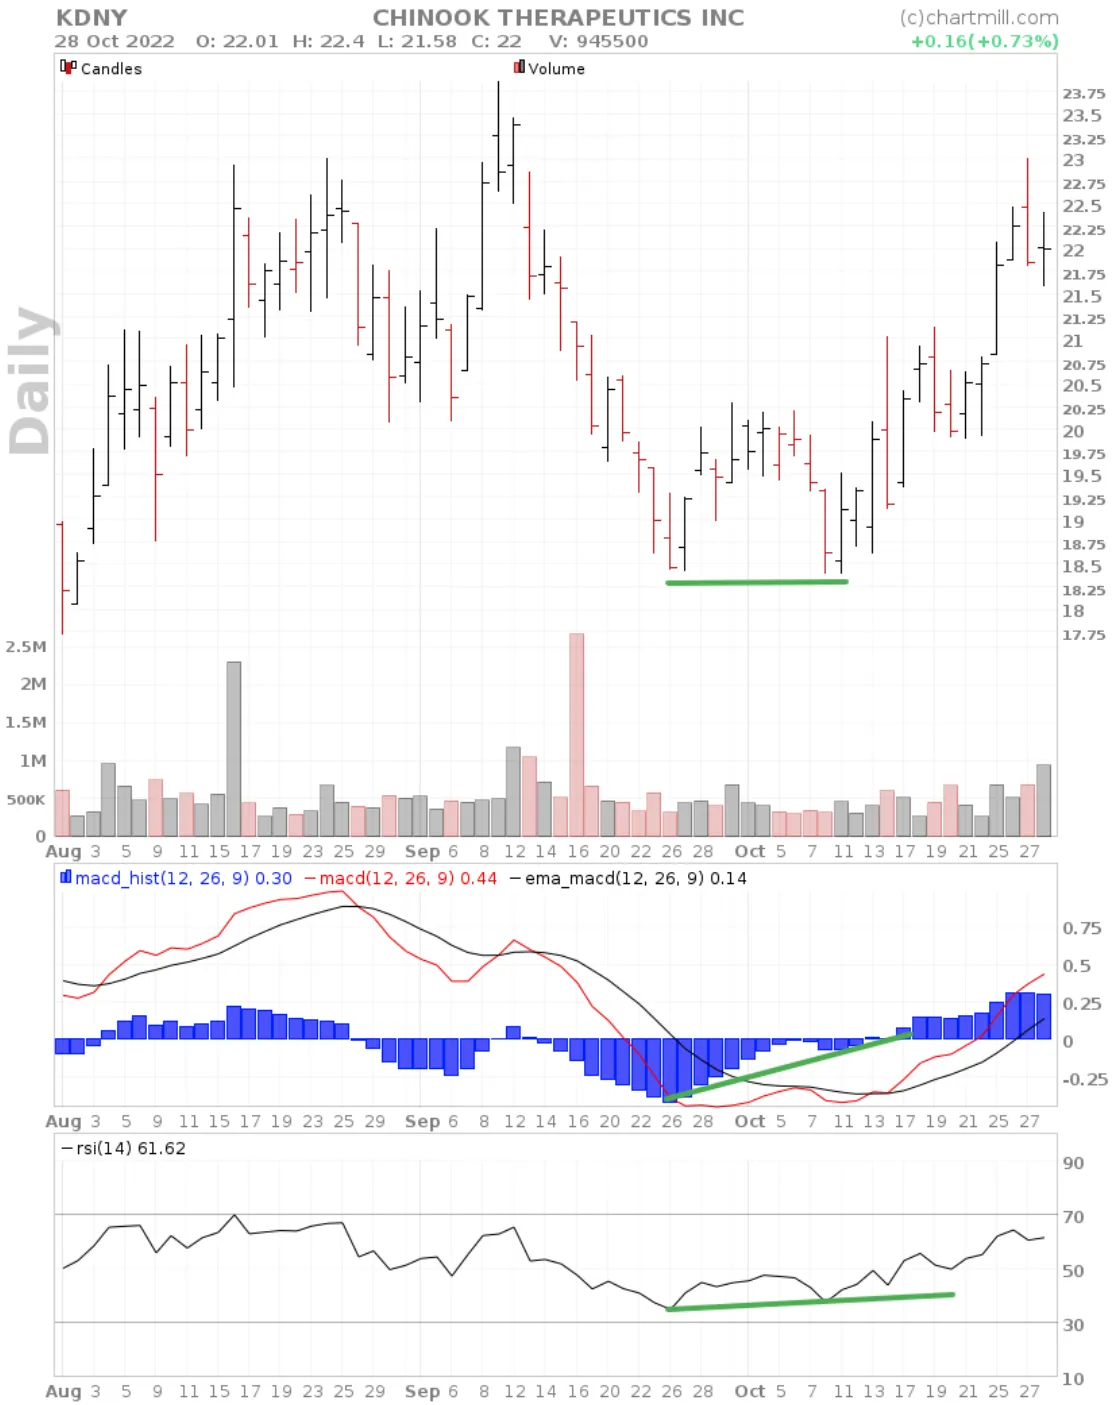
- Also keep an eye on the volume when the double bottom forms. In particular, selling volume at the time of the intermediate decline and during the formation of the second bottom should remain relatively low.
- Be attentive to any divergence signals with specific technical indicators. In this example, both the RSI and MACD show higher bottoms while the price bottom itself occurs at the same level. This means that the bearish momentum is clearly losing strength.