Bear Flags (and pennants) | Definition
Flags and Pennants are powerful chart patterns in technical analysis. They are called 'continuation patterns' as the flag embeds prices that are consolidating in a range after a strong move up or down. Price is expected to continue in the direction of the prior move once it breaks out of the flag pattern.
Chartmill supports finding stocks that show a bear flag or technical bear pennant pattern. The bear flag can also be drawn on a chart by adding the 'Chartmill Flag' overlay indicator.
The Bear Flag Chart Pattern?
Bear Flag and Bear Pennant
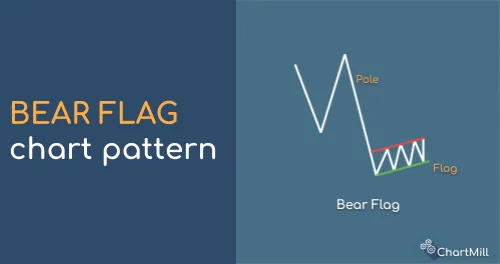
A bear flag is a technical continuation pattern which can be observed in stocks with strong downtrends. The pattern takes shape when the stock pulls back by going sideways (or by slowly inclining) after an initial big decline in price. When you see the graphical representation of this pattern, you’ll notice that it somehow looks like a flag on a pole.
The pattern consists of two important parts:
- RUN DOWN - In the first stage, sellers aggressively step in the market, driving prices lower. These sellers then attract other sellers, creating a real selling frenzy (also called momentum).
- CONSOLIDATION - After a while price settles down. This happens because less and less sellers are willing to sell shares at this point (the major sell of is looking too extended). Buyers also begin to come into the market because they don’t want to give up the made gains. When all of this happens, the stock will go into consolidation. It will remain in this phase until (new) buyers or sellers enter the market and disrupt once again this equilibrium.
How to spot decent bear flags?
Not every bear flag which rolls out of our scanners is a good bear flag. When visually eye-balling bear flag charts you definitely want to check if:
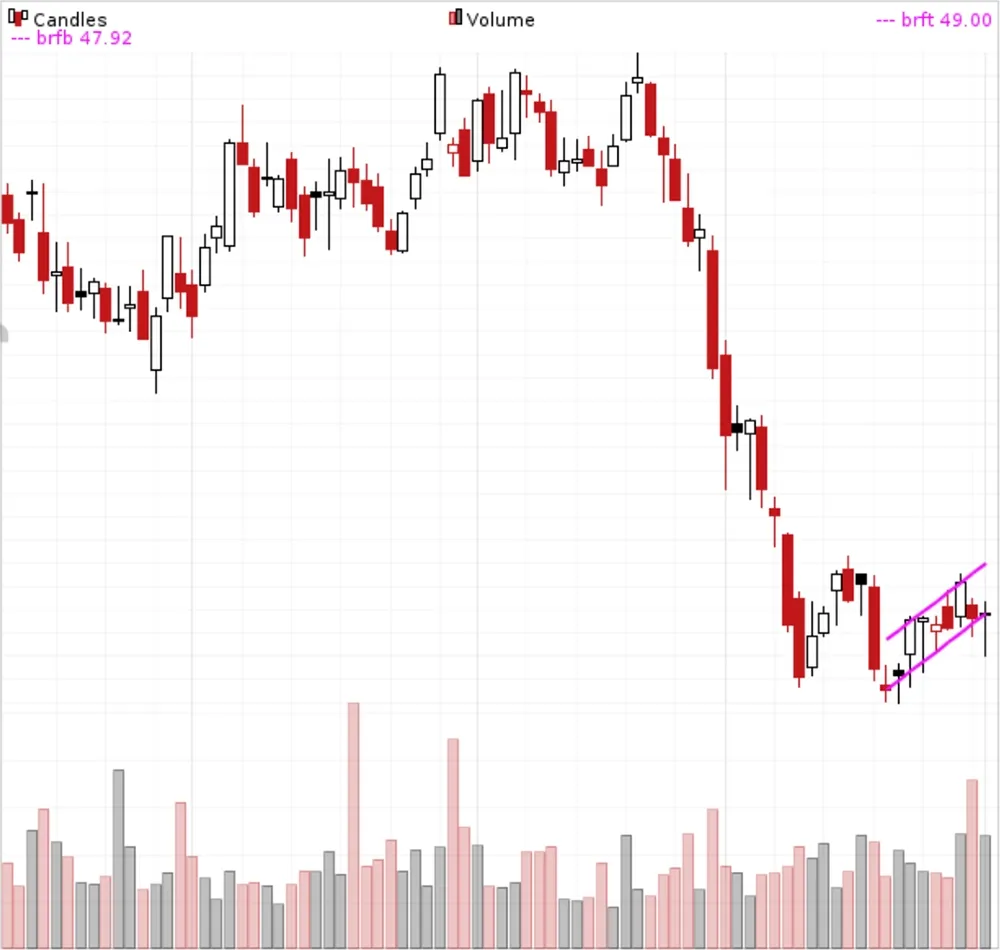
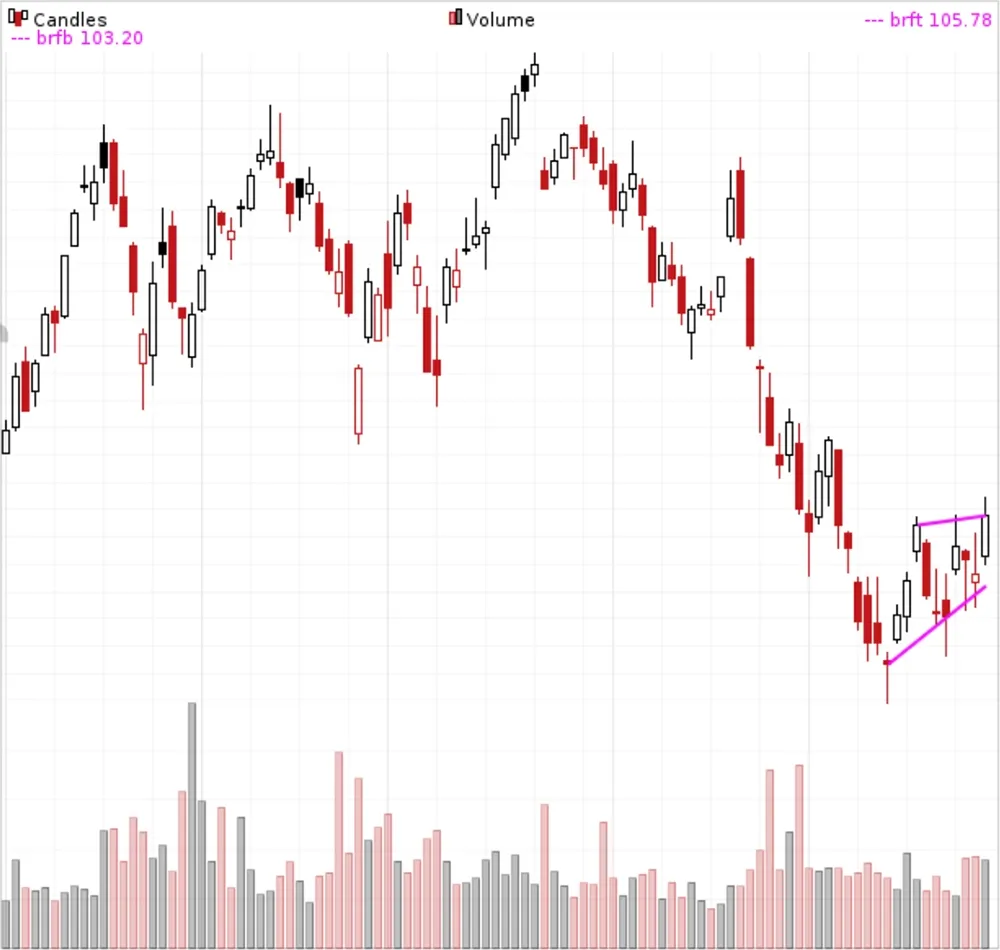
- The run-down before the flag was a clear, fast and huge move with big volume. By a clear move we mean a price run-down that mainly closes near its low each day. We want to spot clear conviction among the sellers. So don’t select stocks that are jumping around and are meeting support every five seconds!
- The flag itself is orderly. We don’t want to see crazy price swings. Go for compact, linear patterns that go sideways (or slightly up) in a calm way. We don’t want to see huge buying in the flag, just some mild profit taking at best. Only select stocks that pull back orderly on low volume. This could mean that buyers aren't in a rush to hit the exit! Be sure to double check the news on the stock. Some stocks don’t show any movement in the flag, suggesting there is something more going on.