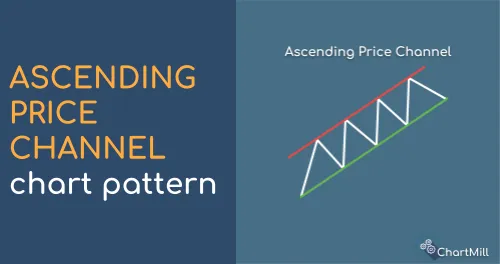
Ascending Price Channel
How to recognize an Ascending Price Channel?
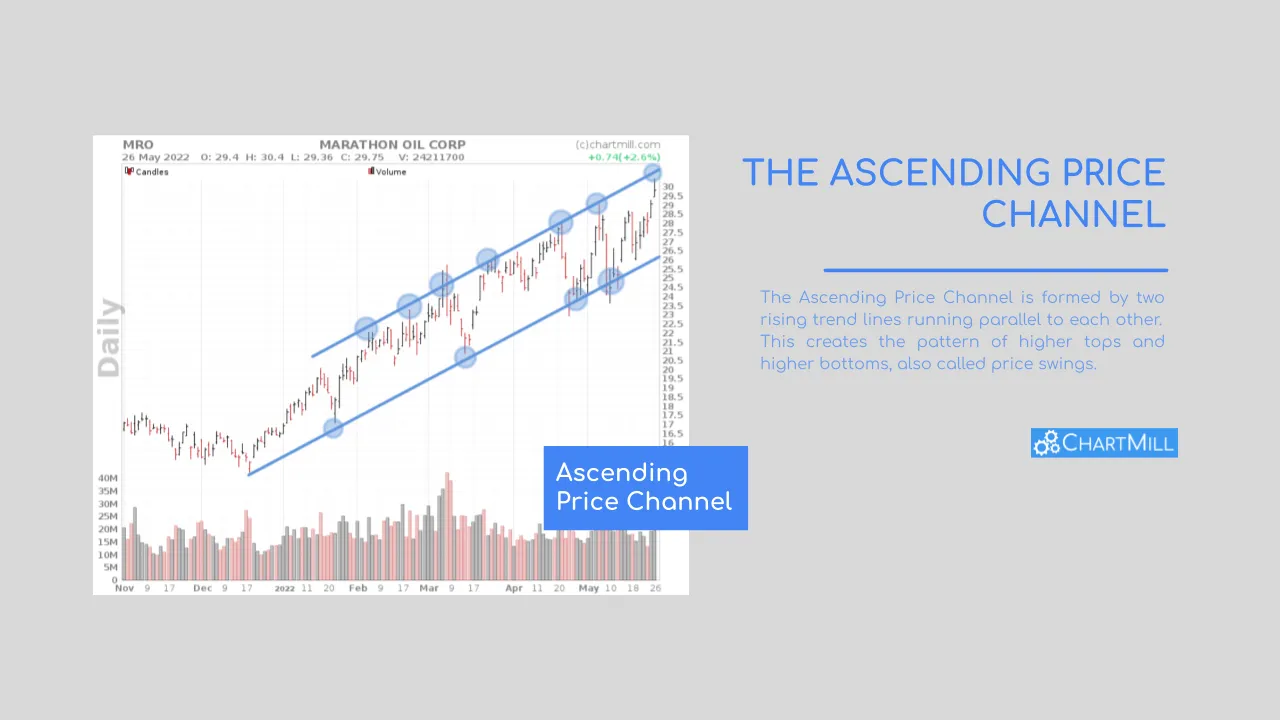
An ascending price channel is easy to recognize. The channel is formed by two rising trend lines running parallel to each other. This creates the pattern of higher tops and higher bottoms, also called price swings.
By connecting these higher tops and bottoms you can recognize the rising trend channel within which the price moves. When both trend lines are extrapolated further, specific price levels emerge where there may be support or resistance.
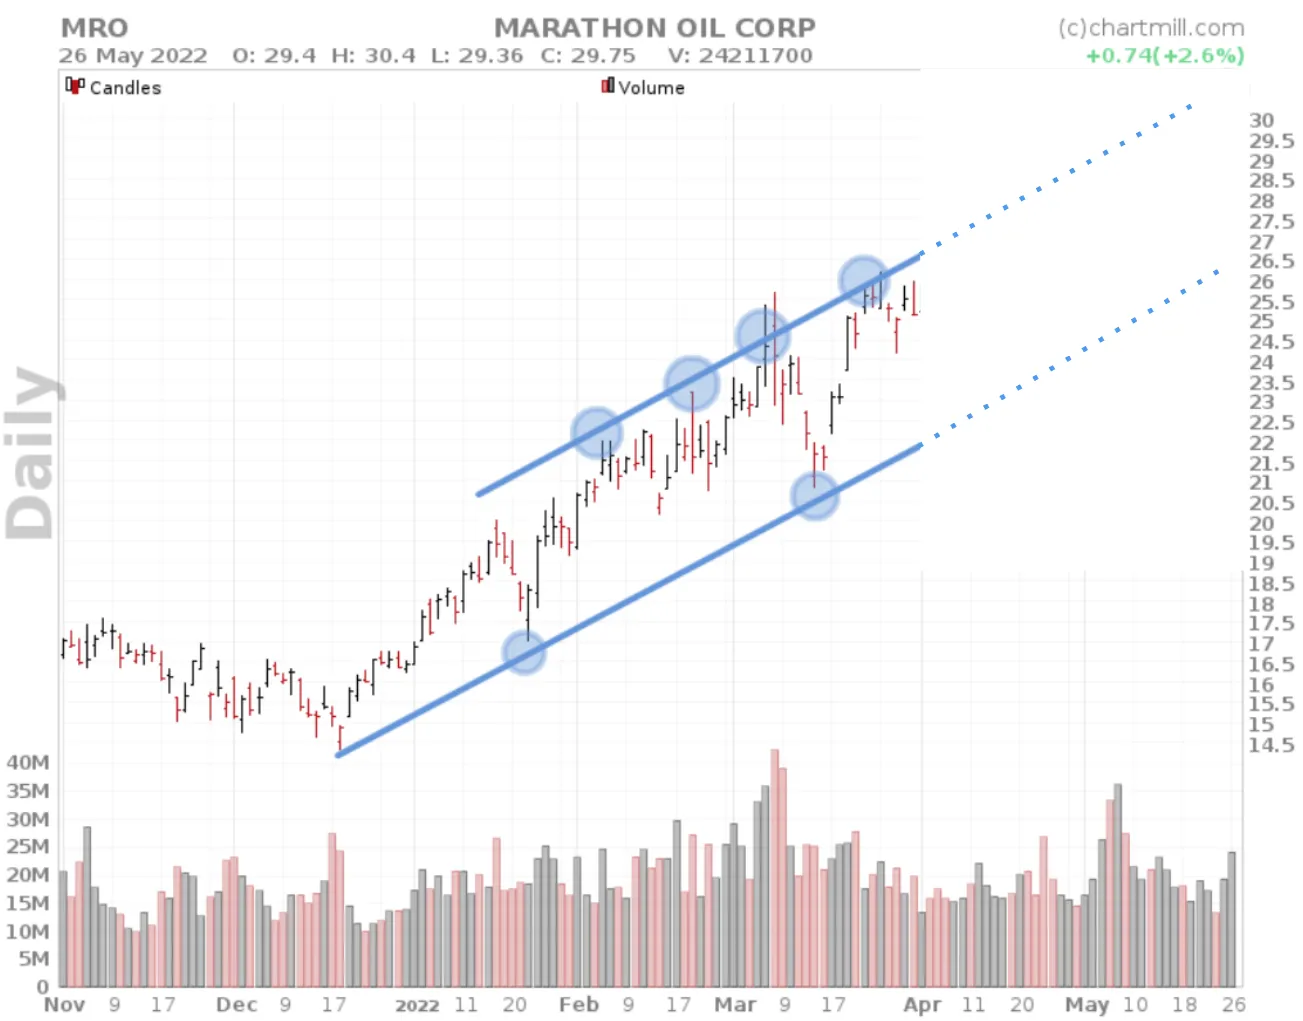
As soon as the lower trend line is hit, technical buyers will react and buy the stock, assuming that the price will rise again to stay within the existing channel. This strategy is known as "buying the pullback”.
If the top of the trend channel is touched you will typically see more sell orders. These are, on the one hand, buyers who (partially) secure their profits and, on the other hand, sellers who speculate on a price reversal and open a short position at this level.
As long as the price continues to move within the channel, the trend is positive and it is assumed that the price will continue to rise.
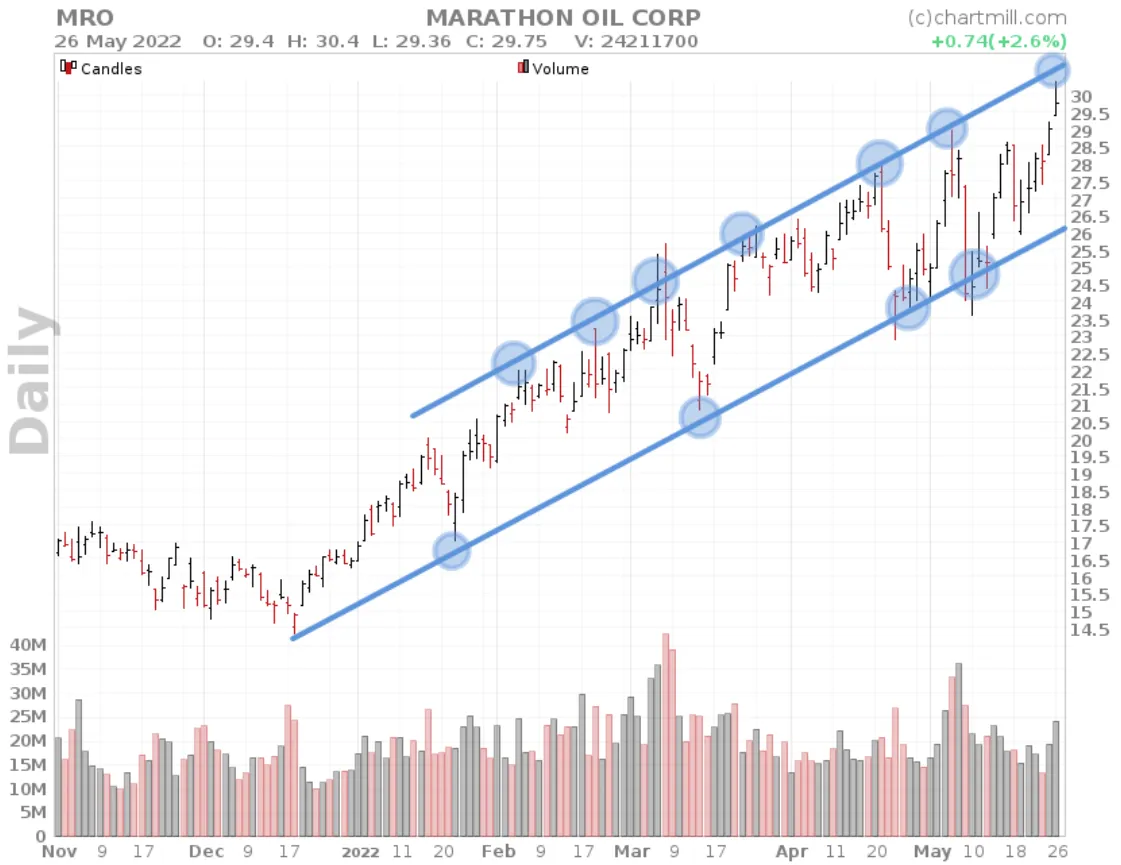
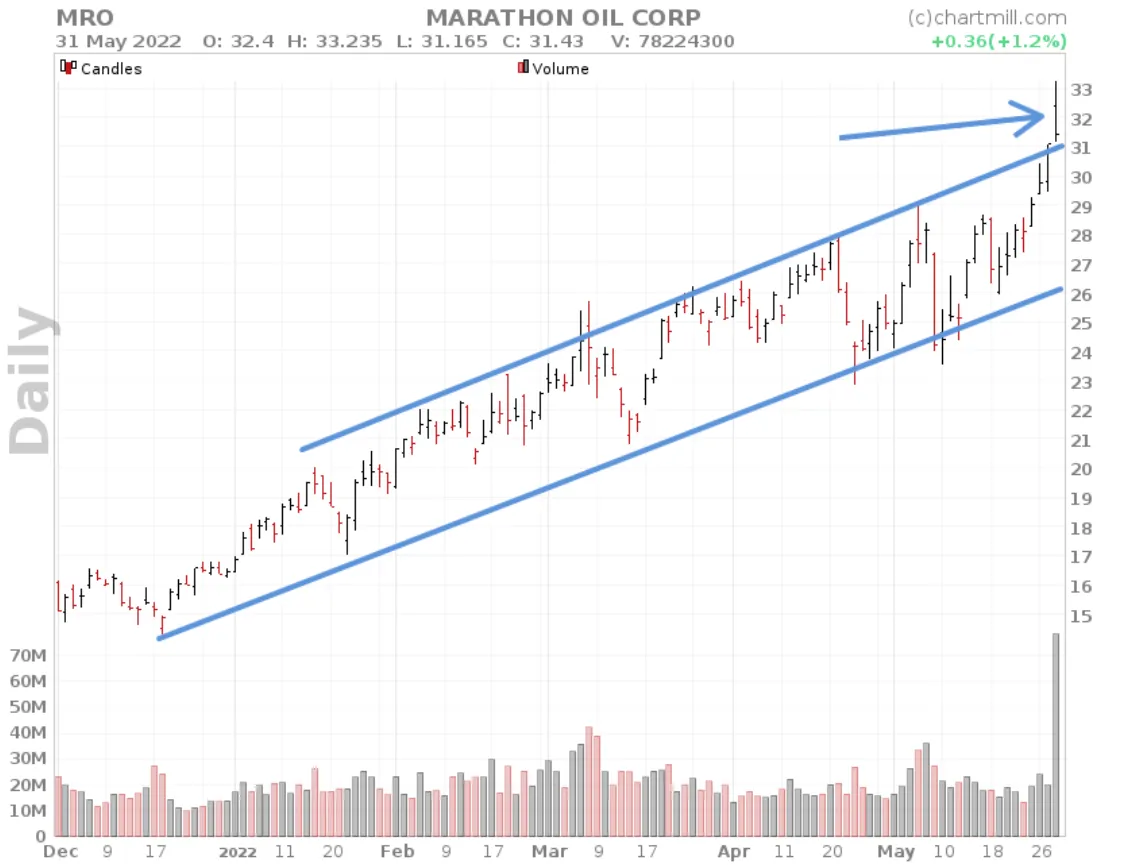
If the stock suddenly rises sharply through the upper trend channel, this indicates extremely high momentum whereby the existing trend is accelerating. Keep in mind that such a movement is largely sentiment-driven. Especially when it appears that this price acceleration causes the price to deviate far from the average price, it is advisable not to simply go long and chase the price. After all, there is a good chance that the price will return to a more normal price setting.
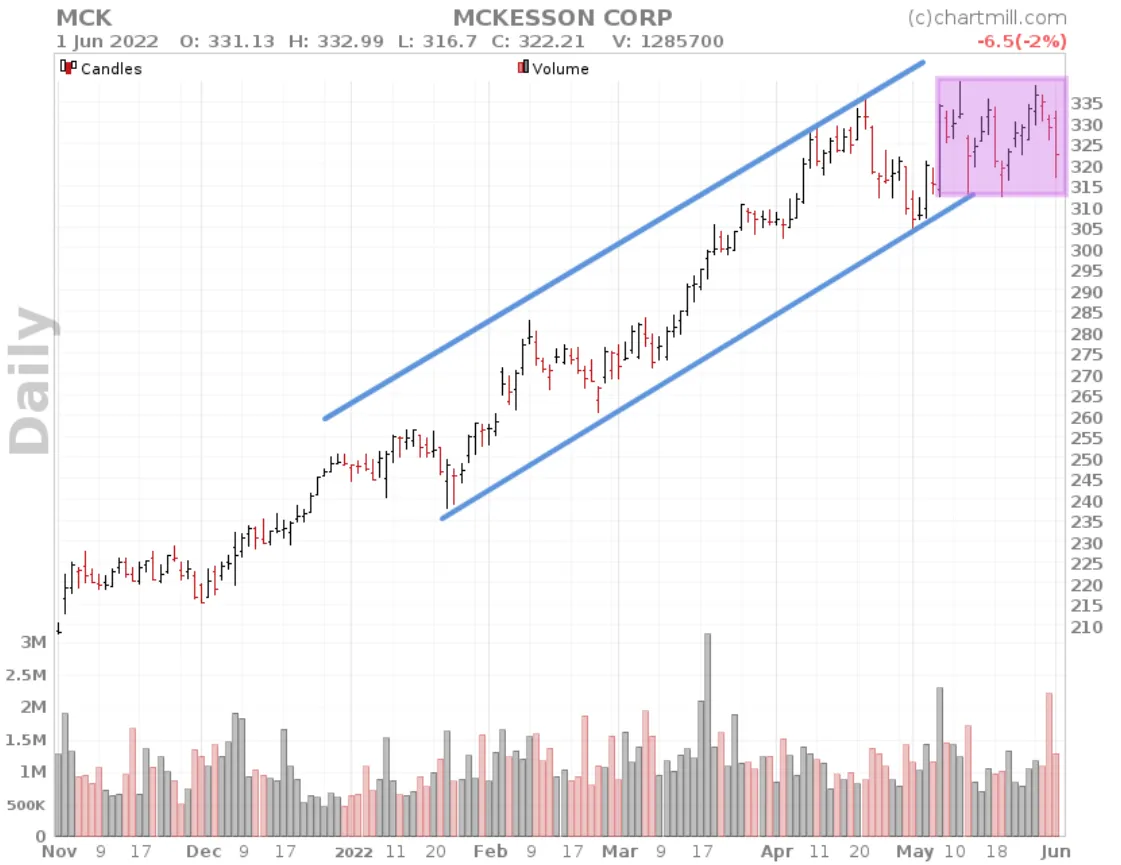
Once the price stabilizes somewhat and no more higher tops are formed, you will recognize a rather sideways pattern with double or even triple bottoms.
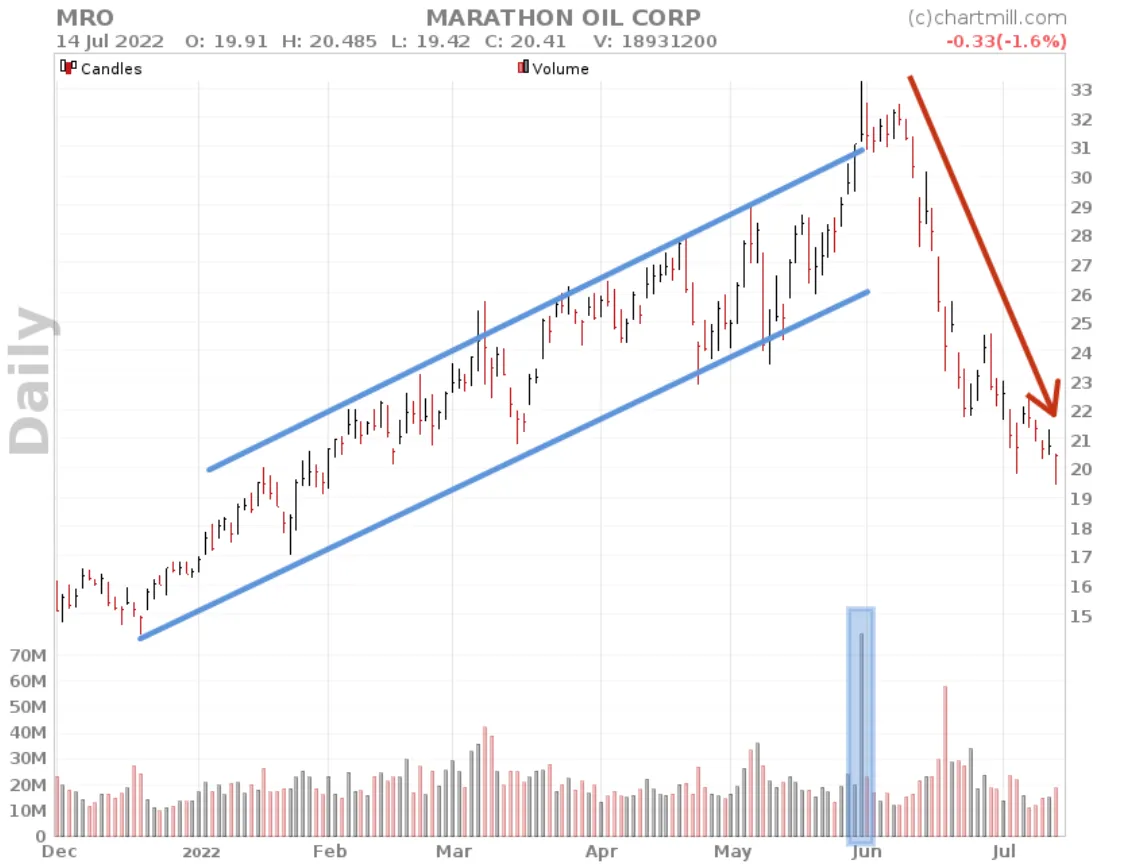
If the price then breaks out on the upside, you can speculate on a continuation of the existing bullish trend. However, a downward breakout indicates predominantly negative sentiment with the trend possibly reversing from positive to negative.
A clear close below this lower ascending trend line can also lure shorters into the market who suspect that the current bullish trend has been broken and consider the break of the lower trend line as a price reversal indication.

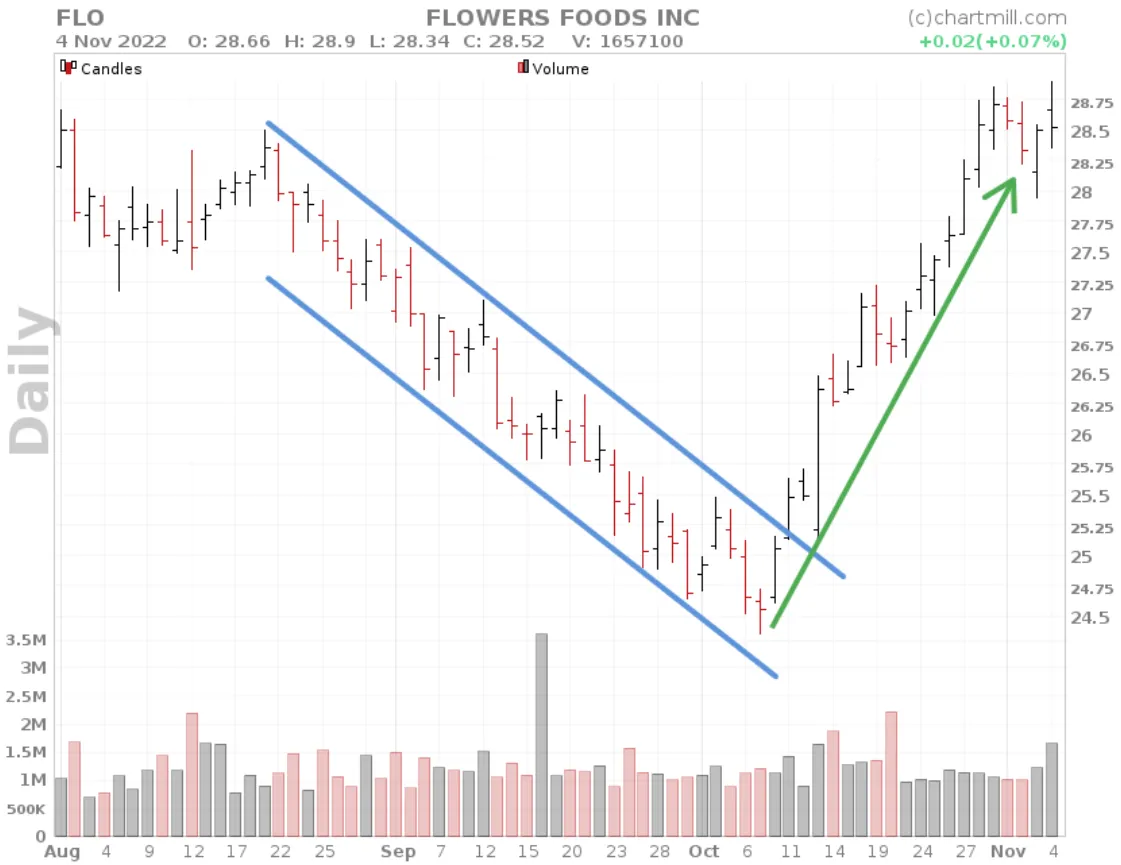
In extreme cases you can be confronted with a very aggressive trend reversal where for example a clear negative trend turns into an extremely positive price movement in no time. This phenomenon is known as the V-shape reversal, more specifically the V-bottom.
Ascending Price Channel, the Pull Back Strategy
The pull back strategy involves going long as soon as the price has tested the lower ascending trendline and a reversal pattern emerges which suggests that the price will move back to the top of the trend channel.
The advantage of this strategy is that the stoploss can be kept very short.
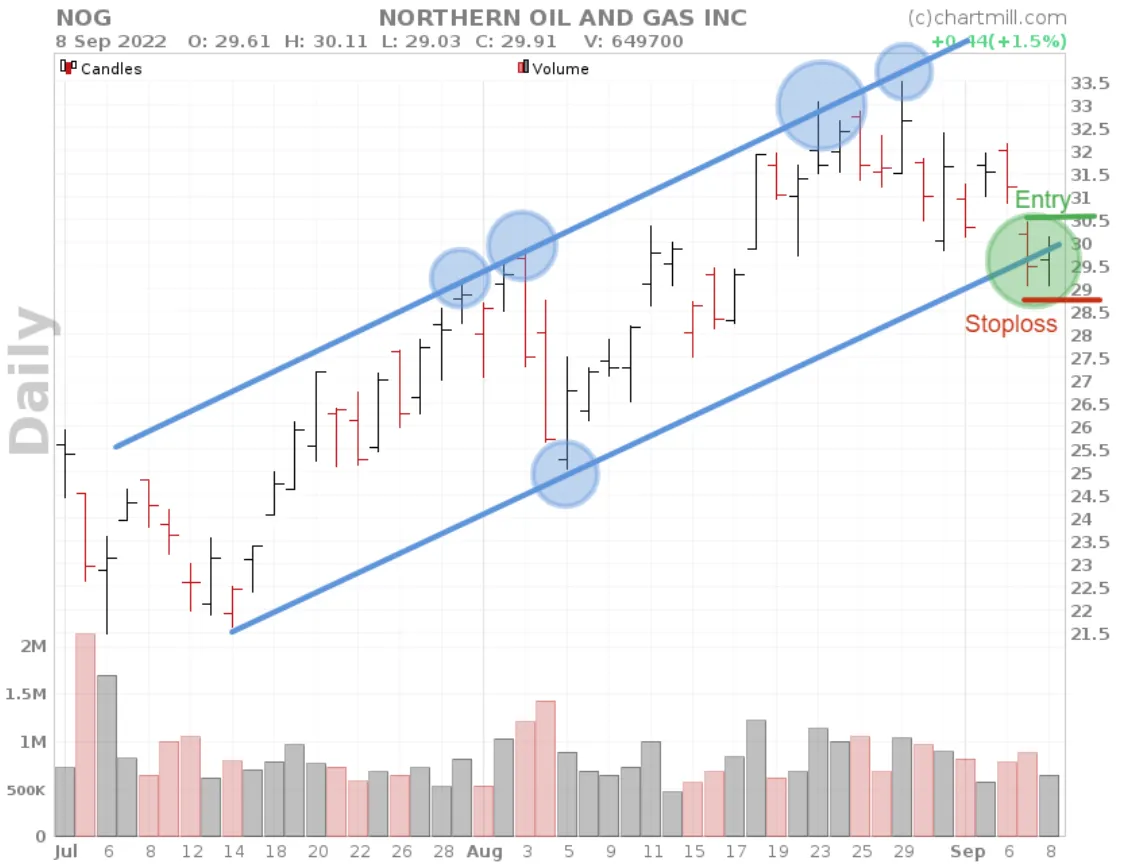
The opposite ascending trend line can then be used as a price target.
How to find Descending Price Channels?
The Ascending Price Channel is supported in our stock screener. On top of that ChartMill will also automatically draw the trendlines which make up the pattern. On the indicators tab you can just select 'Channel Up' from the 'Chart Patterns' filter on the 'indicators' tab. This is a direct link to the screen.