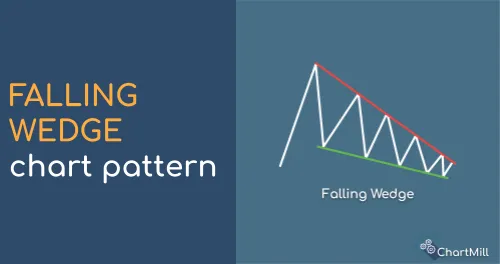
Falling Wedge Pattern
How to recognize a falling wedge?
A falling wedge has two descending trend lines. Both trend lines run in the same direction but each has a different slope. The upper trendline descends more sharply than the lower descending trendline (unlike the rising wedge pattern where this is just the other way around). This creates the typical wedge shape that gradually narrows and ends in a point.
This chart pattern is characterized by:
- an upper descending trend line representing several lower consecutive tops
- a lower downtrend line showing the various lower consecutive bottoms
The more reversal points visible, the higher the reliability of the pattern. To be retained as a wedge there must be at least 5 such reversal points present within the pattern, not counting the exact starting point on the lower and upper trendlines.
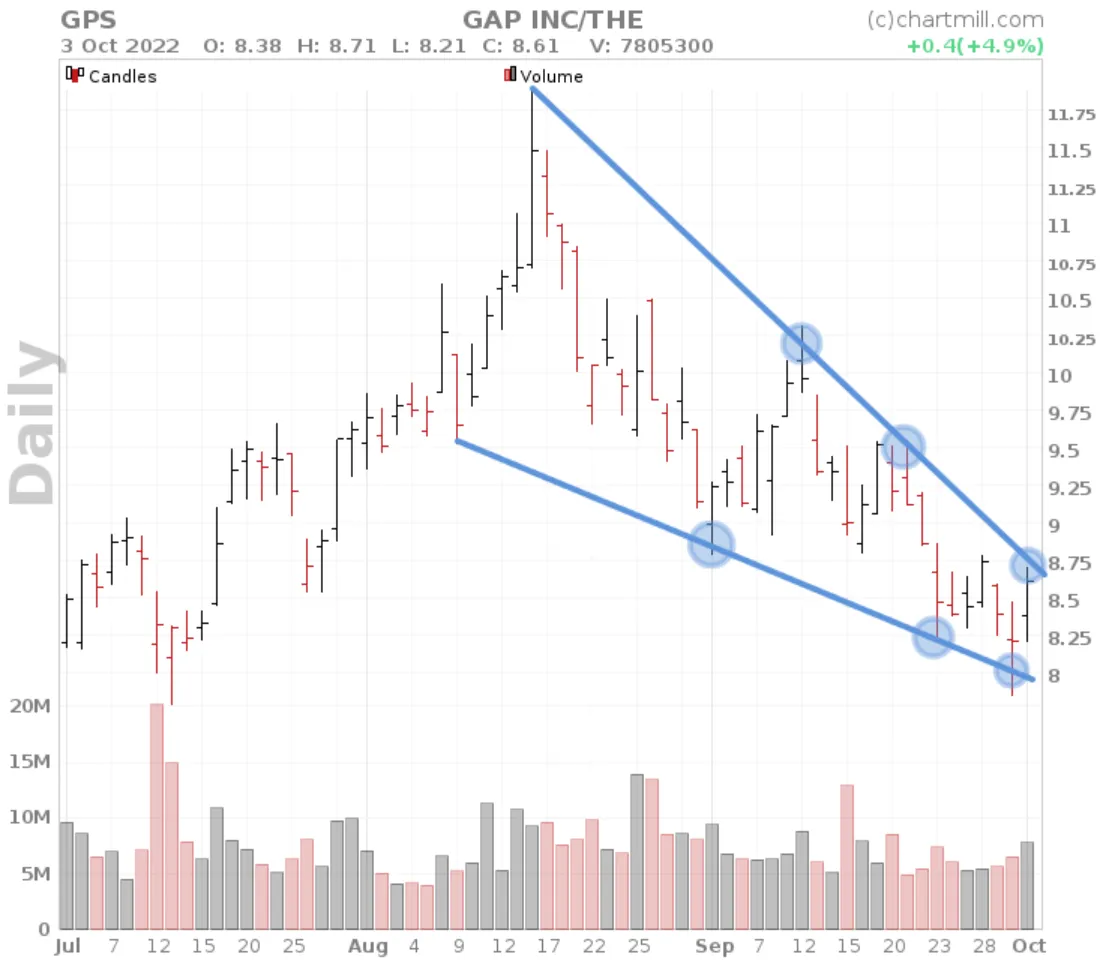
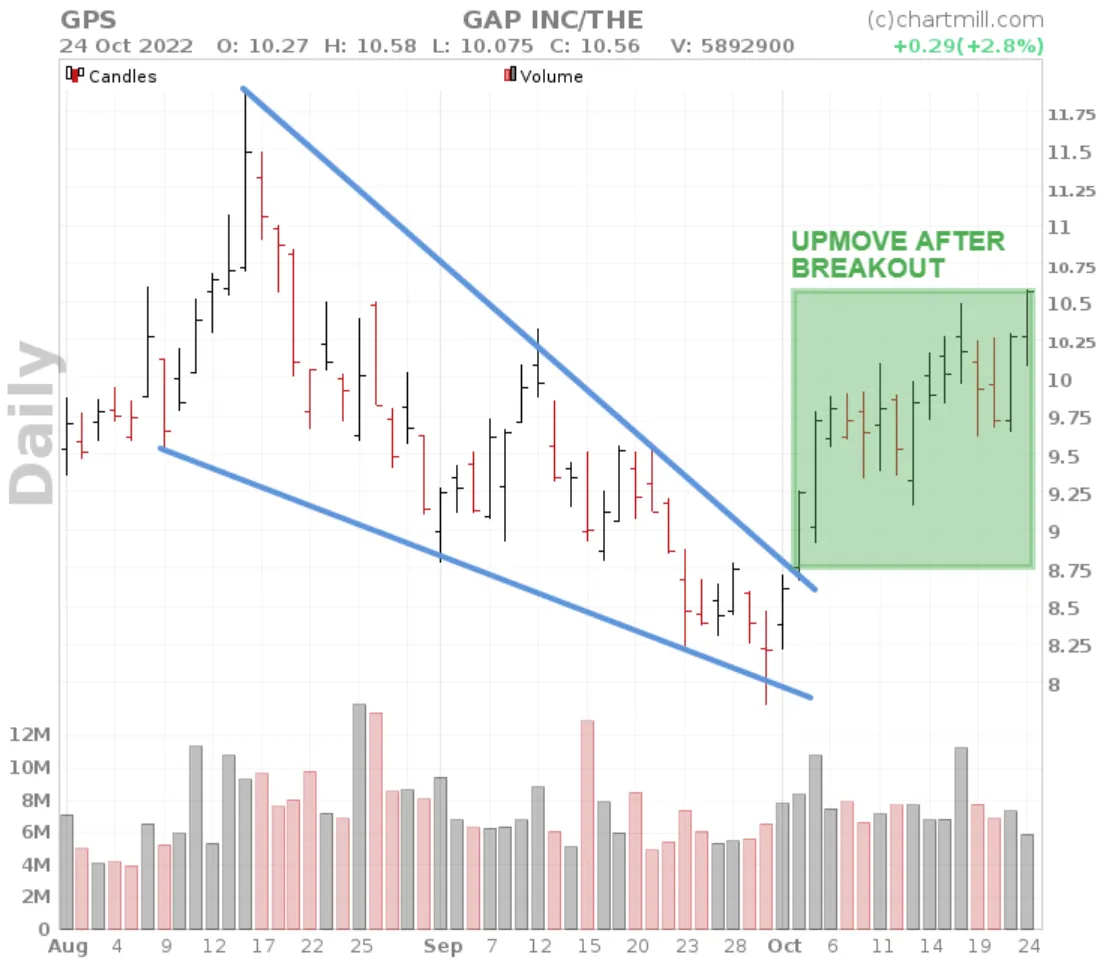
Falling Wedge Breakout above the upper trendline
Despite the fact that the pattern itself is created by a succession of increasingly higher lower tops and bottoms, this is a typical bullish reversal pattern and not a continuation pattern as is the case with the triangle formations, for example.
A falling wedge assumes a breakout above the upper descending trend line (the trendline with the sharpest slope). If that happens, a further upward movement is expected.
Retest of the initial breakout level
As with many other patterns, you can opt not to trade the initial breakout and wait for the price to retest the breakout level. The advantage of this way is that from a risk/reward standpoint it usually yields the best setups.
The disadvantage versus the classic breakout is that if the initial move is strong and continues immediately you will be too late to jump on board.
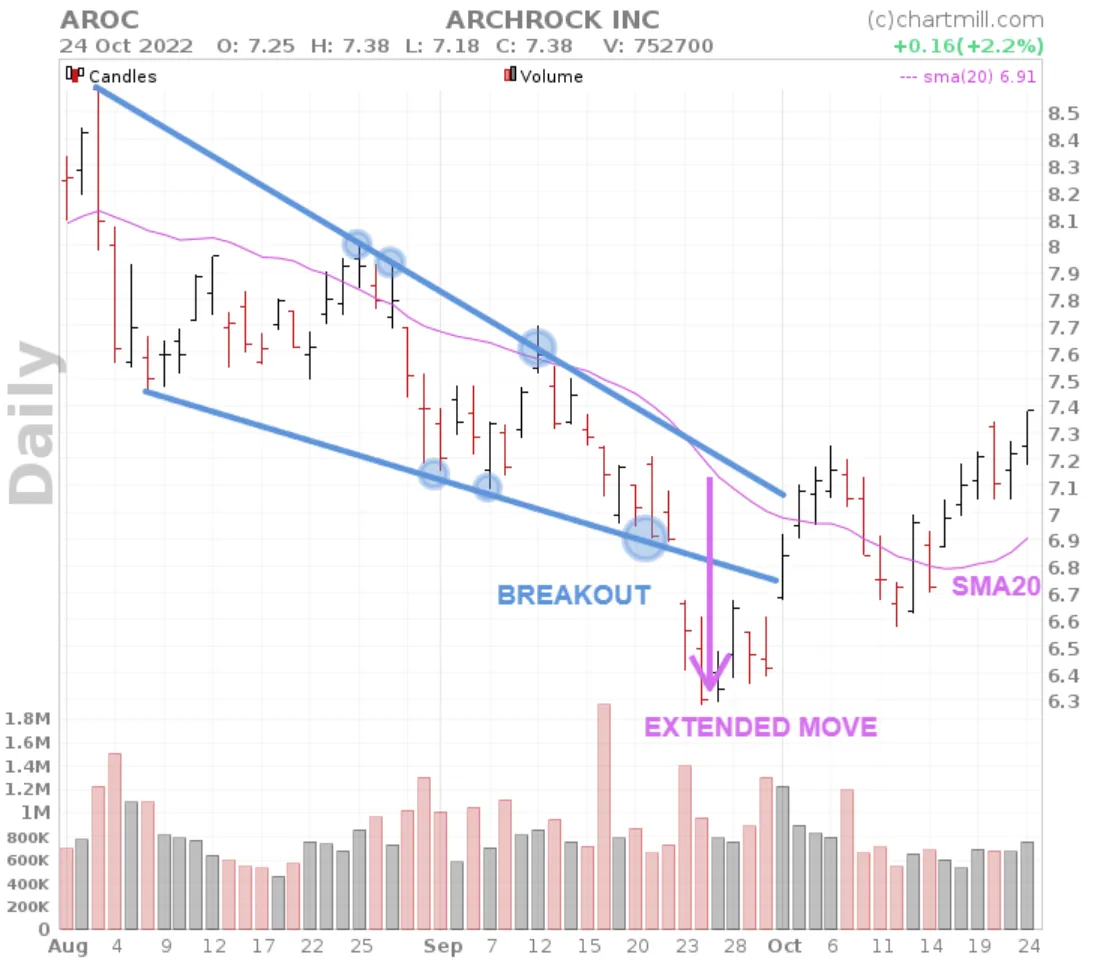
Falling Wedge Breakout below the lower trendline
Breakouts below the lower trend line are atypical but do sometimes occur. These usually occur in a pre-existing downtrend that is coming to an end. The move is usually accompanied by fairly high momentum, as if squeezing out the very last bit of bearish strength. A characteristic feature is the strength of the breakout, which can be very significant in a very short time, recognizable by the sudden rather large distance between the price and the SMA20, for example. Going short based on this downward price breakout is highly speculative because the probability of an at least equally sharp incline is quite significant.
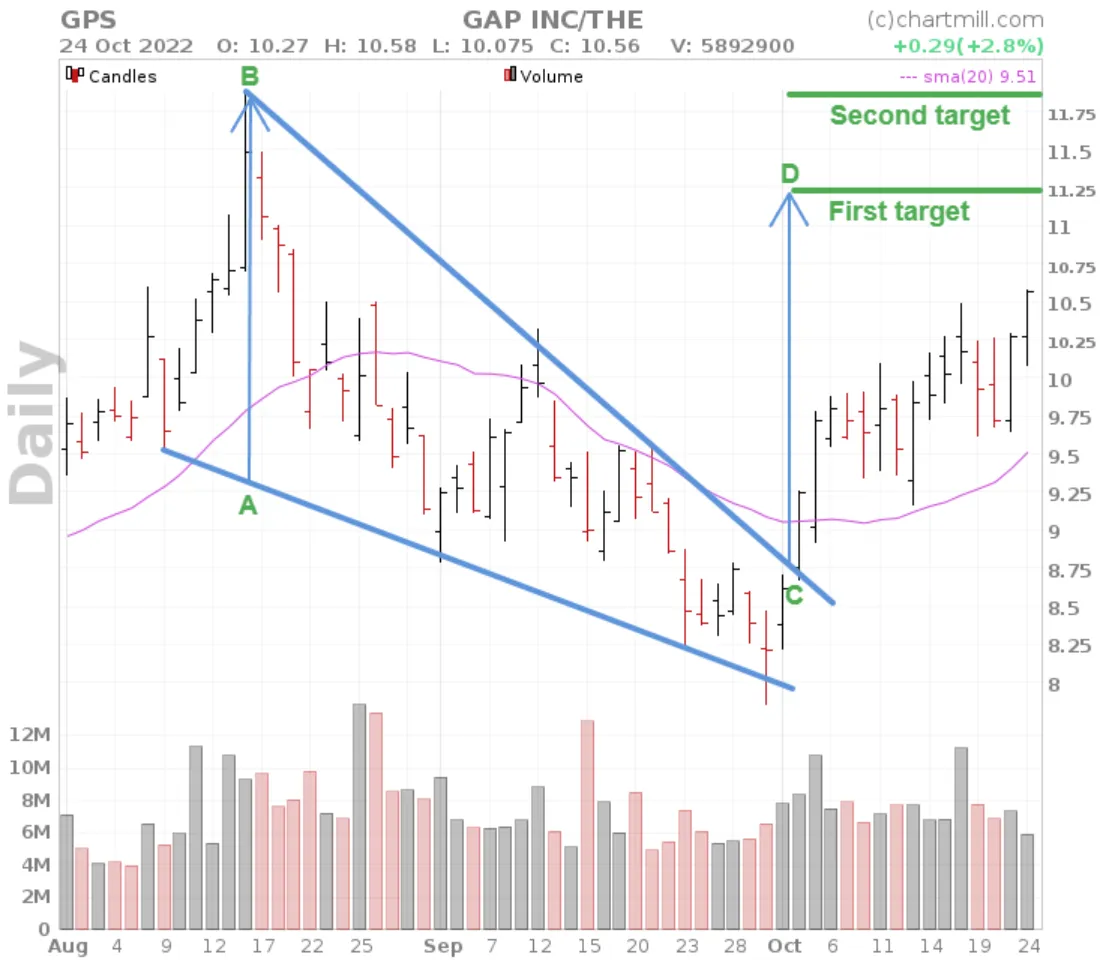
Falling Wedge Price Target
The first price target (D) in an upward breakout is generally taken to be the distance equal to the largest possible difference between the upper and lower trend line within the pattern itself (A > B).
The subsequent price target is the high of the pattern itself (B)
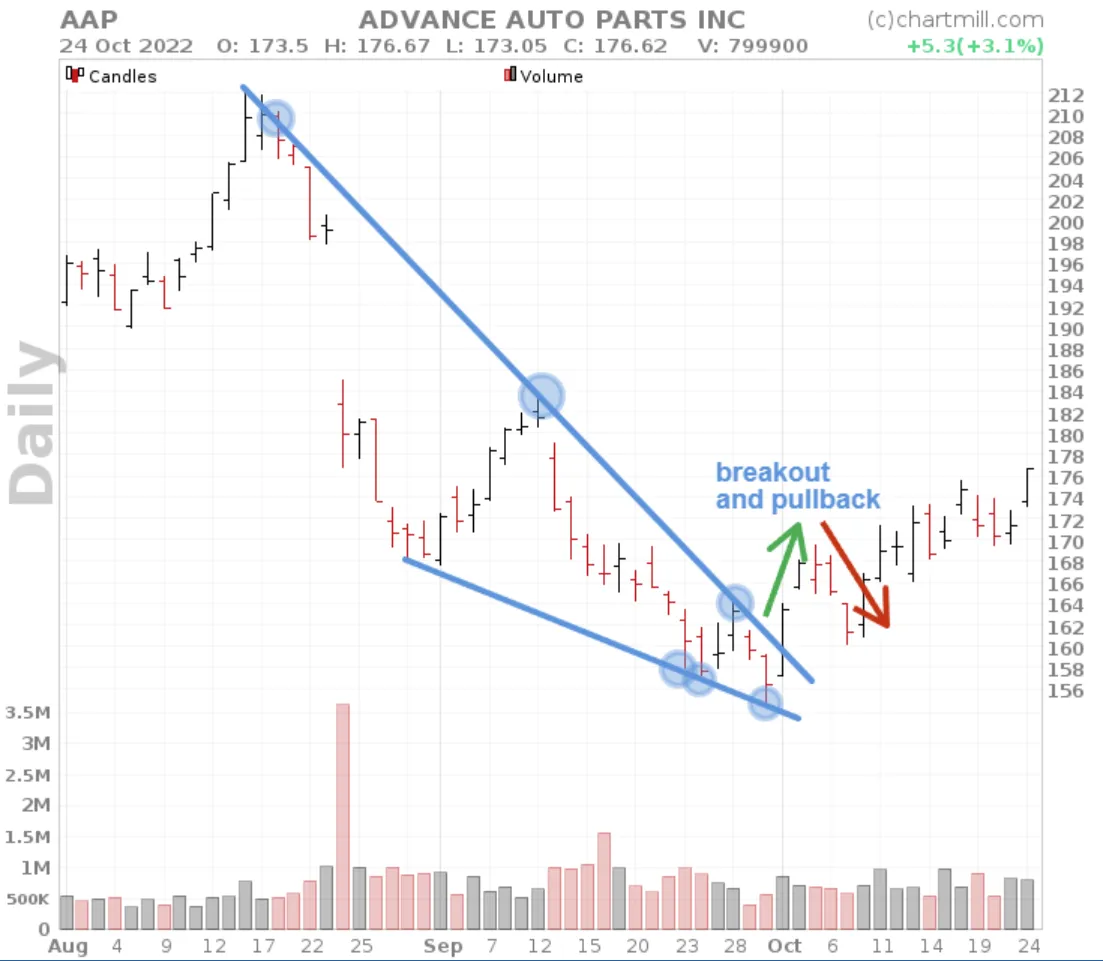
Trading example for the Falling Wedge chart pattern
It is important to focus only on good quality setups. These are the patterns in which the two trend lines converge sharply and in which the top descending trend line drops noticeably sharper than the bottom trend line. The breakout should be accompanied by a noticeable rise in volume, which is evidence that the breakout was noticed by traders and is being acted upon effectively.
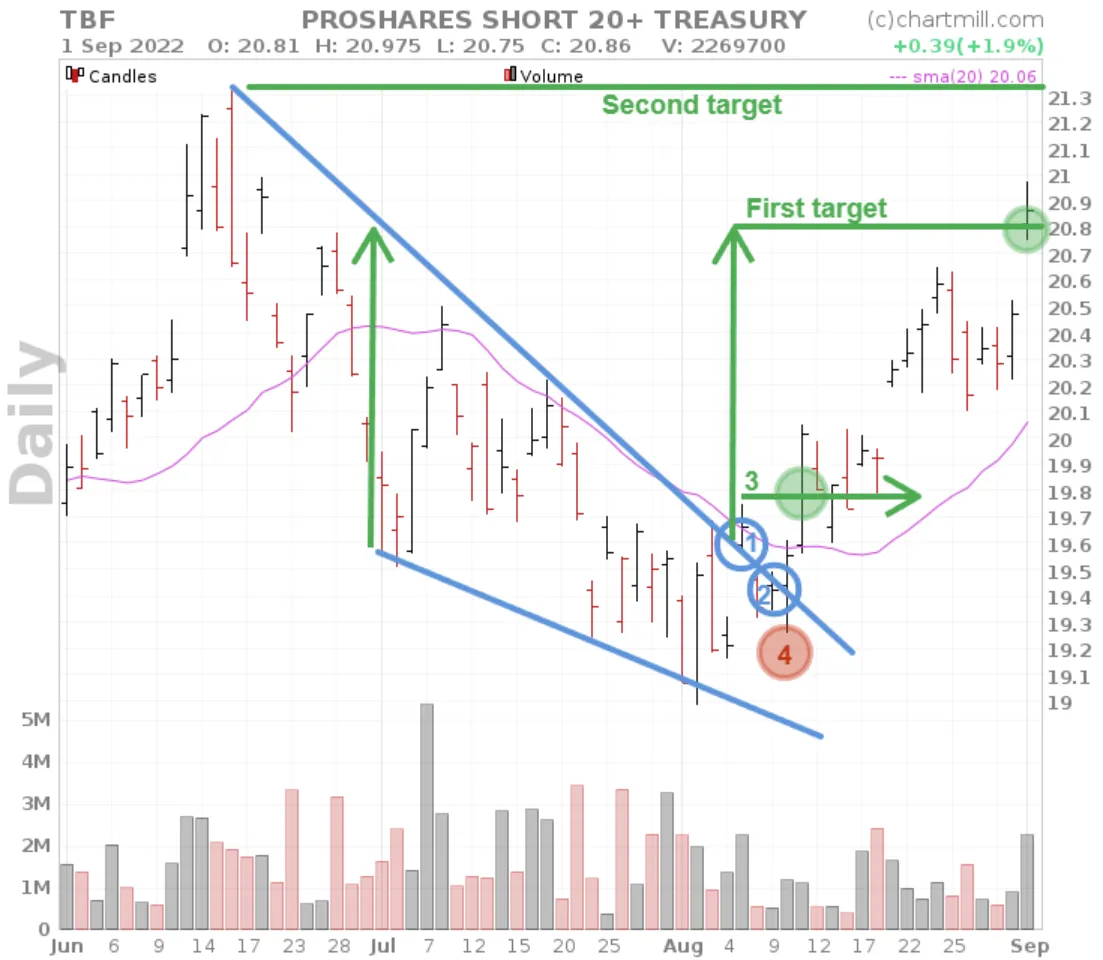
- Initial breakout above descending trendline
- Price pullback, retesting the descending trendline
- Entry above breakout candle
- Intial stoploss zone
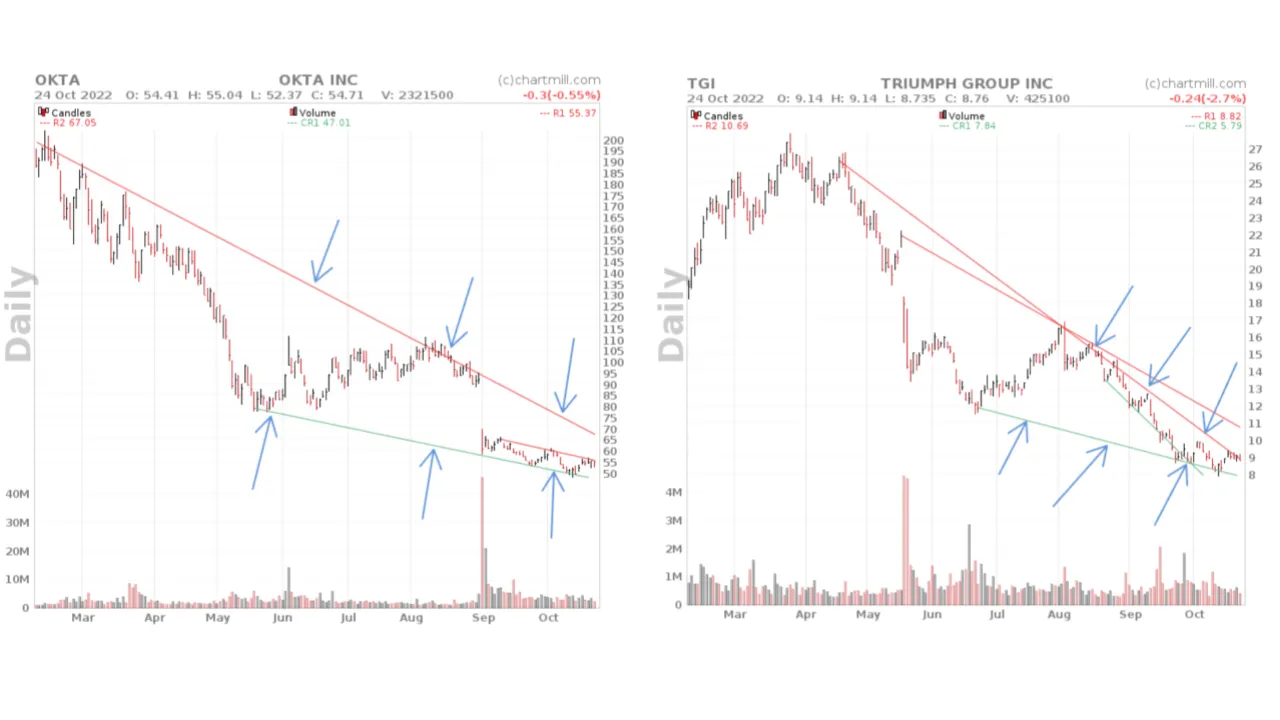
Wedge Screenfilters in ChartMill
ChartMill offers the possibility to screen for Falling Wedges. The filter can perfectly serve as a basis for a first selection which can then be further fine-tuned manually. Below a few recent results of the filter 'Falling Wedge'.
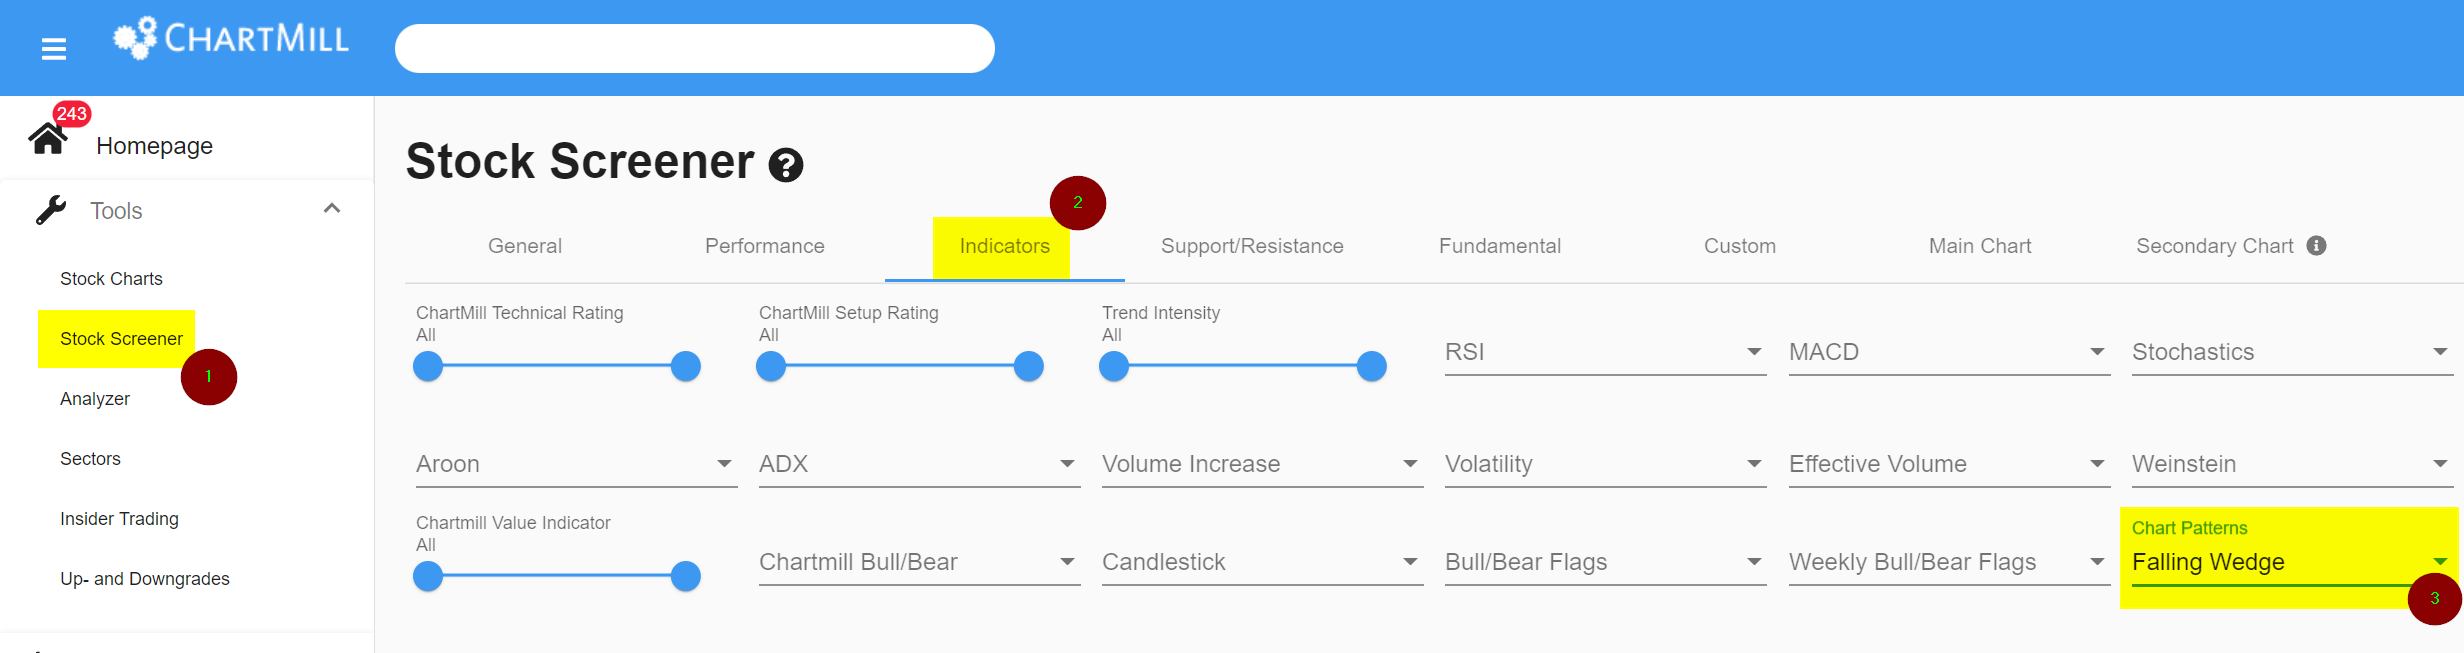
To configure the filters, go to the Stock Screener page and select the 'Indicators' tab. Then open the drop down menu under 'Chart Patterns'.
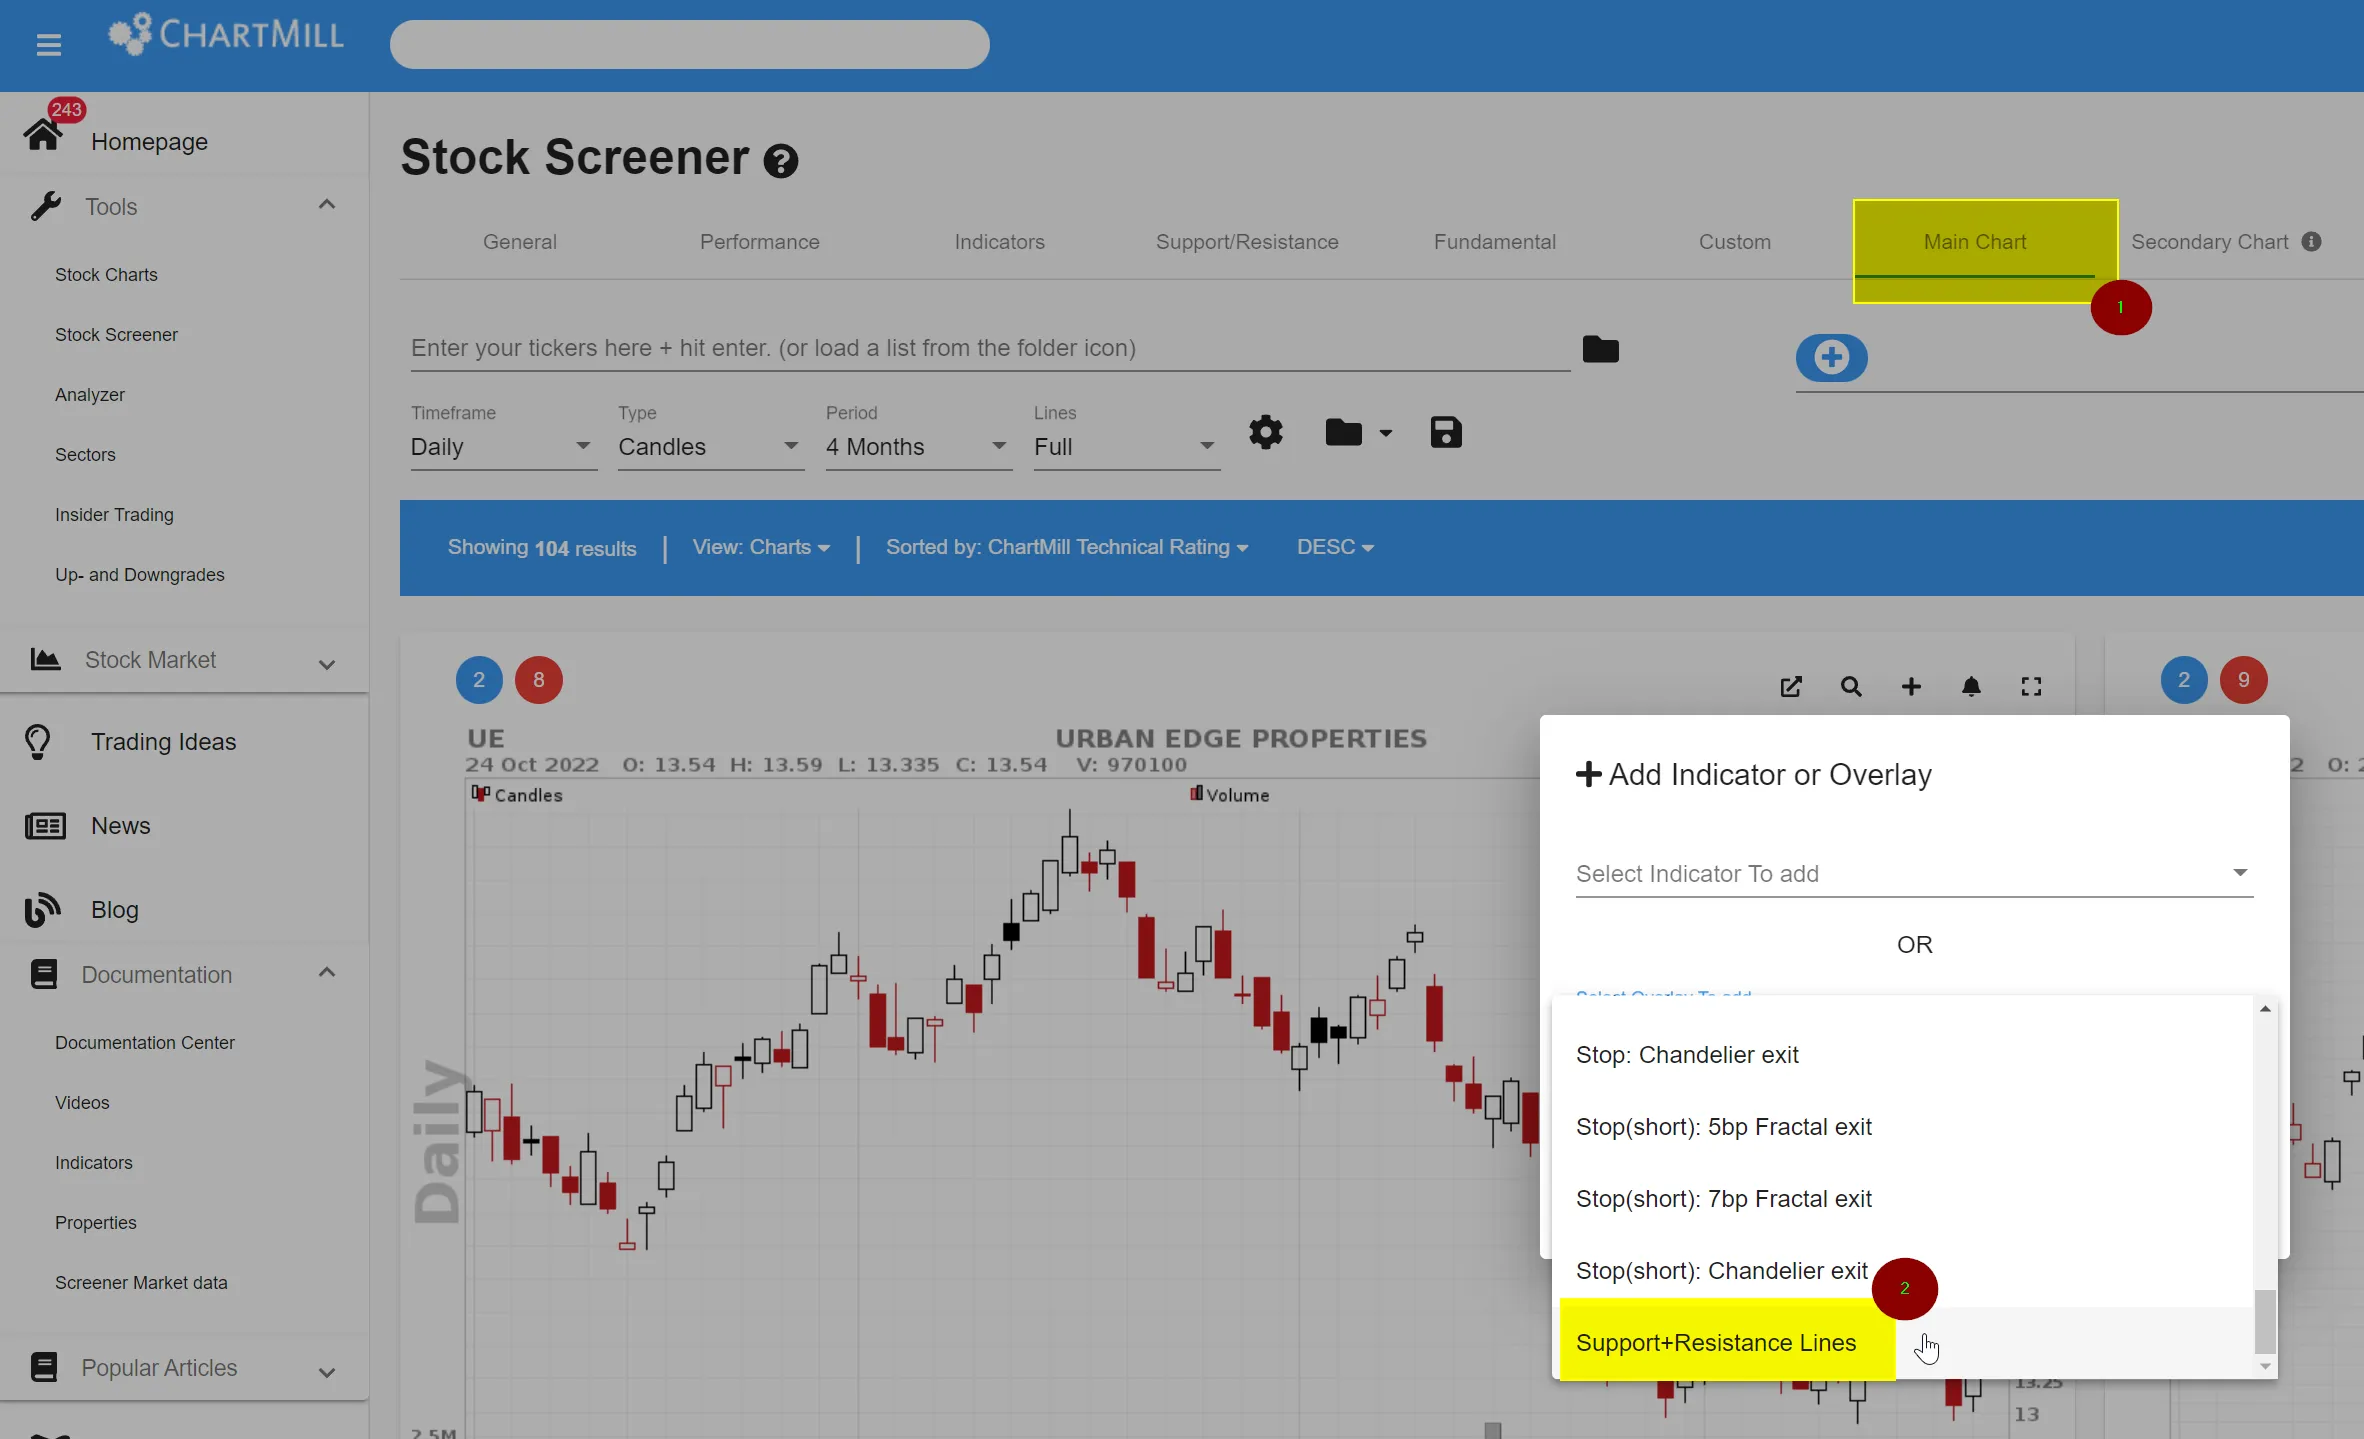
If the wedge formations are not visible on the chart, it means that the chart settings still need to be adjusted. Choose the 'Main Chart' tab and click on the plus sign (blue button). Then click 'Select Overlay To Add' in the lower ticker field. In the drop down menu, scroll all the way down and select 'Support + Resistance Lines'. Now the patterns are visible in your charts.
A sample screen filter for the Falling Wedge Chart Pattern (US stocks, minimum price of $5 and a minimum volume of 200,000)