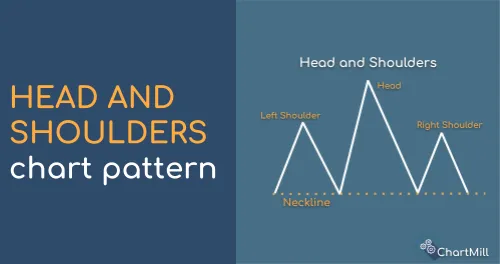
Head and Shoulders Pattern
How to recognize an Head and Shoulders Pattern?
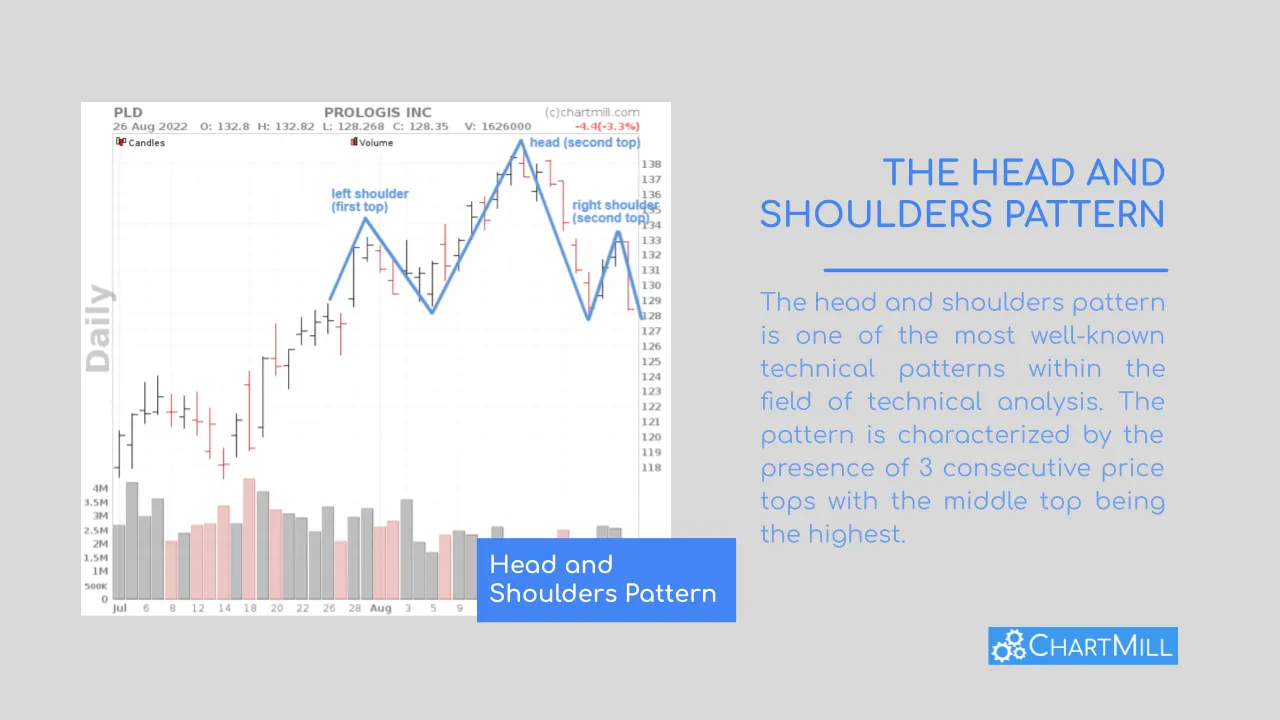
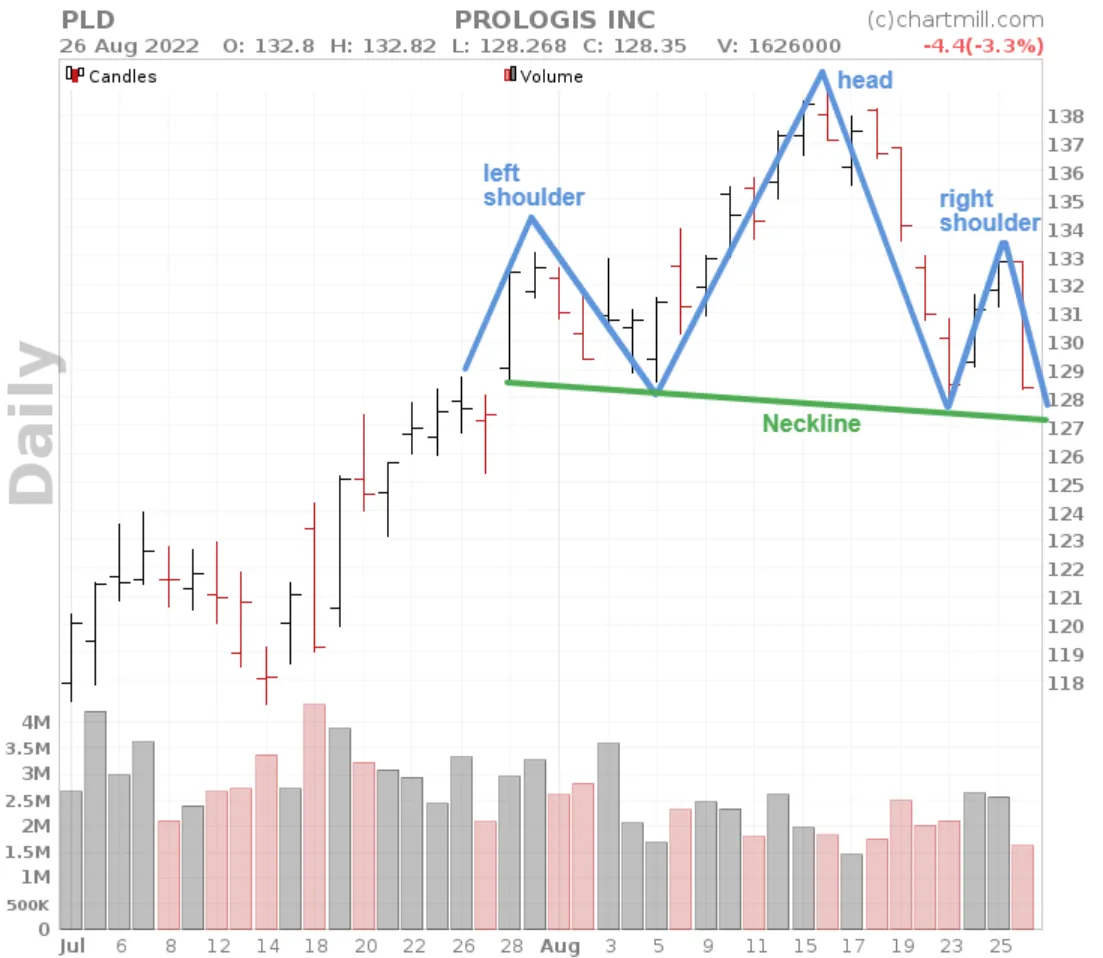
The head and shoulders pattern is one of the most well-known technical patterns within the field of technical analysis. The pattern is characterized by the presence of 3 consecutive price tops with the middle top being the highest.
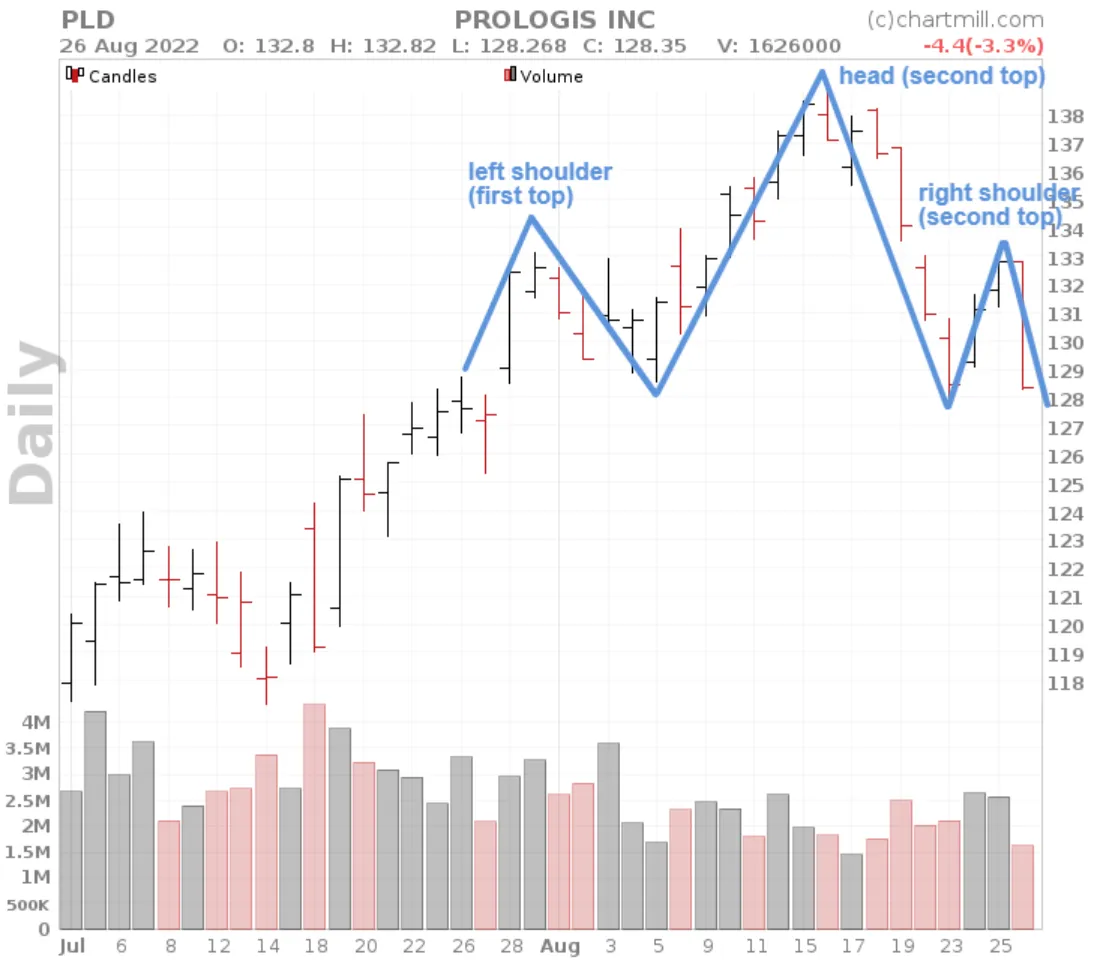
Because the middle stop is higher than the tops to the left and right, the middle top is described as the 'head' and the left and right tops as being the 'shoulders'.
The pattern forms after a rise (first top) where the price initially falls back a bit. The uptrend resumes and a new higher top is formed (second top). However, this peak is countered by sellers who manage to bring the price down quite aggressively, to about the same level as the first price drop.
At that price level, a sort of double bottom is formed, which again attracts buyers. Once the price encounters resistance at the same level as the very first top, buyers are unable to bring the price above the second, most recent top. As a result, price drops again where eventually the earlier double bottom is broken downwards and the trend reverses. This is also called breaking the neckline.
Therefore, the head and shoulders pattern is a bearish reversal pattern speculating on the end of a bullish trend and the beginning of a new downtrend.
Slope of the neckline
The neckline connects the lows of the left shoulder and the head. When the low of the head is lower than the low of the left shoulder, it will show itself in a descending neckline. This gives extra strength to the pattern because the descending slope is a sign of a lower bottom, a first important indication that the prevailing trend is ending.
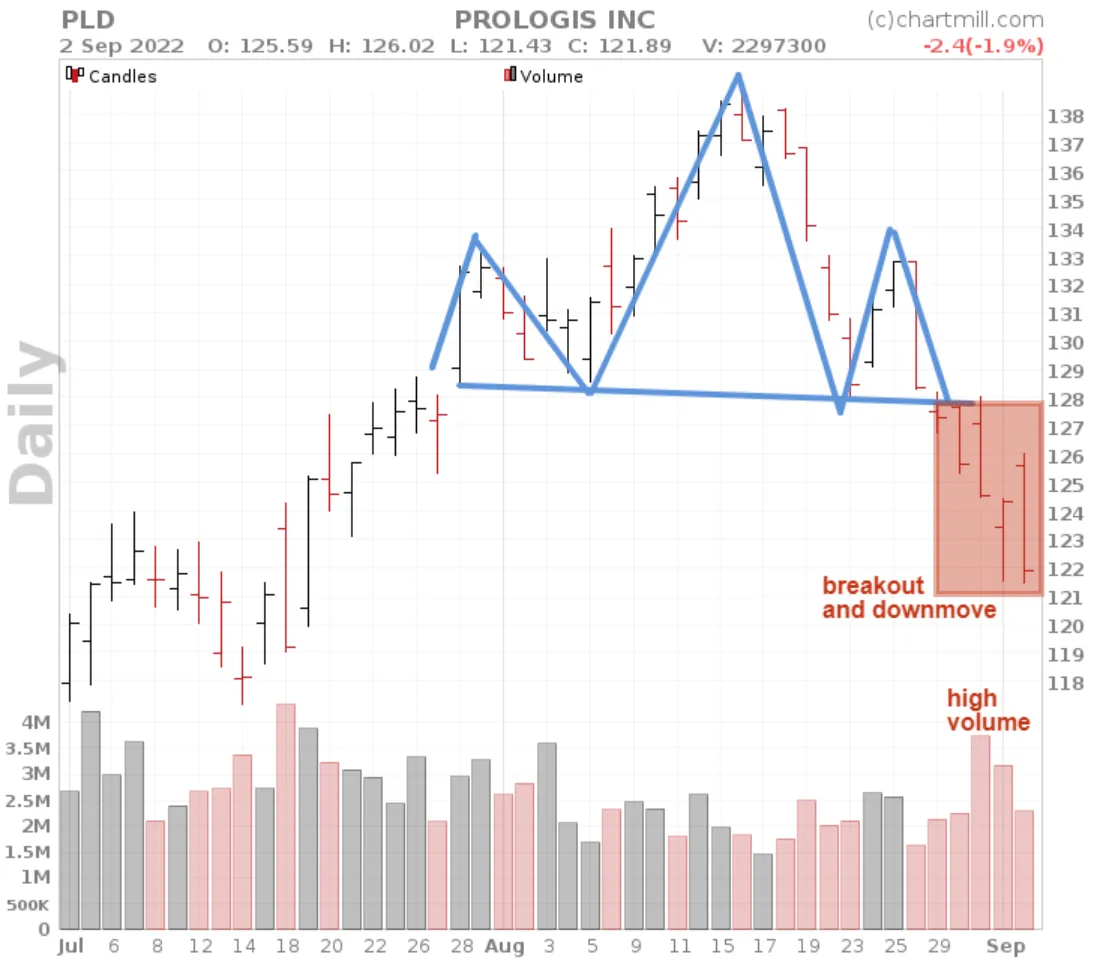
Head and Shoulders breakout
The breakout occurs after the formation of the second, far right shoulder, as soon as the price moves lower than the neckline.
Breakout traders will take a short position during the breakdown itself or after there is an actual close below the neckline.
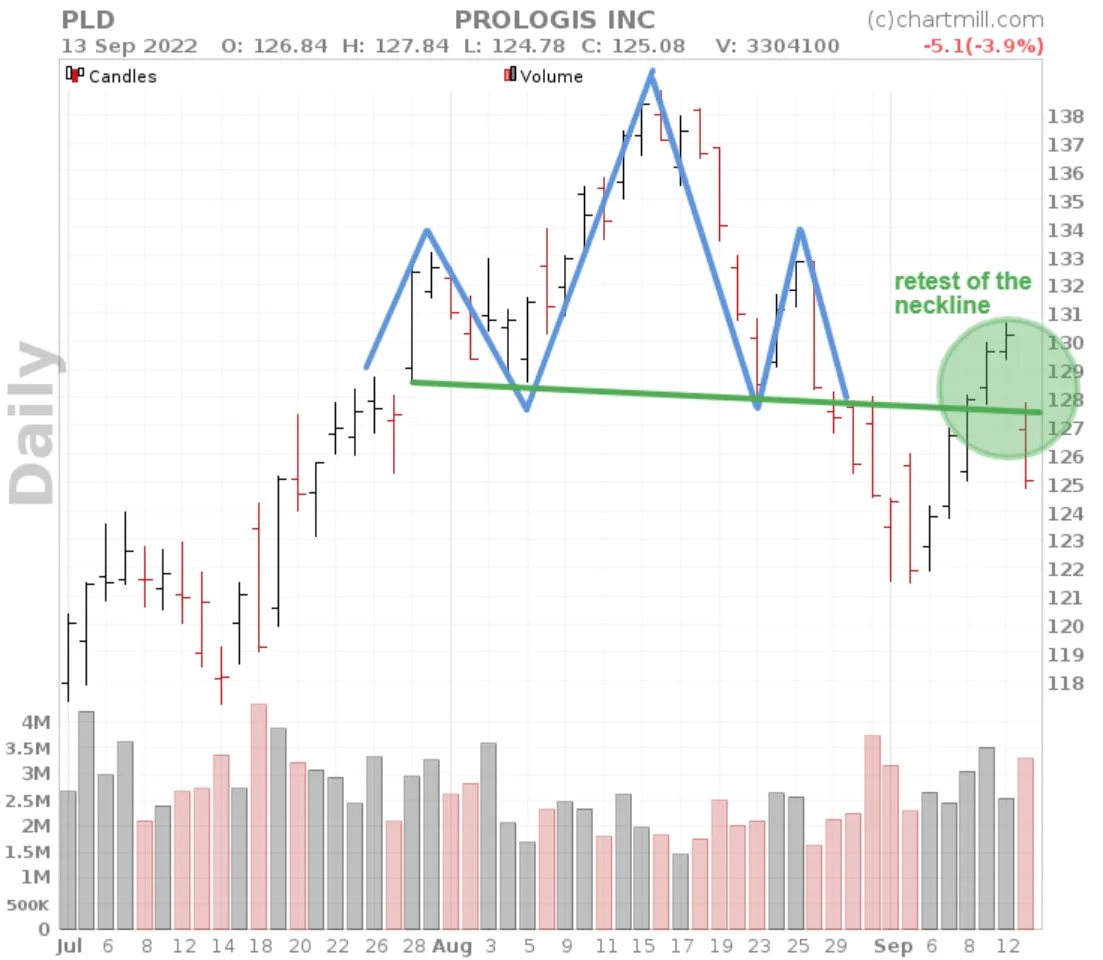
Another possibility is to wait until after the initial breakout, when the neckline is tested upward, to take a short position. From a risk/reward standpoint, this is usually the best option. However, the disadvantage is that you miss the move if a retest does not occur.
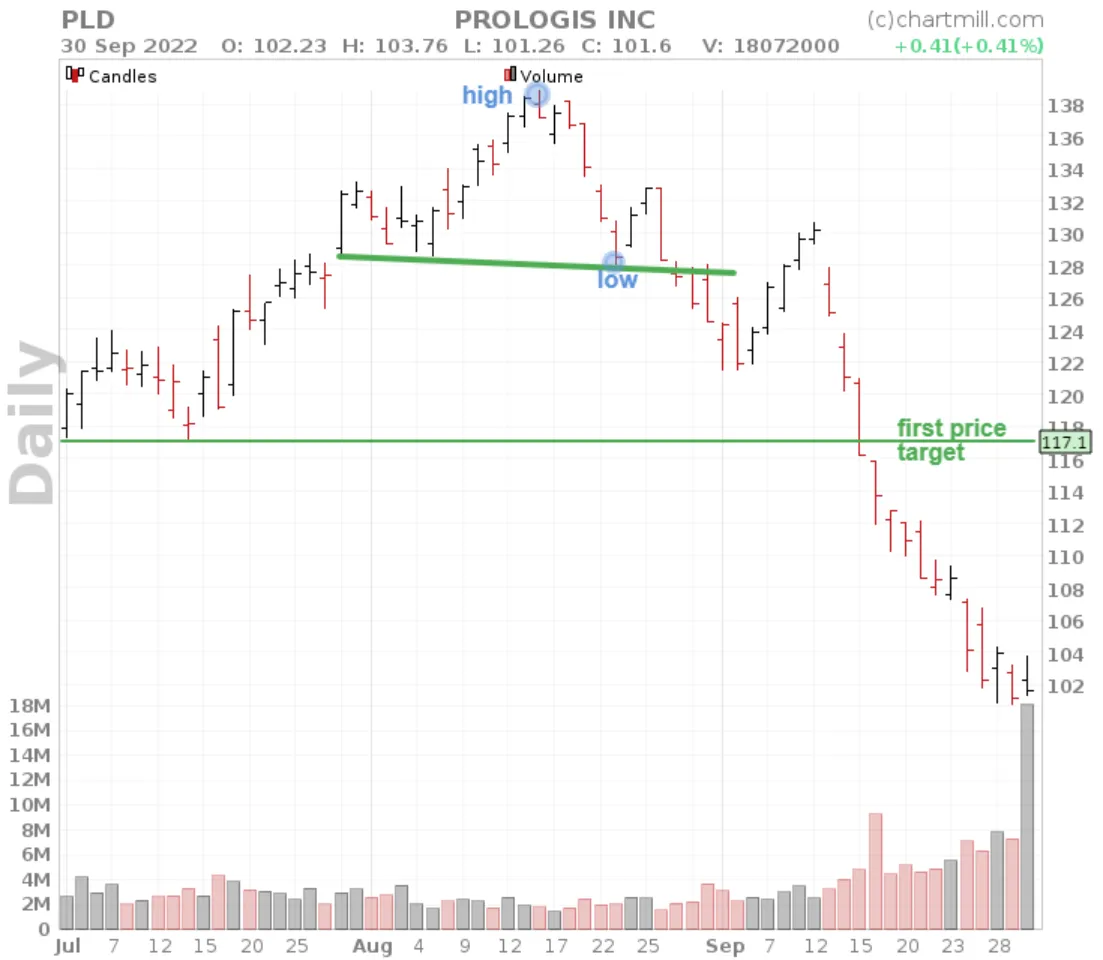
Head and Shoulders price target
By default, a price target is used that is as high as the pattern itself, being the difference between the highest price of the head and the lowest price of one of the two shoulders.
Head and Shoulders stoplosses
There are two options for setting the stoploss. Either you use the swing high of the second shoulder or, for more conservative traders, the top of the head formation. The furthest stop is recommended anyway for those trading in the longer term (position trading).
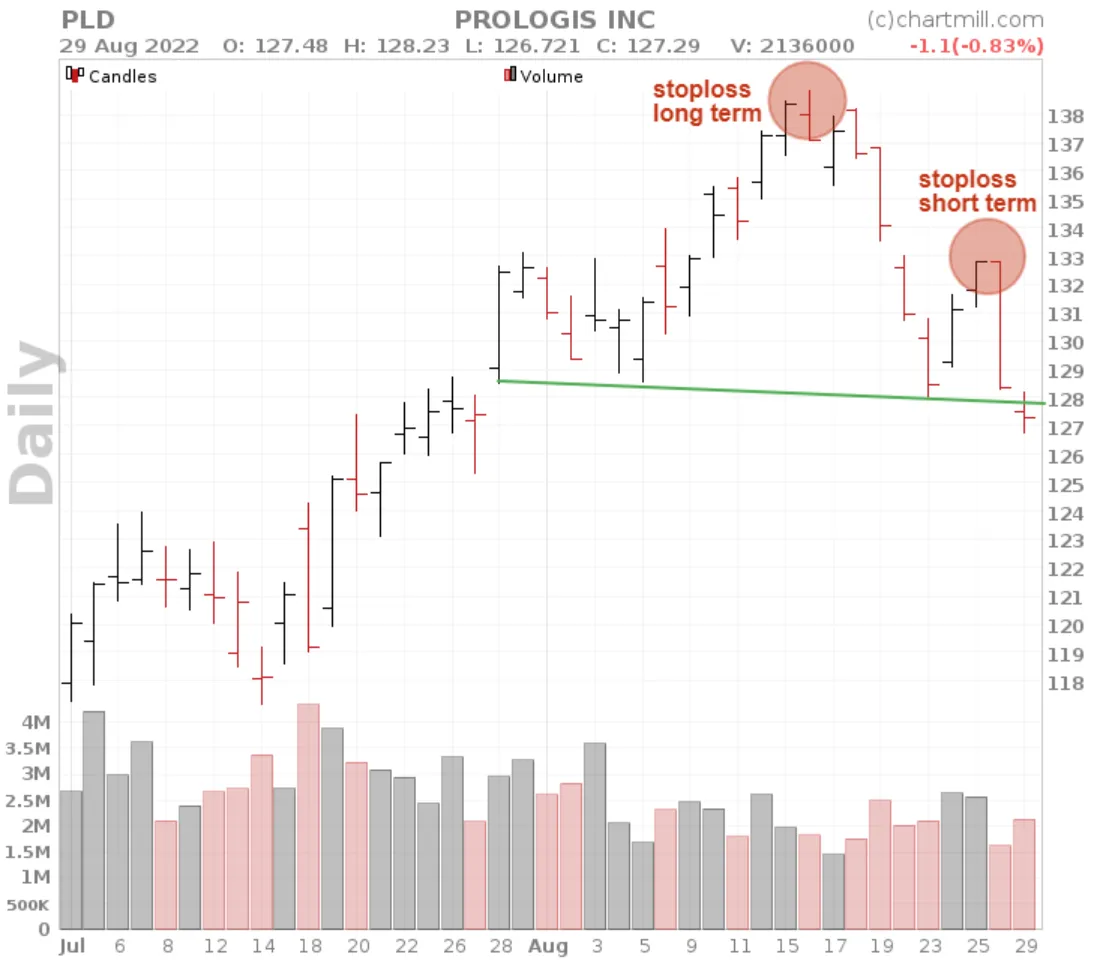
Where you place the stoploss also depends on the exact entry. Those who go short during the breakout itself will usually be able to place the stop a bit higher than those who wait until after the breakout candle and only then open a short position.
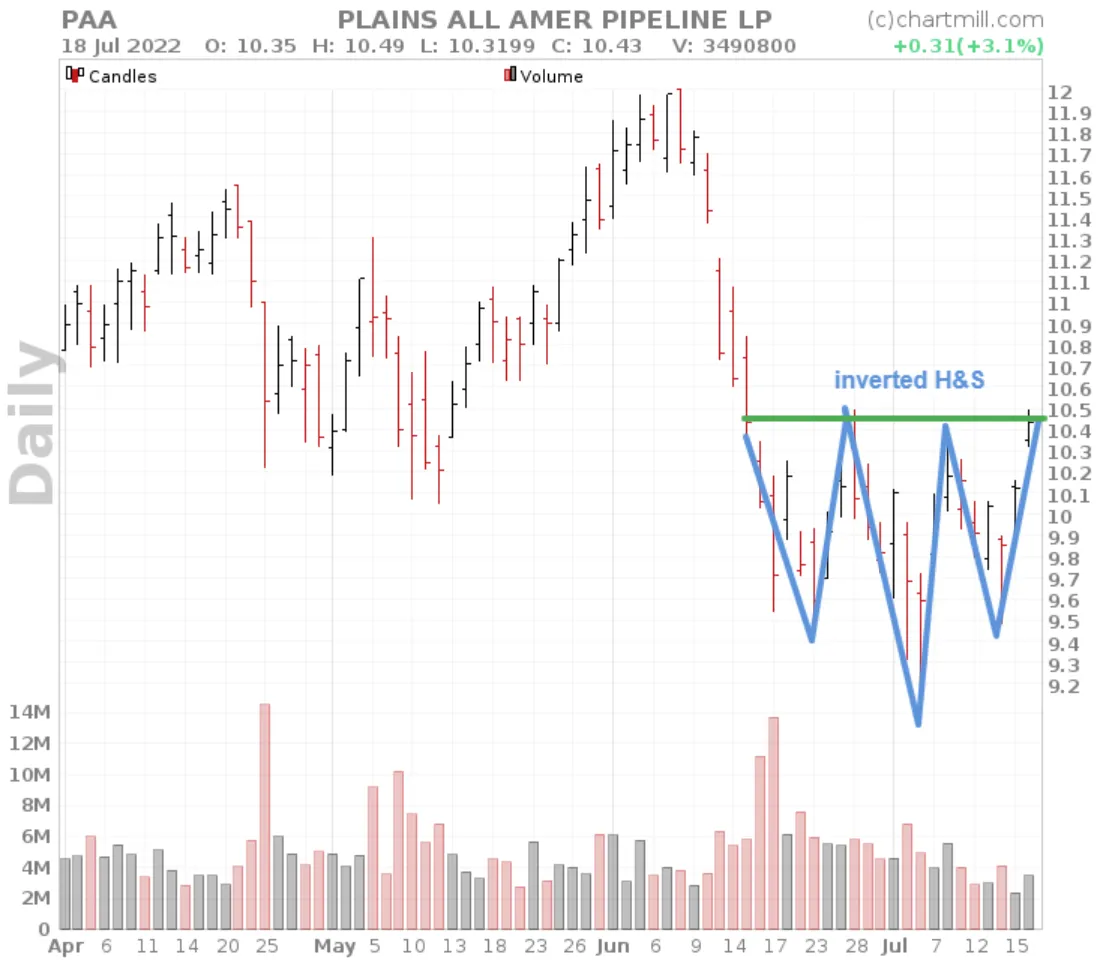
The inverted Head and Shoulders pattern
The inverted head and shoulder pattern is a bullish reversal pattern as soon as price breaks out above the top of the second inverted shoulder. The stoploss and price target rules remain the same as the basic pattern but of course inverted.