Descending Price Channel
What's a Descending Price Channel?
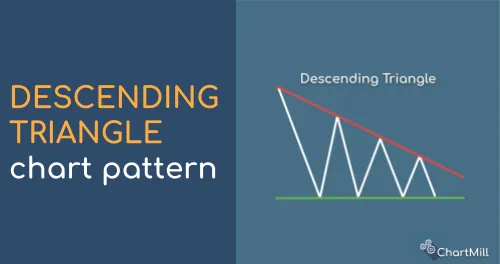
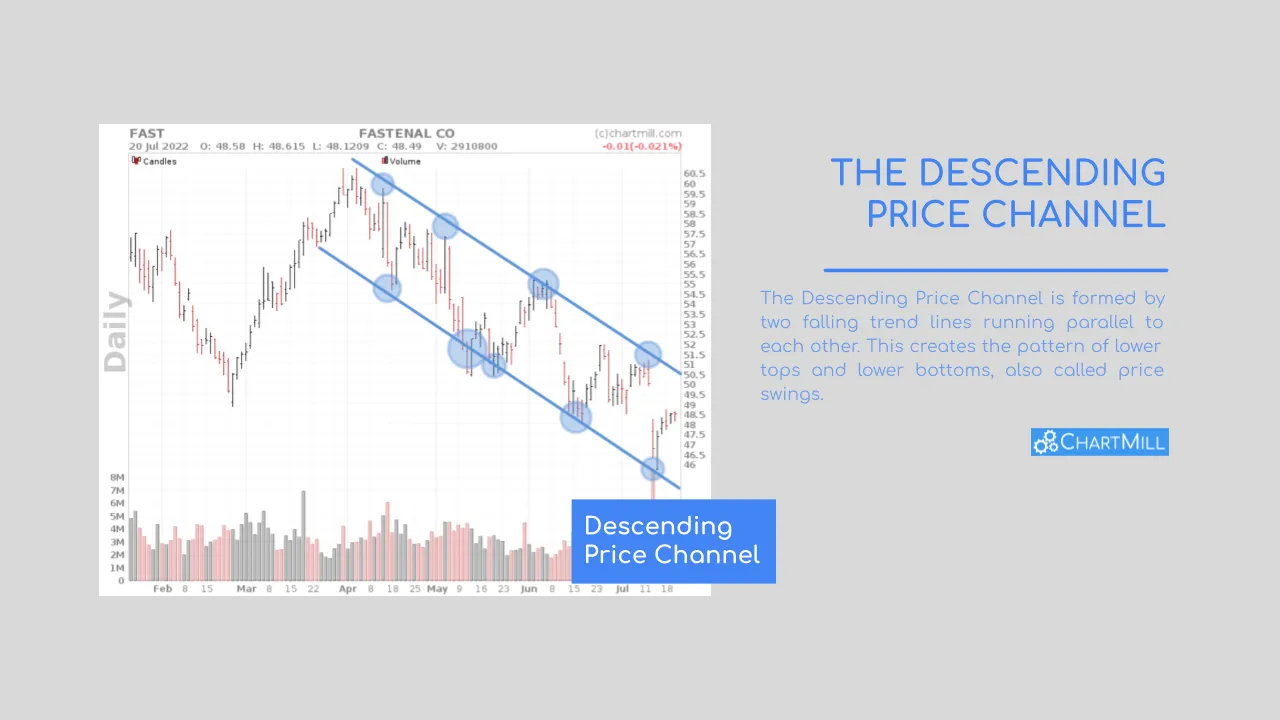
The descending price channel is the counterpart of the ascending price channel. It is used to define a specific price trend within the field of technical analysis.
The desscending price channel forms through a succession of lower tops and lower bottoms. When the respective tops and bottoms are connected, two descending trend lines parallel to each other are created.
As long as the price moves within these trend lines, the overall price trend is considered to be downward. The peaks within the channel will act as resistance as soon as the price reaches the upper limit.
Trend channels can be used to visualize the overall trend but equally specific setups can be defined within the channel to go long or short.
Defining setups within the Decending Price Channel
There are two different ways to withhold setups based on a descending price channel.
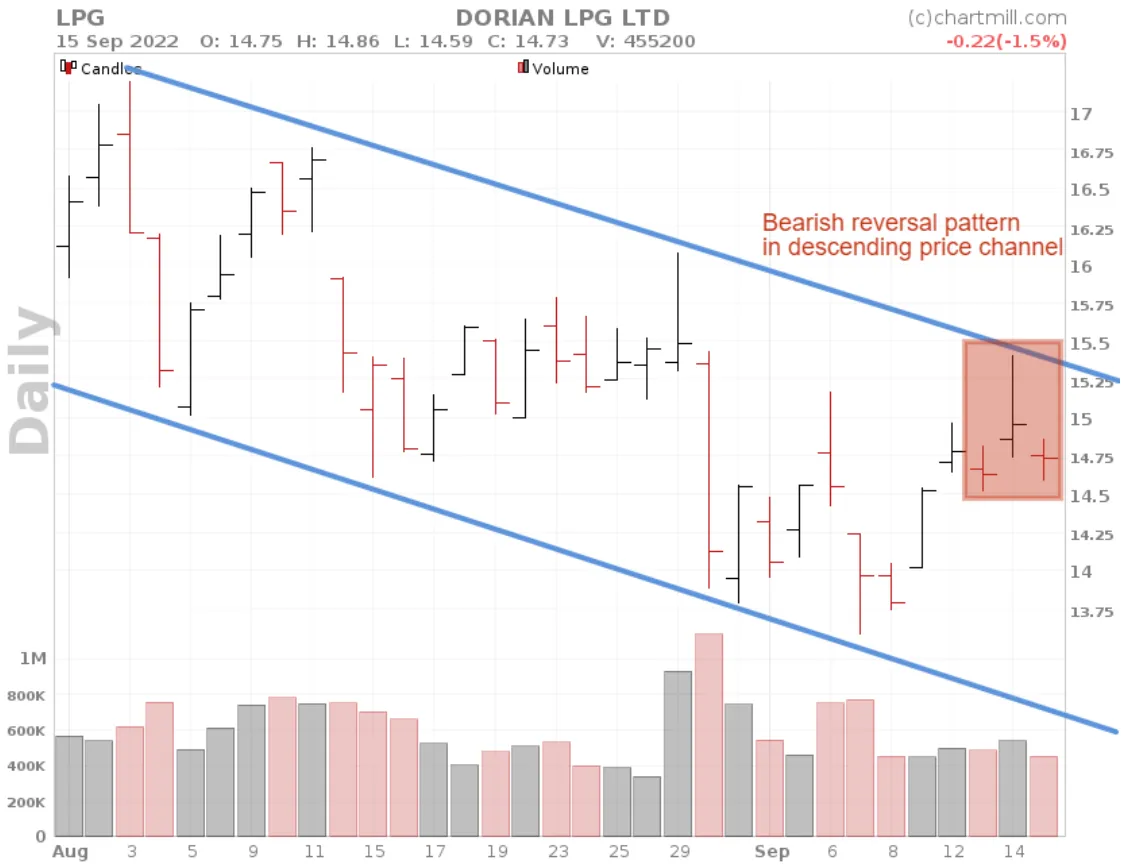
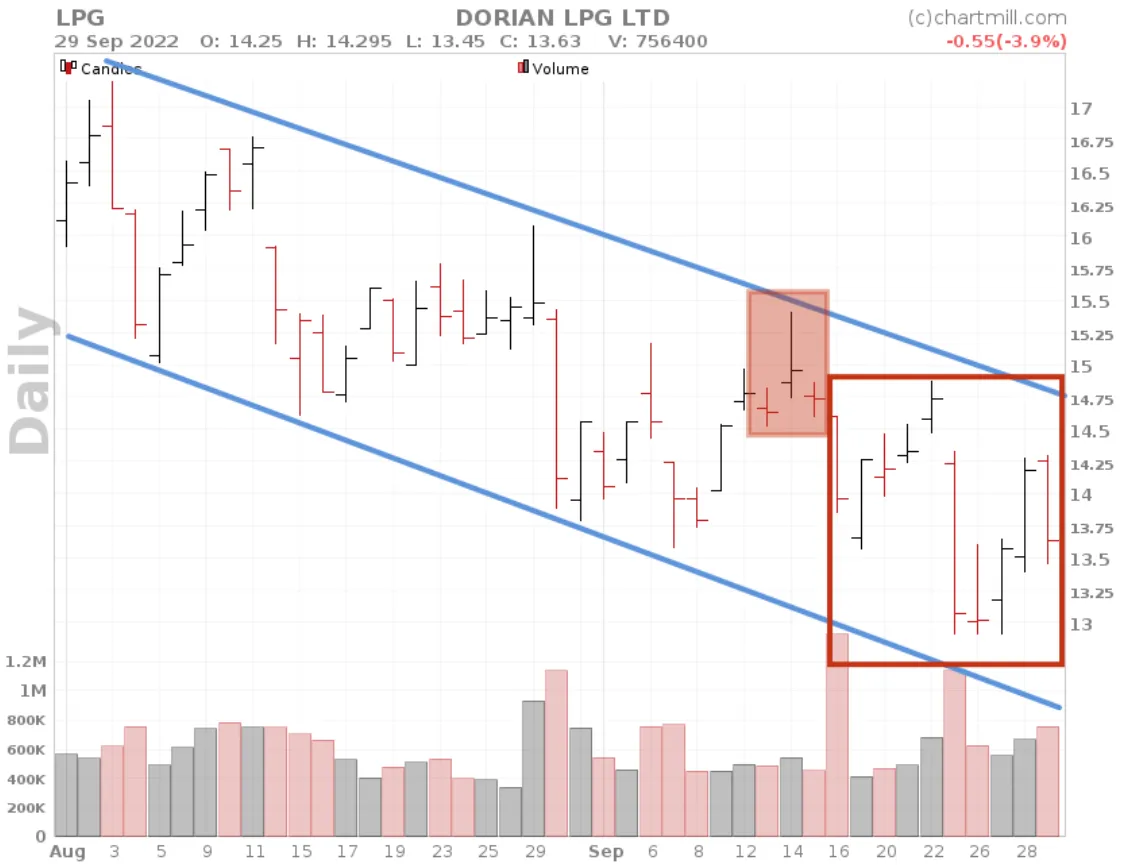
The first strategy is primarily used by trend traders looking for setups in the direction of the existing price trend. Since a descending price channel is a sign of a bearish trend, trend traders will get interested especially once the price is at the level of the upper bearish trend line. That price level can be a good opportunity to go short if a clear reversal pattern occurs. Just going short as soon as the price hits the upper bearish trend line is definitely not advised. After all, the probability of a real breakout always exists.
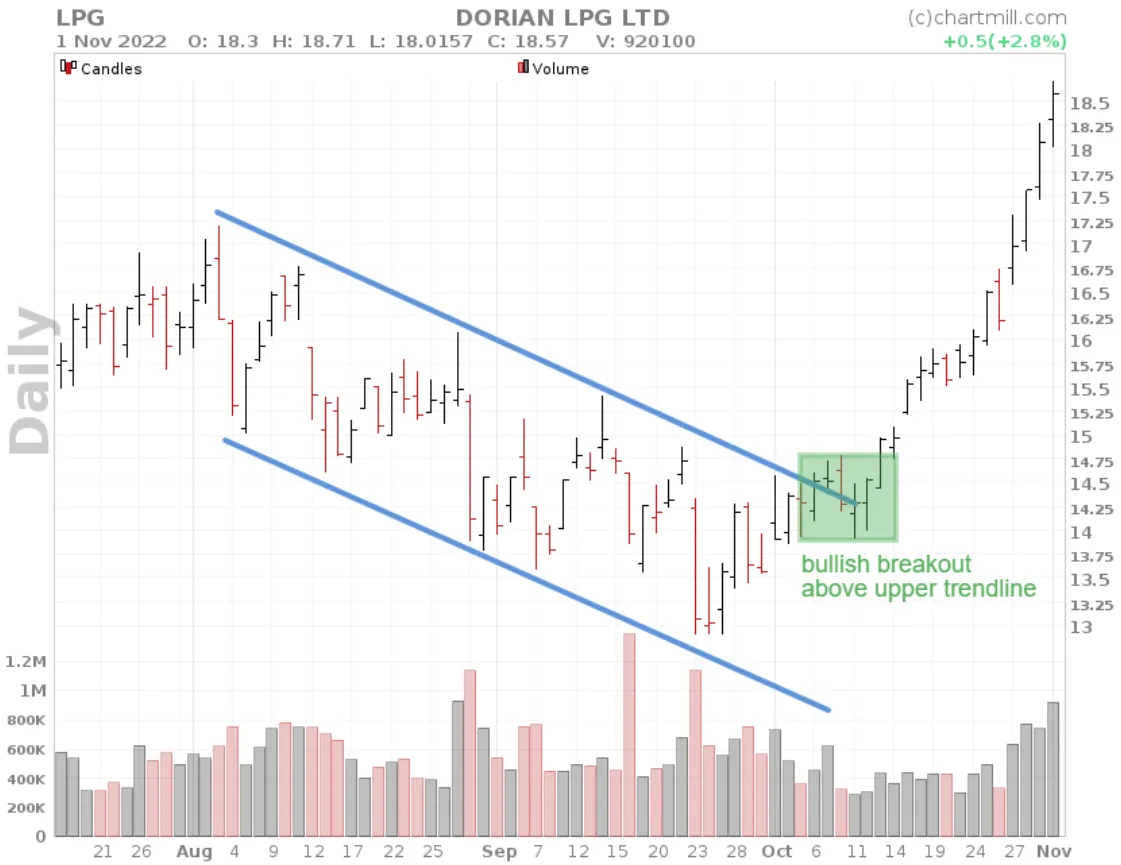
The second way is to speculate on a real trend reversal after the breakout. For this, the price must first close higher than the upper descending resistance line. The bar or candle should be convincingly bullish, preferably with a close at or very close to the high of the day and with remarkably increased buying volume.
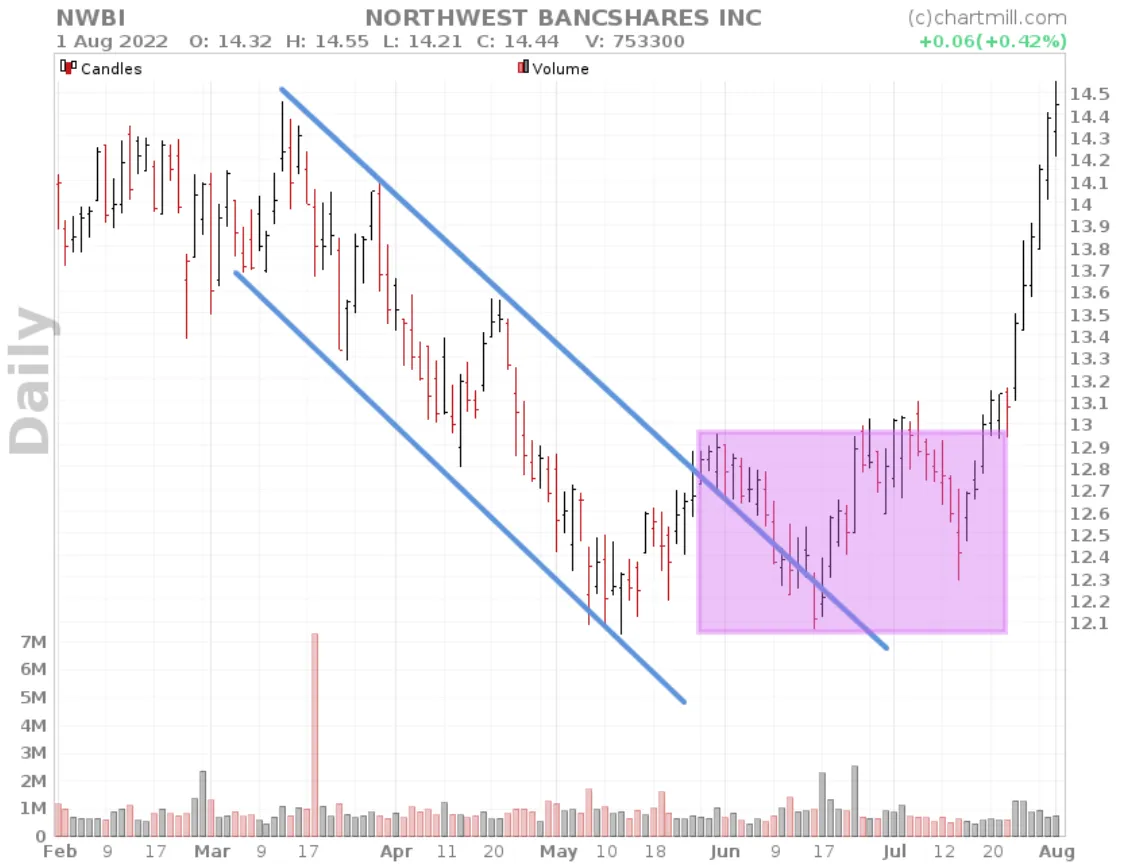
In reality, you will rarely experience a rising price channel quickly turning into a falling price channel or vice versa. Usually there will first be a price channel where the price moves more or less sideways so that buyers and sellers keep each other in balance. Only when an upward or downward breakout occurs there is once again a chance that the next descending or ascending price channel will materialize and the cycle repeats itself.
High momentum
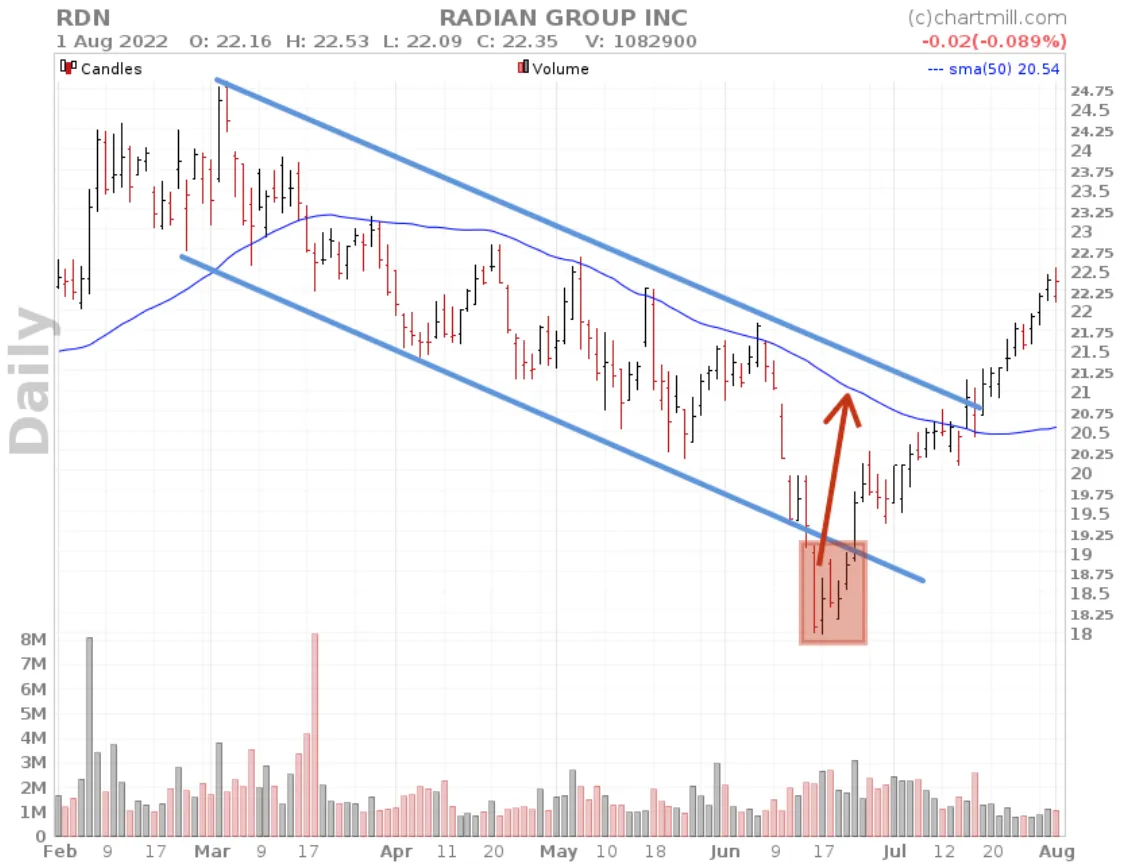
As with the ascending price channel, the existing trend can abruptly intensify. In a downward price channel, this manifests itself in a price that breaks through the lower descending trend line with great force. If that existing downward trend has persisted for some time, it is recommended to be very cautious about such extreme movements. In many casis it is a sign that the existing trend is coming to an end. Typically, the price is rather far away from the average price (e.g. the SMA20 or SMA50) due to the sudden violent movement. That particular price overshoot attracts buyers who are convinced that this has caused the price to deviate too far and that a correction is imminent.
False reversal breakouts within the Descending Price Channel
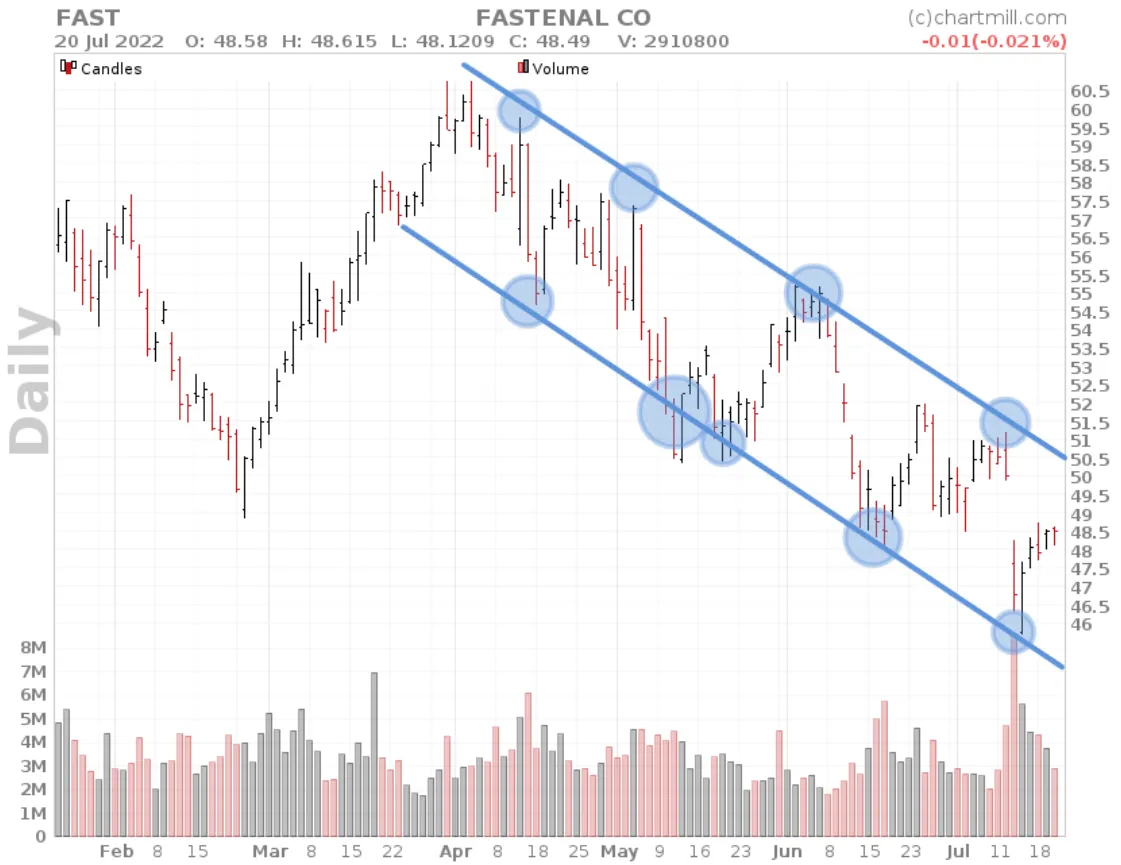
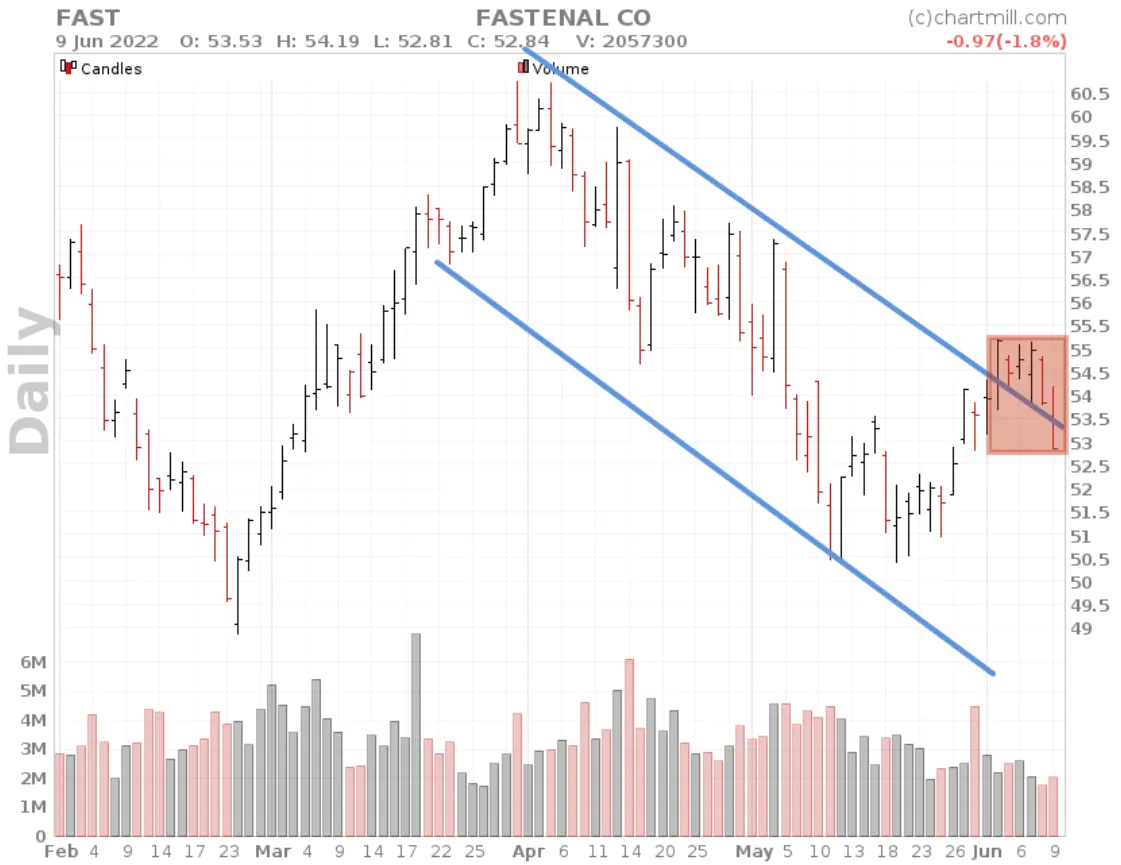
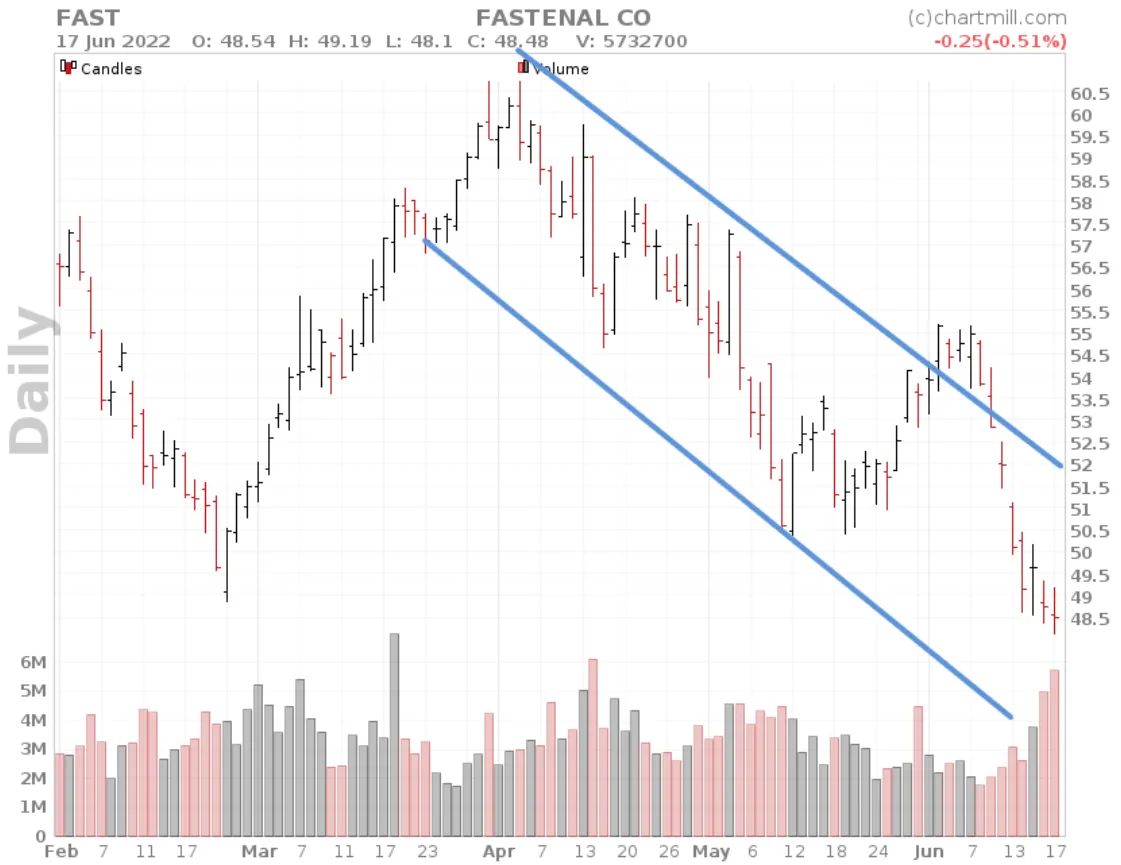
As with other technical patterns, you need to be aware of false breakouts. Such is the case in the example below in the Fastenal stock. A bullish breakout above the upper bearish trend line followed by a mini sideways range. The breakout lacked volume and momentum and as soon as the price closed below the trend line again, there was a significant chance that the downward trend would resume.
How to find Descending Price Channels?
The descending Price Channel is supported in our stock screener. On top of that ChartMill will also automatically draw the trendlines which make up the pattern. On the indicators tab you can just select 'Channel Down' from the 'Chart Patterns' filter on the 'indicators' tab. This is a direct link to the screen.