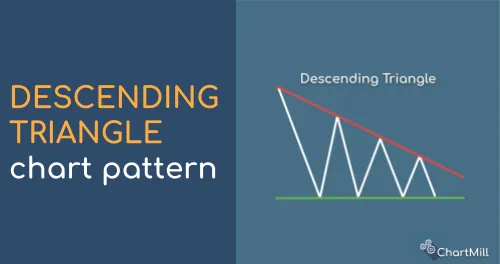
Descending Triangle Pattern
A descending triangle is a popular chart pattern used in technical analysis to identify potential price reversals or continuation patterns in the financial markets.
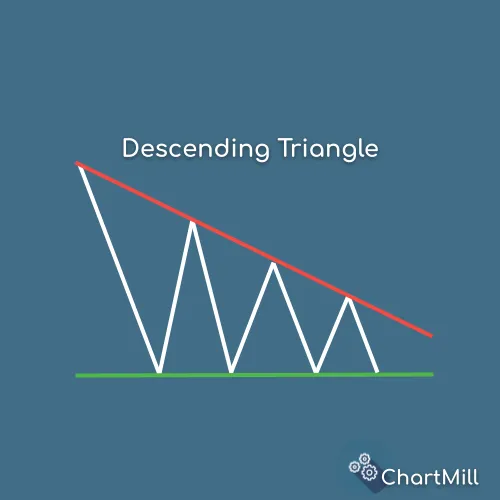
It is formed by drawing a horizontal line that connects a series of lower highs and a descending trendline that connects a series of equal or slightly lower lows.
The resulting pattern resembles a triangle slanting downward.
What Does a Descending Triangle Mean?
The descending triangle pattern suggests a potential bearish continuation or reversal in price trends. It typically occurs during a downtrend when sellers are in control, and the pattern signifies a period of consolidation before the price potentially breaks down further.
The lower highs indicate that selling pressure is becoming stronger, while the horizontal support line represents a level at which buyers are stepping in to prevent further declines.
Recognizing a Descending Triangle
Identifying a descending triangle pattern involves looking for the following characteristics:
Lower Highs
Locate a series of at least two consecutive highs that are lower than the previous high. Draw a trendline connecting these highs.
Horizontal Support
Find a horizontal line that connects two or more equal or slightly lower lows within the downward-sloping trendline.
Volume
Observe diminishing trading volume as the pattern develops. Typically, volume decreases during the consolidation phase of the pattern.
Duration
Consider the length of time it takes for the pattern to form. The longer the pattern lasts, the more significant its potential impact.
Trading Tactics for the Descending Triangle
Trading the descending triangle pattern requires careful analysis and the use of appropriate tactics.
Here are some subjects to consider:
Overall Market Conditions
Before trading the descending triangle pattern, evaluate the overall market conditions. Confirm that the broader market trend aligns with the bearish bias suggested by the pattern. This step helps avoid trading against the prevailing trend.
Wait for a Clean Breakdown
To avoid false signals, it's essential to wait for a clear breakdown of the horizontal support line. The breakdown should be accompanied by a significant increase in trading volume, indicating strong selling pressure.
Waiting for confirmation helps reduce the risk of entering premature trades.
Where to Enter?
Once the breakdown occurs, consider entering a short position slightly below the horizontal support line. This entry strategy allows for confirmation of the pattern and provides a buffer to reduce the risk of a false breakdown.
Placing a Stop-Loss
To manage risk effectively, set a stop-loss order above the descending trendline or the recent swing high. Placing the stop-loss at these levels helps protect against potential price reversals and limits losses in case of an unexpected upward move.
When to Exit?
Determining the exit point depends on the trader's goals and risk tolerance. One strategy is to set a profit target by measuring the vertical distance from the highest point of the triangle to the horizontal support line.
Another approach is to monitor price action and exit when signs of a potential price reversal or weakening selling pressure emerge.
Common Mistakes When Using This Pattern
When using the descending triangle pattern, traders often make some common mistakes. Recognizing and avoiding these errors can help improve trading outcomes.
Failing to Wait for Confirmation
One common mistake is entering a trade before the pattern confirms its validity. It's essential to wait for a clear breakdown below the horizontal support line and ensure that it is accompanied by increased trading volume.
Premature entries can lead to false breakouts and losses.
Neglecting Overall Market Conditions
Ignoring the broader market conditions is another mistake. It's crucial to consider the prevailing trend in the market. If the overall market is bullish, a descending triangle pattern may have a lower probability of success.
Aligning the trade with the broader trend can increase the chances of a successful trade.
Placing Stop-Loss Orders Incorrectly
Setting stop-loss orders is crucial for risk management. Placing the stop-loss order too close to the entry point may result in premature exits due to minor price fluctuations.
Finding an appropriate placement for the stop-loss order based on support levels or recent swing highs can help manage risk effectively.
Overlooking Volume Analysis
Volume analysis is an essential aspect of confirming the validity of the descending triangle pattern. A significant increase in trading volume during the breakdown adds credibility to the pattern.
Neglecting volume analysis may lead to false signals and misguided trading decisions.
Failing to Consider Price Targets
Having a clear price target is crucial for managing trades effectively. Traders often make the mistake of not setting a profit target or not considering the potential price movement based on the pattern's height.
Setting a reasonable profit target based on the pattern's vertical distance can help lock in gains and prevent greed-driven decisions.
Disregarding Risk Management
Proper risk management is a critical aspect of any trading strategy. Neglecting proper risk management techniques, such as position sizing and setting appropriate stop-loss orders, can lead to significant losses.
It's important to assess risk-reward ratios and ensure that potential profits outweigh potential losses.
By avoiding these common mistakes and incorporating sound risk management principles, traders can improve their decision-making process when utilizing the descending triangle pattern in their trading strategies.
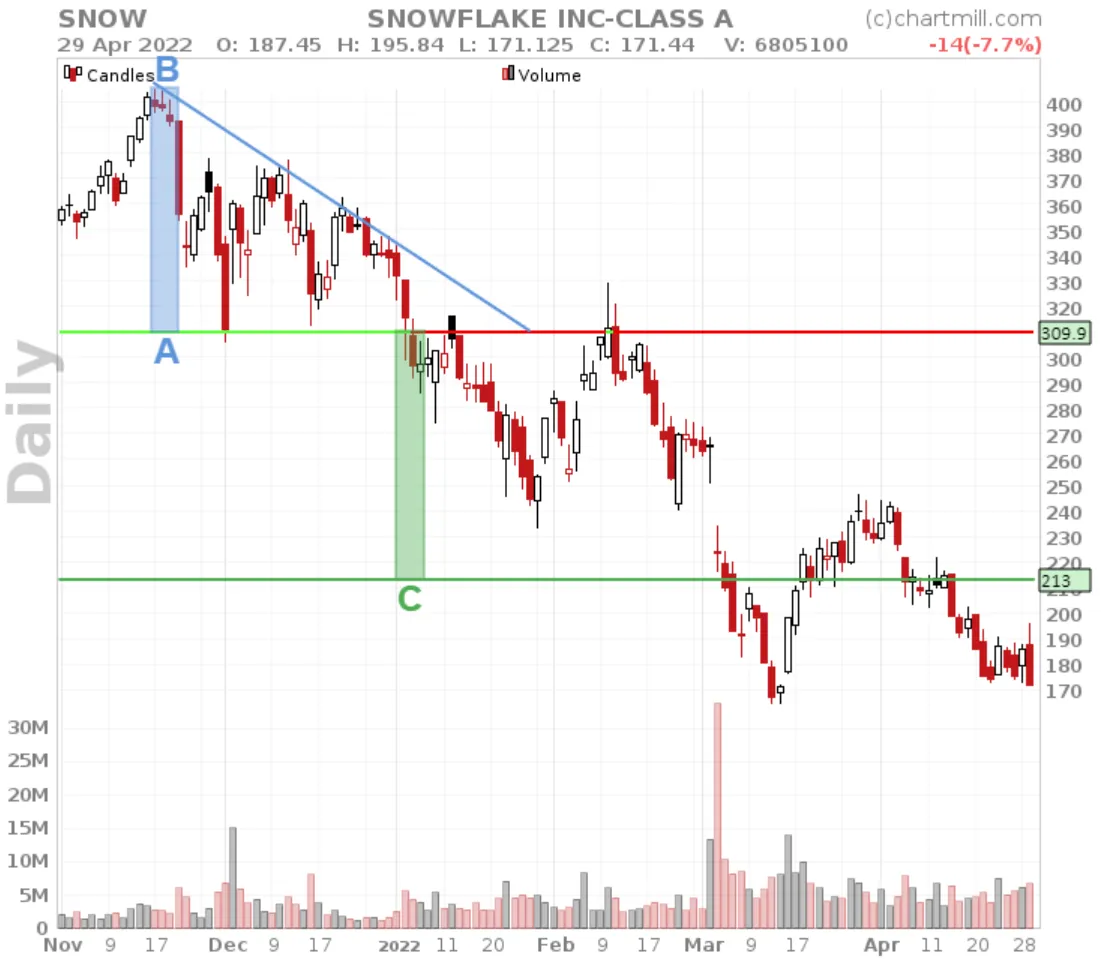
How to find Descending Triangle Patterns
The descending triangle pattern is supported in our stock screener. On top of that ChartMill will also automatically draw the trendlines which make up the pattern.
On the indicators tab you can just select 'Descending Triangle' from the 'Chart Patterns' filter on the 'indicators' tab. There is a fully configured screen available in our trading ideas section.
FAQ
How to Avoid False Breakouts?
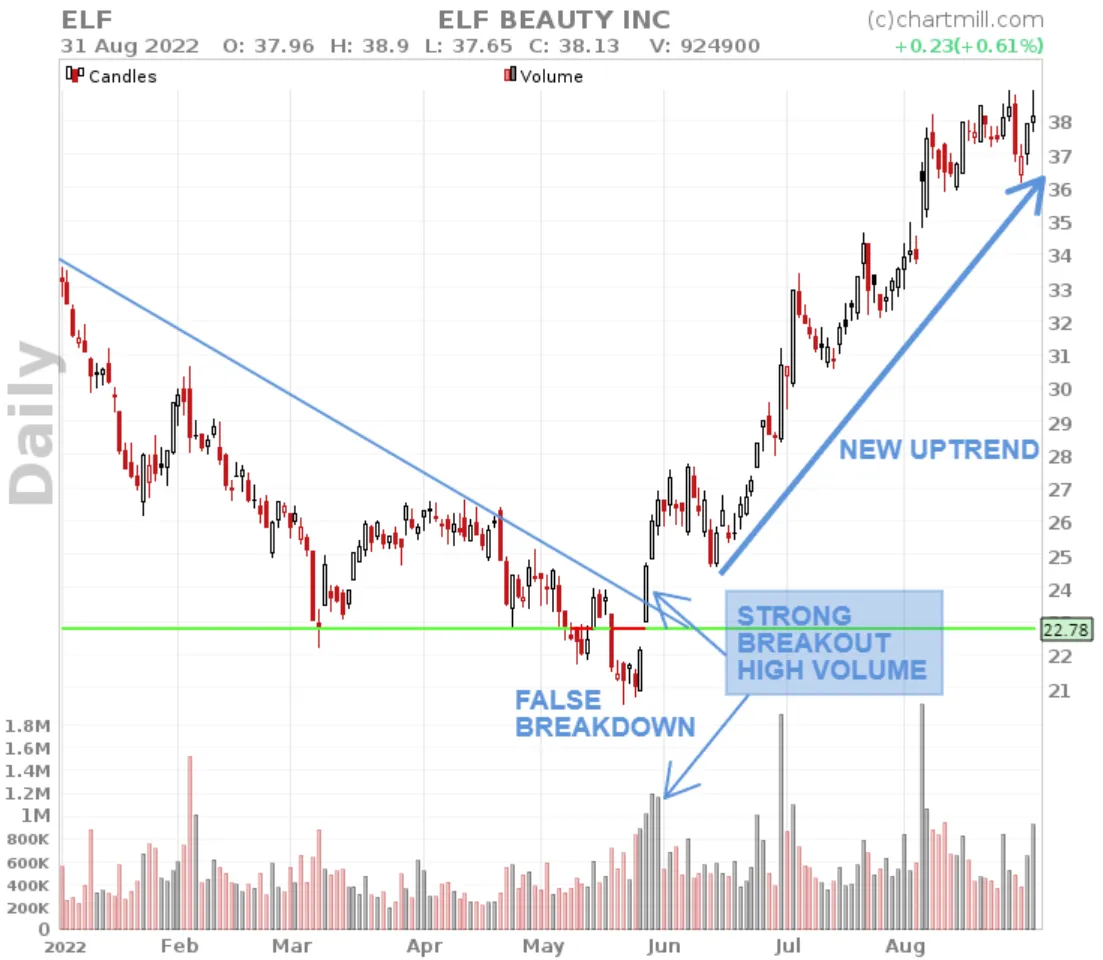
False breakouts occur when the price briefly moves below the horizontal support line but quickly reverses, trapping traders who entered short positions.
To mitigate this risk, wait for confirmation through increased trading volume and ensure the breakdown is significant and sustained.
Is a Descending Triangle Bullish or Bearish?
The descending triangle pattern is generally considered bearish. The series of lower highs and the breakdown below the horizontal support line indicate increased selling pressure and a potential continuation of the downtrend.
How Does a Descending Triangle Differ from a Falling Wedge?
While both patterns can suggest potential reversals, the key difference lies in their implications. A descending triangle is a bearish pattern that indicates a continuation of the prevailing downtrend, while a falling wedge is typically a bullish pattern that signals a potential trend reversal from a downtrend to an uptrend.
The falling wedge is characterized by a contracting range between two converging trendlines, with higher lows and lower highs.
How Reliable is this pattern?
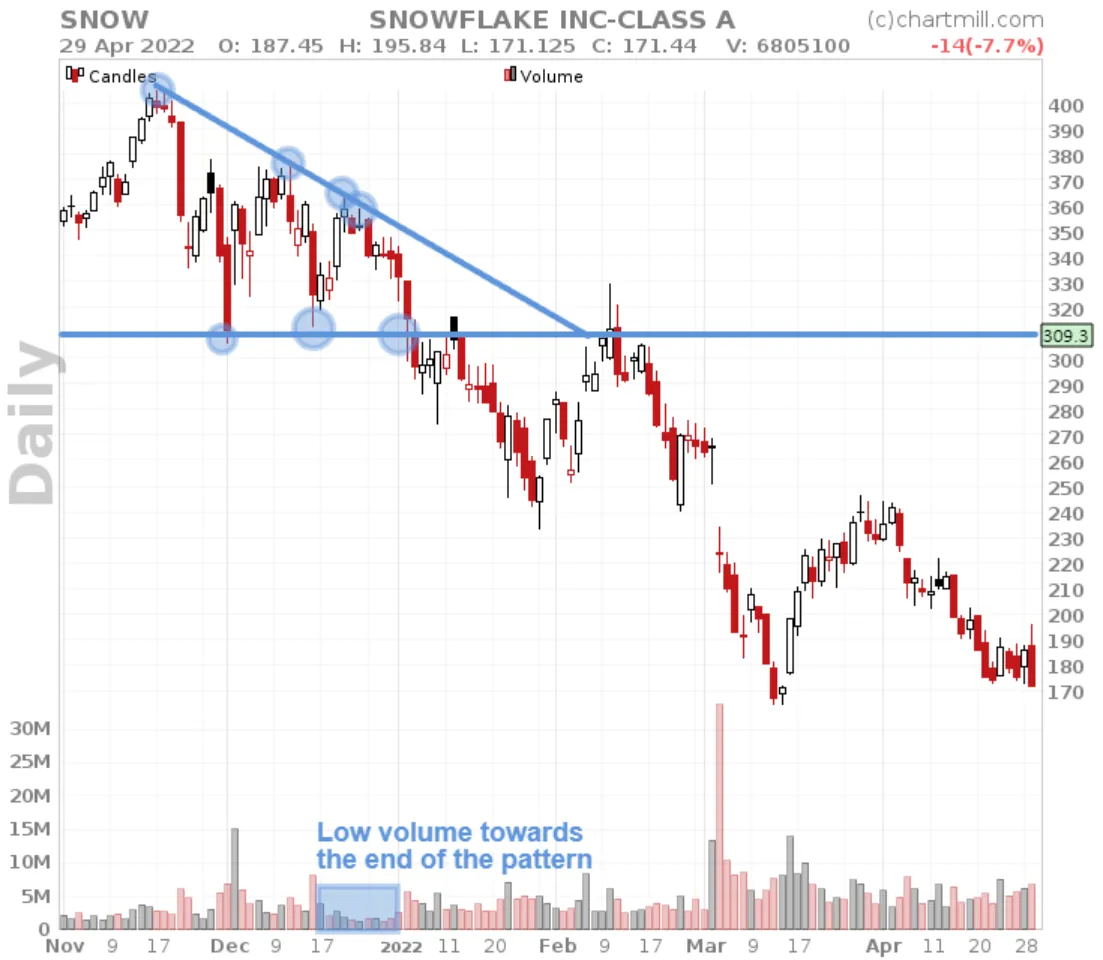
The more the descending resistance line and the horizontal support line are tested the more reliable the pattern becomes. The shape is also important, especially towards the end of the pattern the price channel should become increasingly narrow and the trading volume lower.
The more distinguished the pattern the more and faster it will be picked up by other technical swing traders who will recognize the setup as such and try to trade on it.
You may also be interested in
The Ascending Triangle Pattern | What is it? How to trade it?
An ascending triangle is a bullish continuation chart pattern that forms when there is a strong upward trend in the price of an asset. Read more...
Symmetrical Triangle Secrets: Enhancing Your Trading with Chart Patterns.
The symmetrical triangle pattern is considered neutral, therefore the probability of the pattern breaking out at the bottom or top is 50/50. Read More...
Triangle Chart Patterns
Triangle patterns are well-known chart patterns within the field of technical analysis. They exist in different formations, bullish, bearish or symmetrical. Read more...