Symmetrical Triangle Secrets: Enhancing Your Trading with Chart Patterns.
What Is a Symmetrical Triangle?
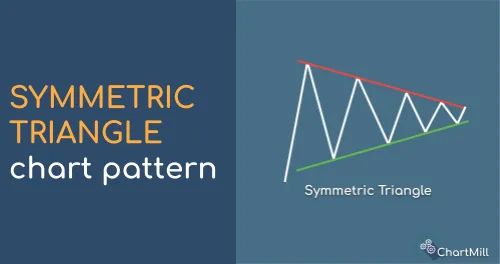
A symmetrical triangle is formed by drawing two converging trendlines, with the upper trendline connecting the series of lower highs and the lower trendline connecting the series of higher lows.
It is a common chart pattern in technical analysis that represents a period of consolidation and indecision between buyers and sellers.
How This Pattern Emerges
-
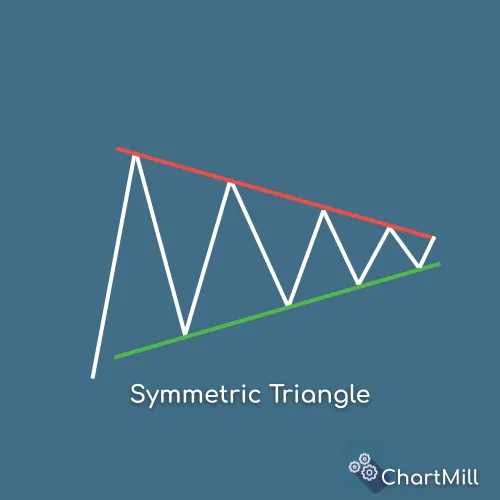
The symmetrical triangle pattern is formed by two converging trendlines.
-
The upper trendline connects a series of lower highs, while the lower trendline connects a series of higher lows.
-
As the pattern progresses, the range between the trendlines narrows, indicating decreasing price volatility.
-
The convergence of the trendlines creates a point known as the apex.
-
The duration of the pattern can vary, lasting from a few weeks to several months.
-
The decreasing volatility within the pattern signifies potential energy building up for a potential breakout.
-
The breakout can occur in either direction, leading to a significant price move.
Main Features To Keep In Mind When Using The Symmetrical Triangle Pattern
-
Both trend lines must converge and connect a series of consecutive tops and bottoms.
-
Both trend lines must have more or less the same slope.
-
During the formation of this pattern, volume decreases.
-
The upward or downward breakout is characterized by a clear sharp increase in volume.
How To Interpret a Symmetrical Triangle Pattern
Symmetrical triangles - unlike the other triangle patterns - are not typical continuation patterns. They can just as easily herald the beginning of a new trend. This is because the symmetrical triangle pattern is neutral, due to the converging lines that form the pattern.
Thus, the pattern can be used in either direction:
-
A downward breakout through the lower ascending trendline marks the beginning of a downtrend. Either as a continuation of an already existing downward long-term trend or as a reversal signal after a previously upward long-term trend.
-
An upward breakout through the upper descending trend line marks the beginning of an uptrend. Either as a continuation of a pre-existing long-term rising trend or as a reversal signal after a previous long-term falling trend.
How To Use This Pattern In a Trading Strategy?
Breakout trading is a common strategy used by traders to capitalize on significant price moves that occur after a period of consolidation, such as the symmetrical triangle pattern.
It involves waiting for a decisive price breakout above the upper trendline or below the lower trendline of the symmetrical triangle pattern.
Entry and Stop-loss
The most obvious way is to enter the market as soon as the breakout occurs. You can either take a position during the breakout itself (1) or wait until after the confirmation, i.e. a close below or above one of the converging trend lines (2).
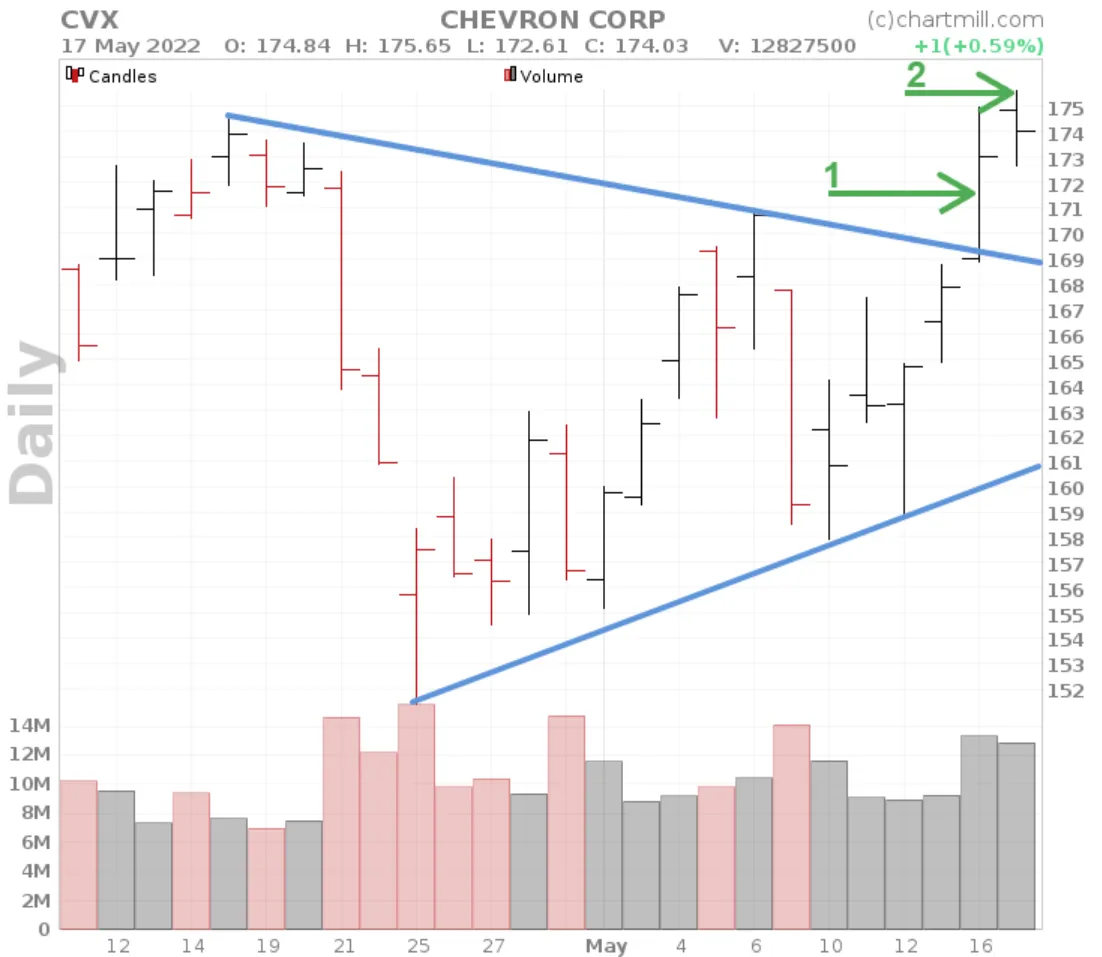
The chance of a false breakout is higher if you are entering the market when the breakout is still in progress. The advantage is that if the breakout continues your entry will be better than if you wait for confirmation.
Where you place the stop-loss depends very much on the way you trade, so an unequivocal answer is impossible. However, if you are a swing trader who wishes to hold positions for several days or weeks, at least try to make sure that you give the price enough room for price fluctuations. A good and objective tool is the average true range indicator which gives you a picture of the prevailing volatility and calculates the average daily movement. If you hold positions overnight, it is best to keep a minimum stopping distance of 2ATR.
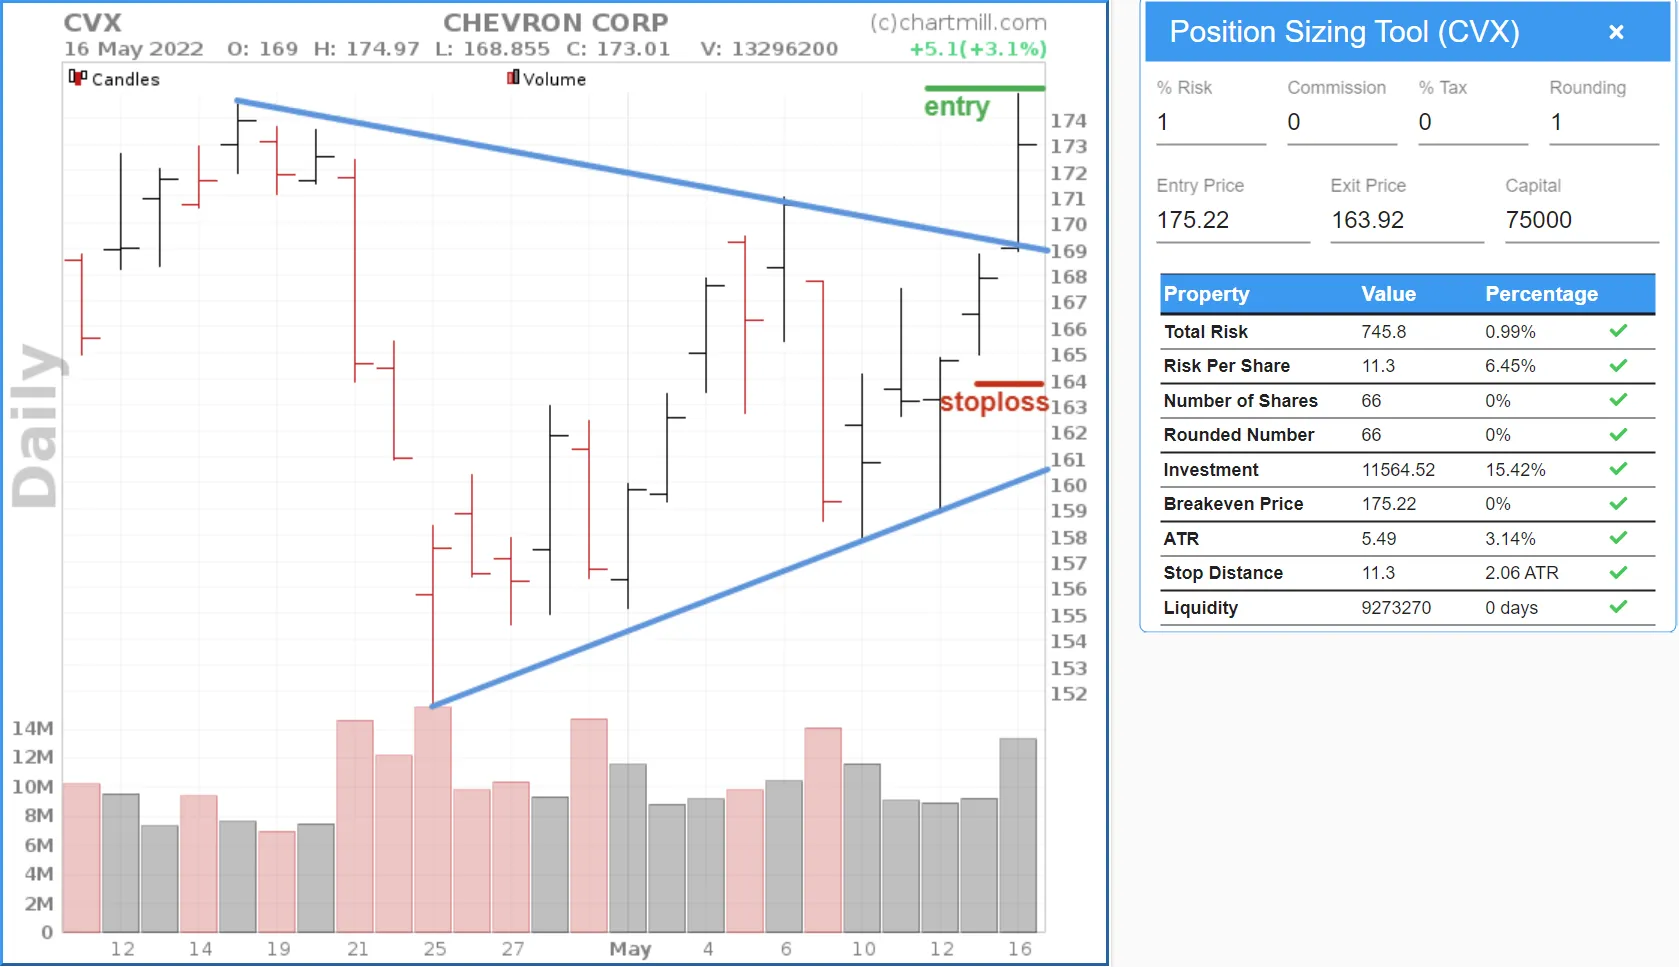
You can easily check this using the position sizing tool available by default in ChartMill.
The example below shows a setup where a position will be opened if the high of the last candle is broken ($175.22) with an initial stop-loss at $164.78. The PST tool indicates that in that case, the stop distance is 1.9 ATR large. Because the ATR stop distance is less than 2, a warning appears.

If we keep the entry the same but lower the stop-loss a bit to $164.78, the warning disappears because this brings the stop distance to 2.06 ATR.
Price Target
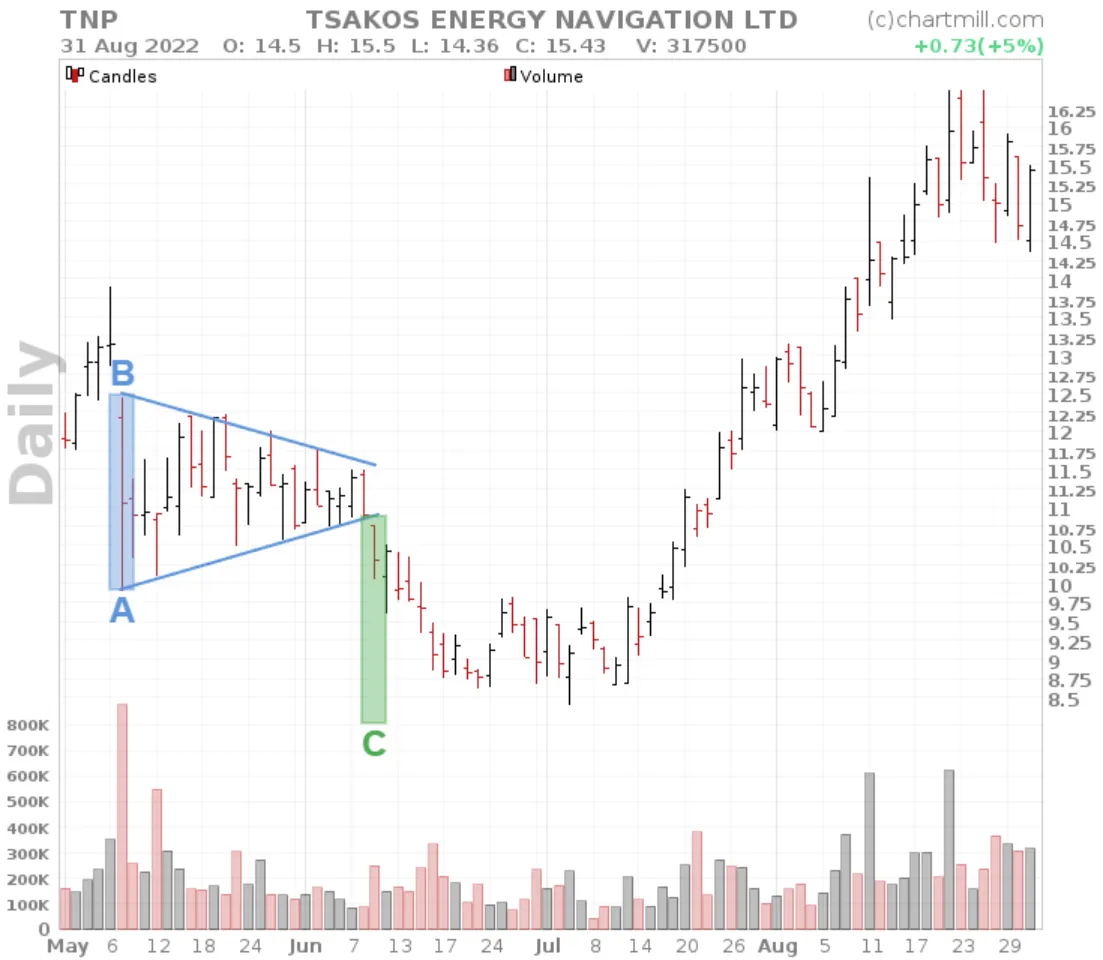
Typically, the difference between the lowest point (A) and the highest point of the pattern (B) is used to determine the distance to the price target 'C'. Below is an example of such a target projection for Tsakos Energy Navigation Ltd. (TNP). In this case, the projected price target was never reached and TNP made a huge reversal move.
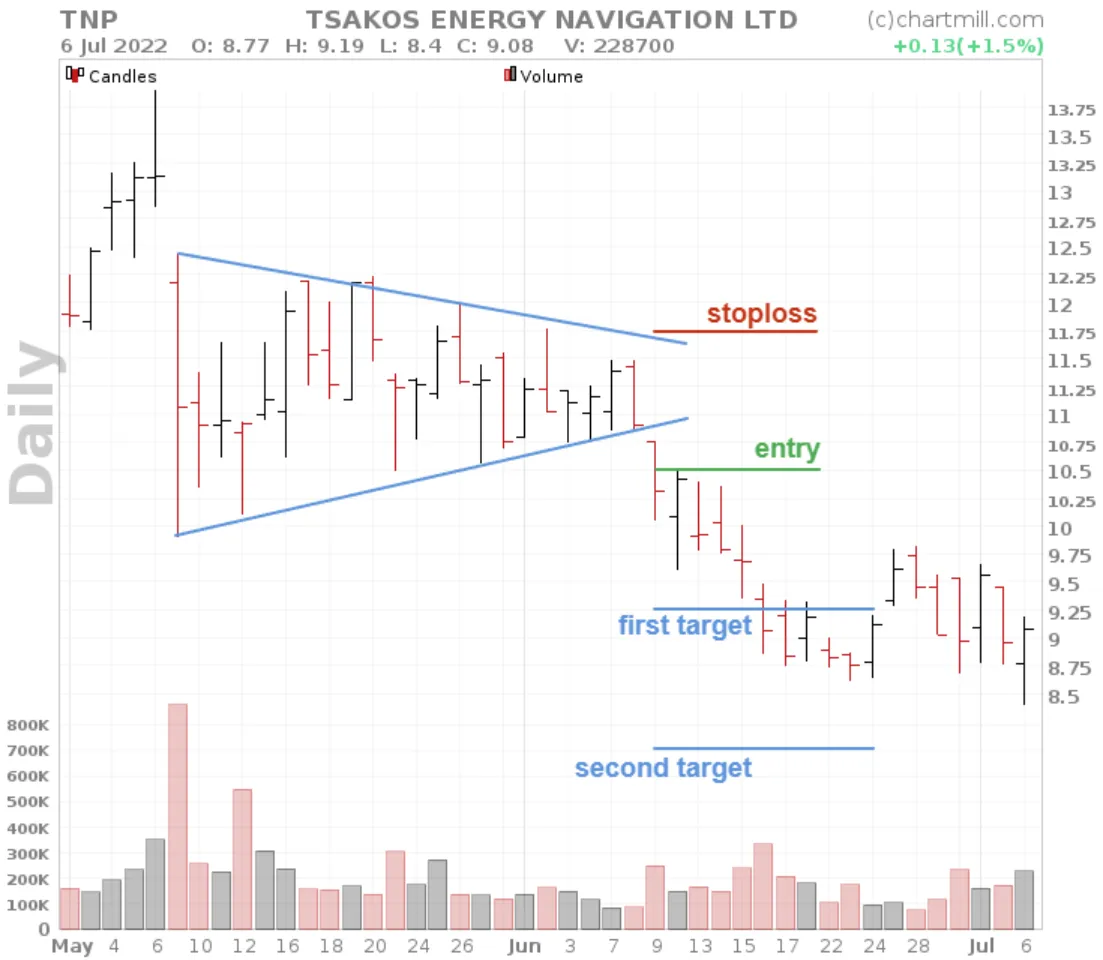
Another and better way to determine the price target is to take into account the stop-loss used and start determining your first and possibly second target on that basis.
In the example below, the first price target and the stop-loss are at an equal distance from the entry which gives a risk/reward of at least 1 to 1. The second price target is situated at twice the stop distance.
If in this case, you had placed the stop-loss at breakeven as soon as the first target was reached then this position would eventually have been stopped out at breakeven (assuming you enter and exit with the entire position each time).
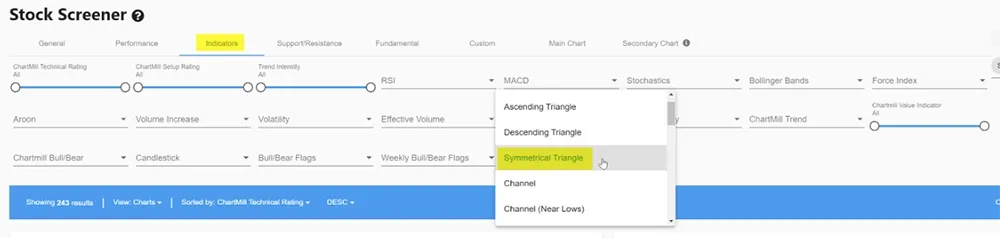
Symmetrical Triangle Pattern Stock Screener
The ChartMill Stock Screener supports finding symmetrical triangle patterns. On the indicators tab you can just select 'Symmetrical Triangle' from the 'Chart Patterns' filter on the 'indicators' tab.
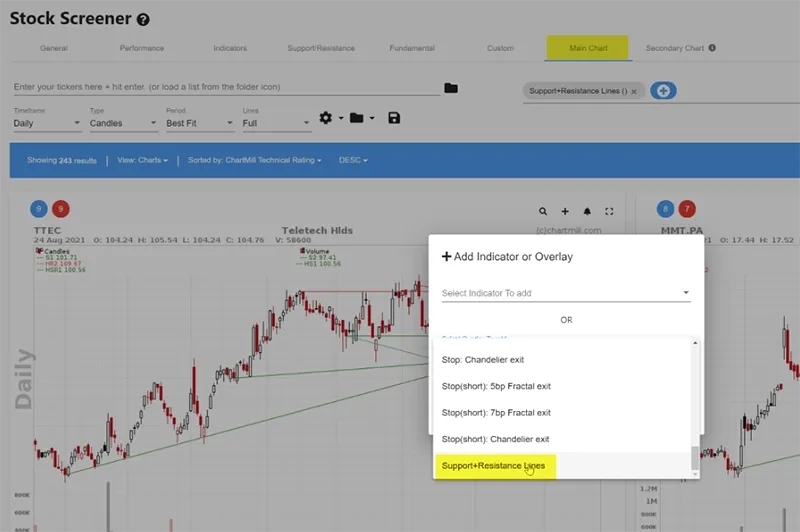
To make the trend lines visible that form the pattern, select the option 'support + resistance lines’ in the main or secondary chart.
There is a fully configured screen available linked to this article. This is a direct link to the screener.
Related Content
The Ascending Triangle Pattern | What is it? How to trade it?
An ascending triangle is a bullish continuation chart pattern that forms when there is a strong upward trend in the price of an asset. Read more...
The Descending Triangle Pattern
It is formed by drawing a horizontal line that connects a series of lower highs and a descending trendline that connects a series of equal or slightly lower lows. Read More...
Triangle Chart Patterns
Triangle patterns are well-known chart patterns within the field of technical analysis. They exist in different formations, bullish, bearish or symmetrical. Read more...