Cup and Handle Pattern
In this article
- What exactly is a Cup and Handle Chart Pattern?
- Rules for the Cup and Handle formation
- Cup and Handle breakout
- How to trade the Cup and Handle pattern?
- Cup and Handle pattern stop loss levels?
- Price targets for the Cup and Handle pattern
- Cup and Handle trade example
- A few details to keep in mind
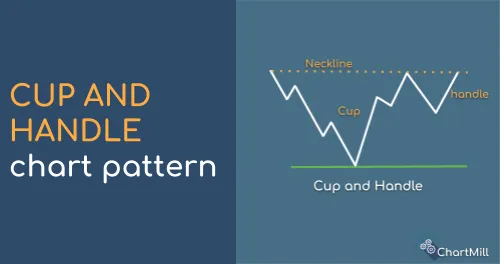
What exactly is a Cup and Handle Chart Pattern?
The cup and handle chart pattern was first discussed in the book "How to Make Money in Stocks," by William J. O'Neil. A 1988 book by the well-known investor William O'Neill, founder of the CANSLIM method.
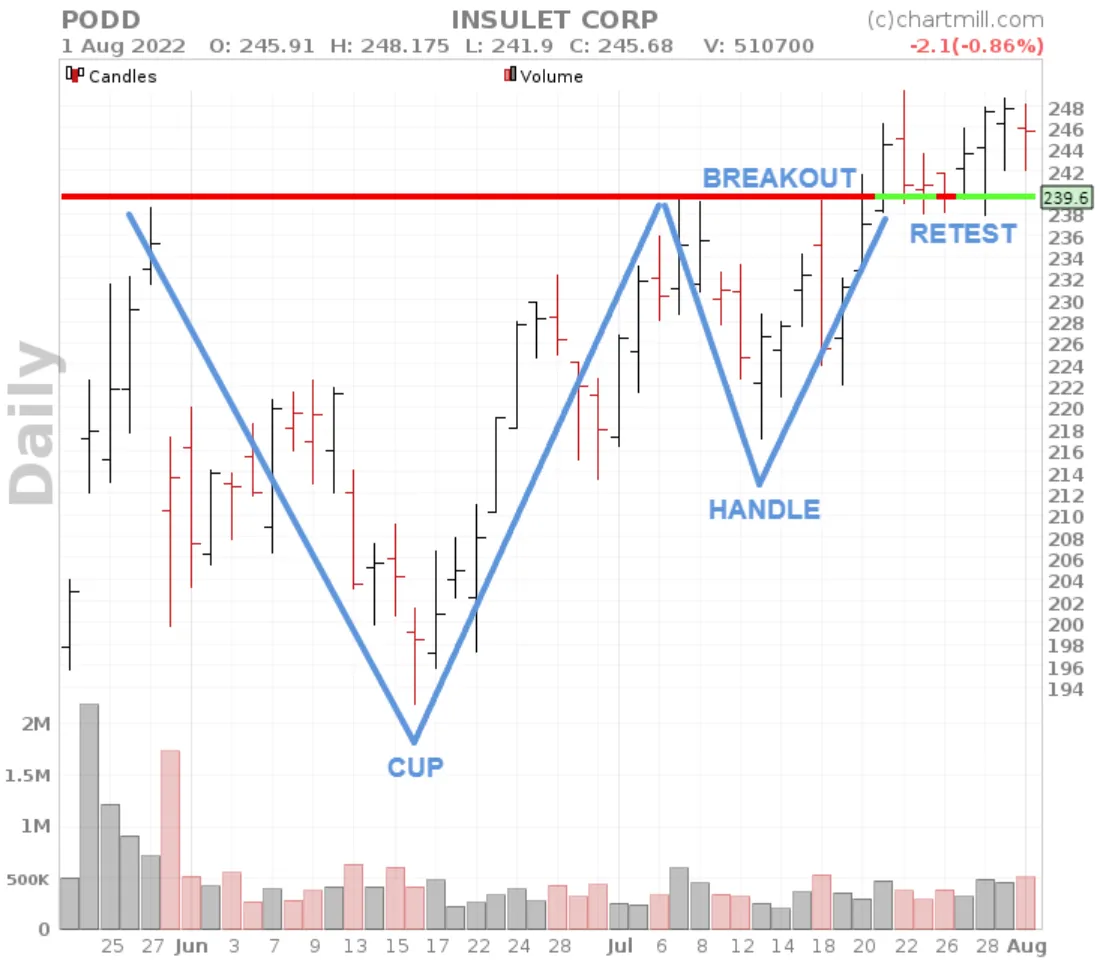
This chart pattern is a bullish continuation pattern that resembles a cup with a handle. Thus, it consists of two parts, each with separate characteristics. The cup itself comprises the largest part, this is the base U-shape formed by a double price top acting as a resistance level. To its right, the handle is shaped next where the price makes a small pullback movement to finally break out above the resistance.
Rules for the Cup and Handle formation
- The cup itself must have a clear bottom, a sudden and violent V-shape reversal does not qualify to be retained as a cup.
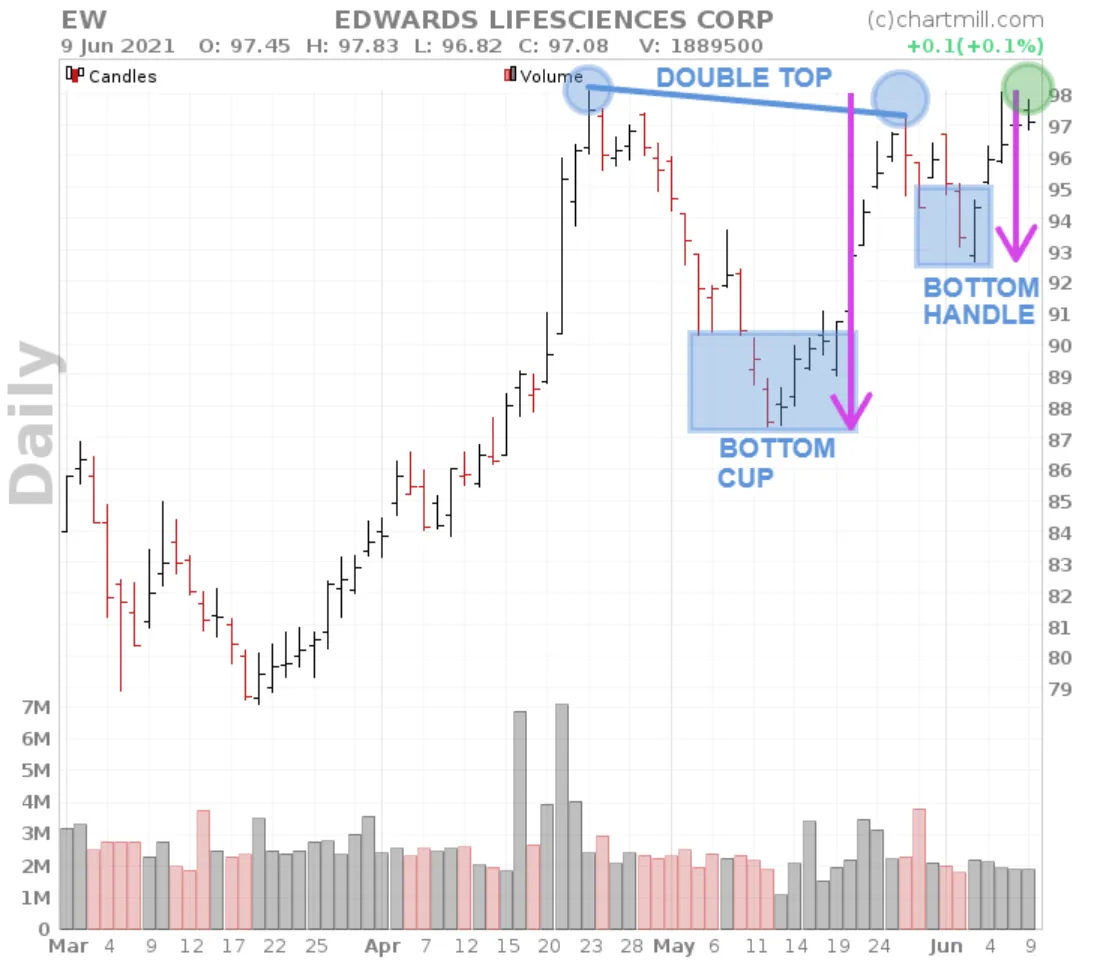
- The double top of the cup itself should not be exactly the same but clearly identifiable. A clearly lower or higher top nullifies the pattern.
- The handle should be clearly distinguished from the cup by the presence of a bottom and the eventual price recovery to the existing resistance.
- However, the price decline of the handle should be limited in the process. As a guideline, half the cup can be used as the maximum lower limit for the handle, otherwhise the pattern becomes invalid (purple arrows on the chart).
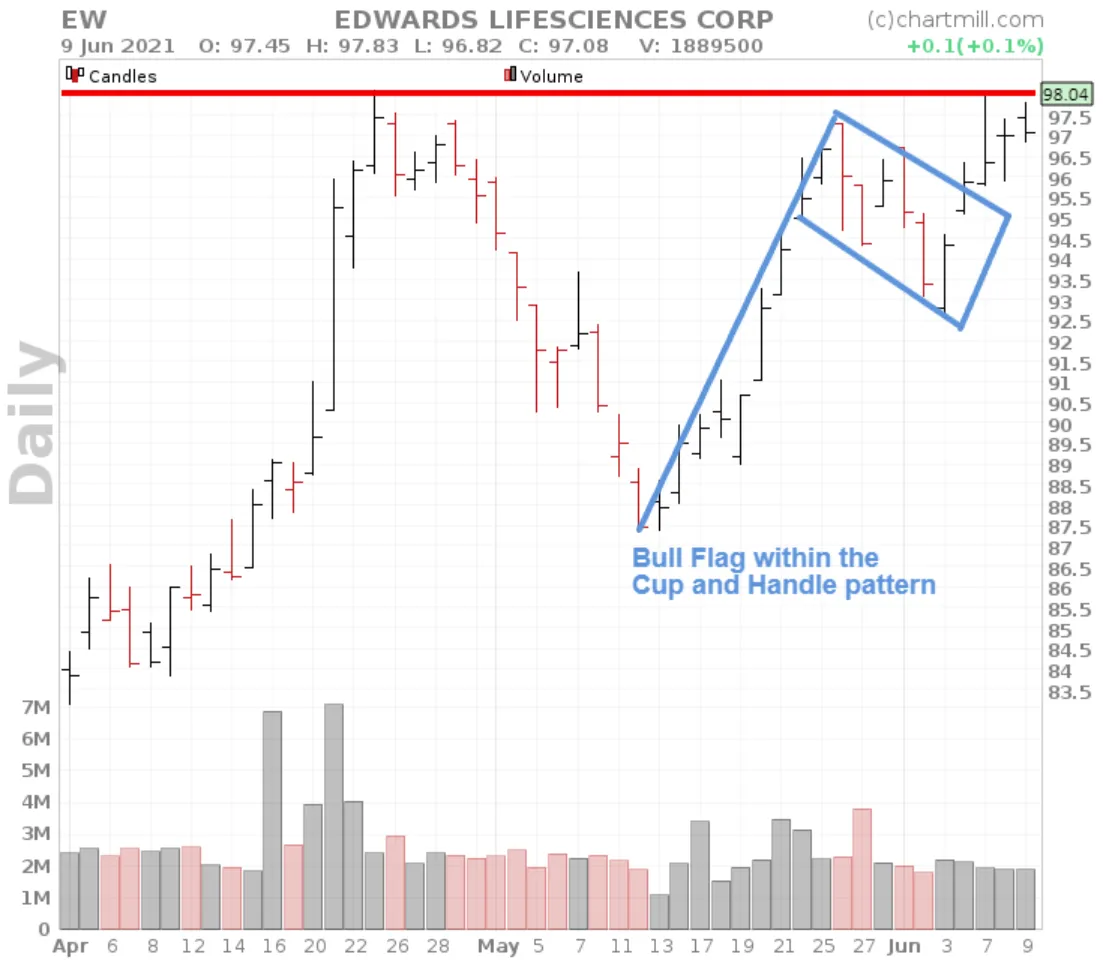
Good to know: In the cup and handle pattern you will very often recognize a clear bullish flag pattern in the transition from the cup to the handle.
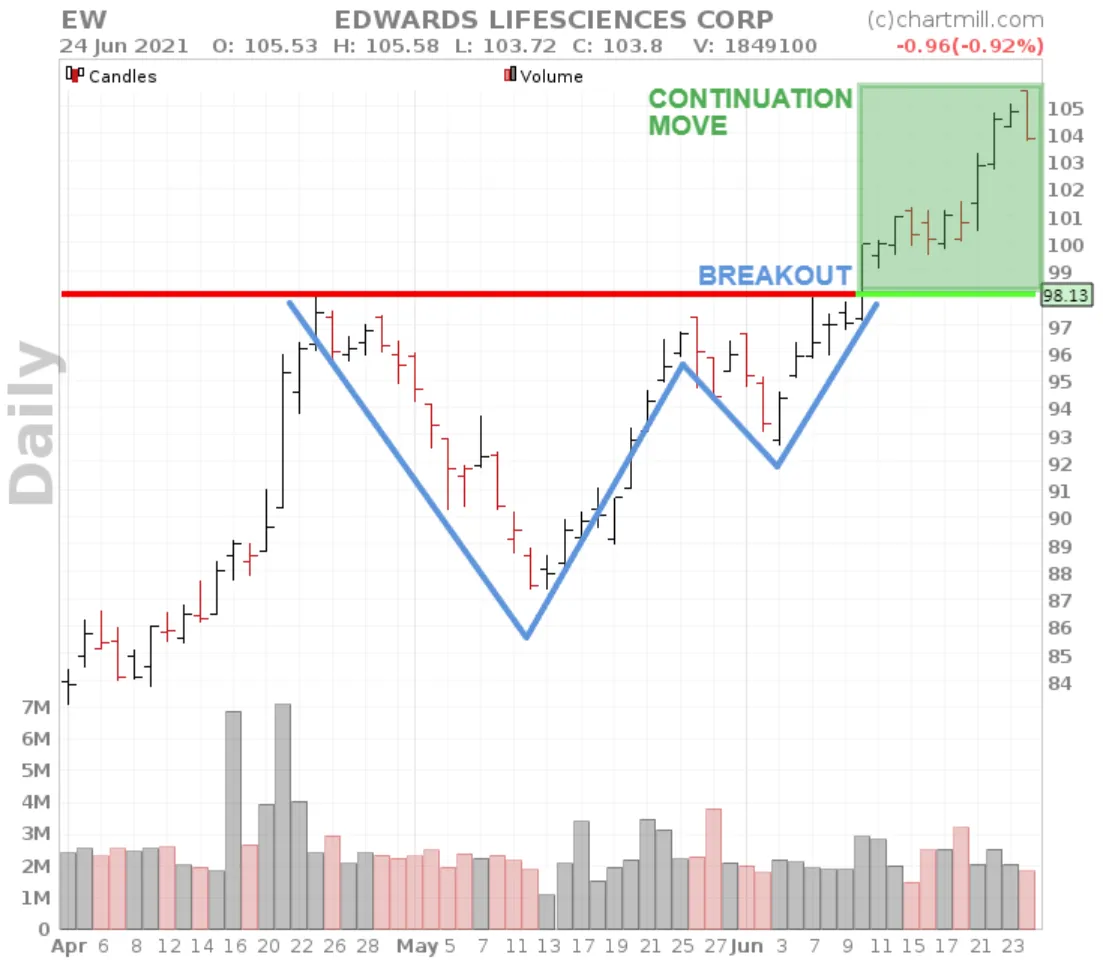
Cup and Handle breakout
The breakout from the handle above the double top of the cup is considered a buy signal. It is assumed that the bullish trend will continue. What is important here is that it happens with sufficient buying volume. The more volume and momentum the more powerful the movement and the greater the chance that the movement will effectively continue after the initial breakout.
How to trade the Cup and Handle pattern?
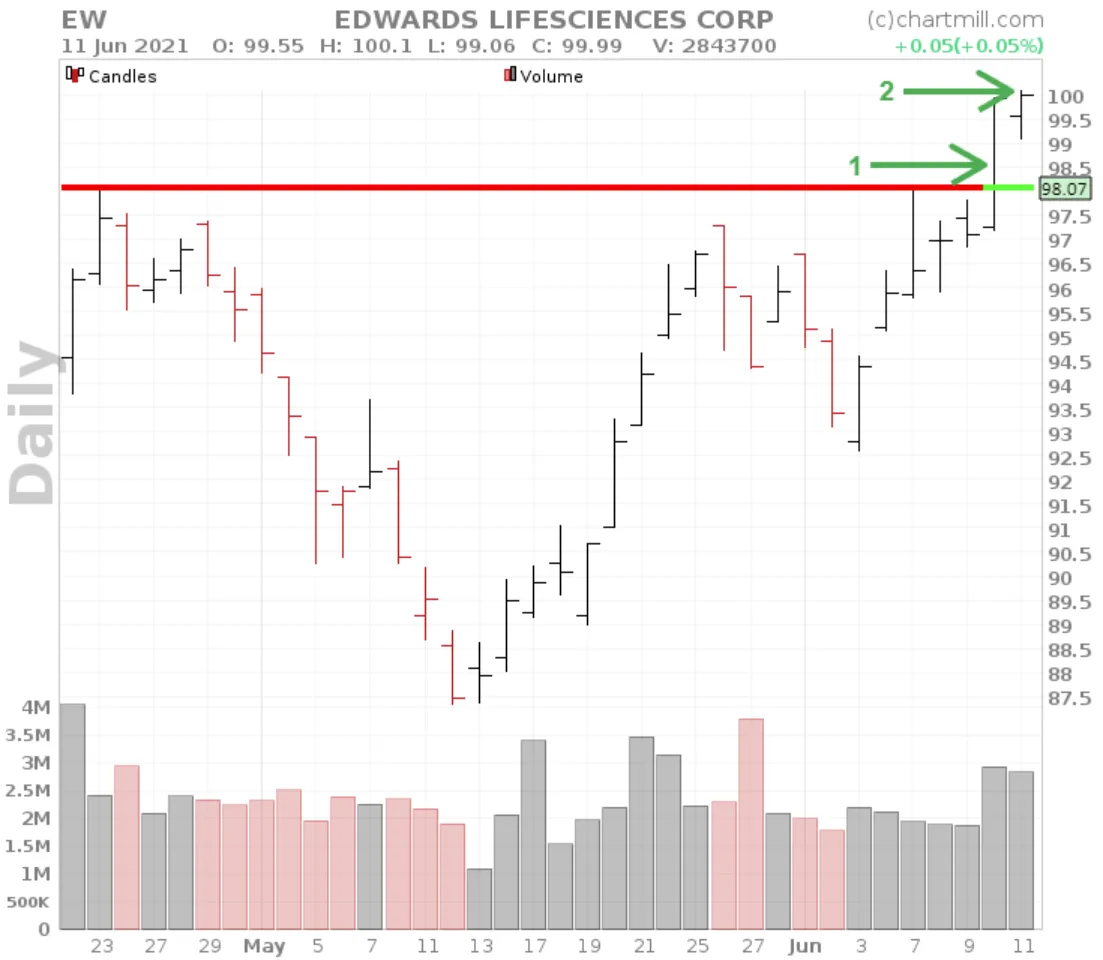
The classic cup and handle pattern is bullish, i.e. there is an attempt to go long on an upward breakout. As with other chart patterns, there are two ways to react to the breakout. Either you try to anticipate the breakout (1) by placing a long order just above the existing resistance line. As soon as the price rises above it, your buy order will be triggered. This is the most aggressive approach, it assures you that you will enter a position as soon as the price breaks out, even if it turns out to be just another retest of the existing resistance and the price falls back again (false breakout).
The alternative and more cautious way (2) is to wait until a clear close above resistance is visible. You can also take the shape of the candle itself and the volume associated with it into consideration. A strong bullish bar with a close above existing resistance on the high of day with clearly increased volume are the most ideal circumstances to put a buy order ready for the start of the next trading day.
Finally, there is also the option not to enter a position during the initial breakout but to wait for a retest of the breakout level. This is the most defensive way to use this pattern. However, keep in mind that this approach neither gives certainty regarding the direction of the price. The retest itself could just as well be the beginning of a counter-movement that pushes the price back into a downtrend.
Cup and Handle pattern stop loss levels?
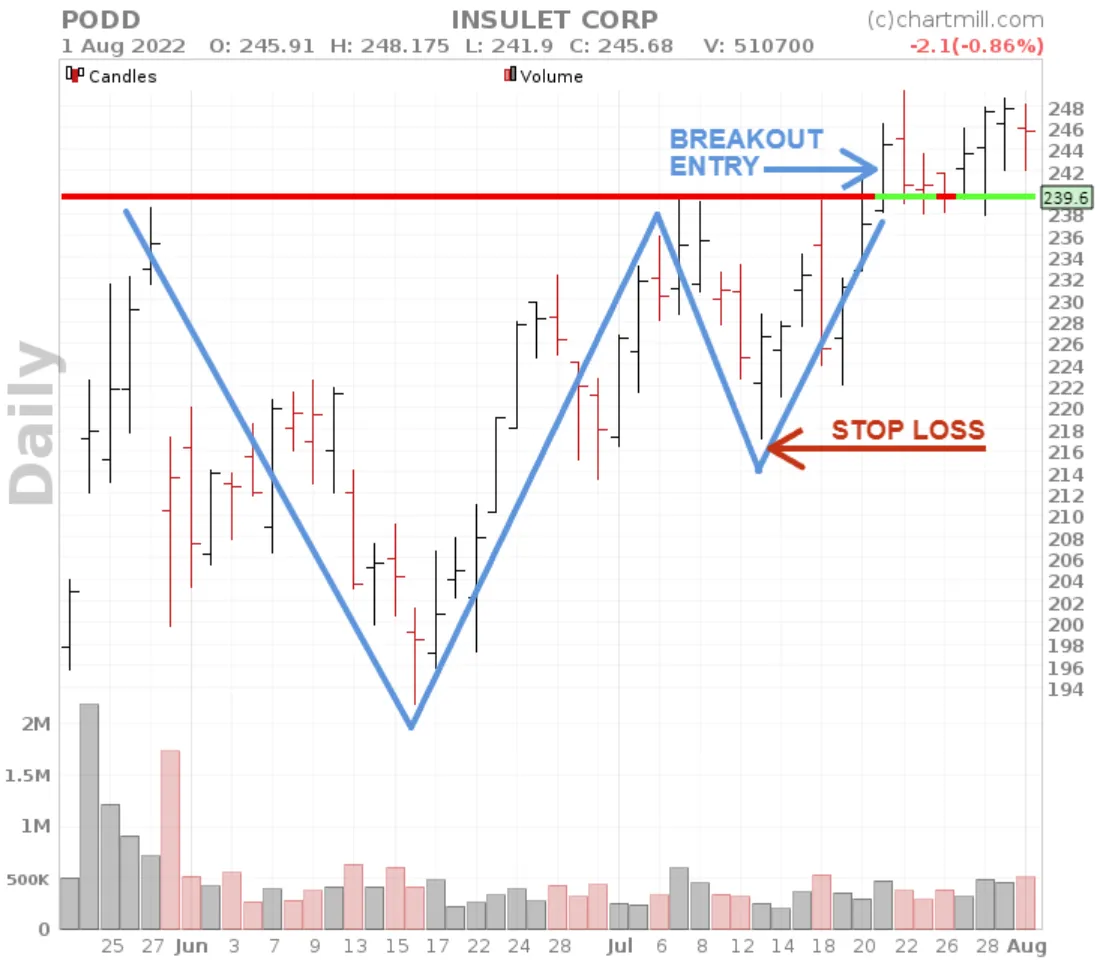
Not all breakouts will be a success, which is why you should always protect your position with a stop loss. With the cup and handle pattern, the initial stoploss will by default be placed below the low of the handle.
This standard rule applies to those who hold positions overnight such as swing traders and position traders. Day traders should rather base their stop loss based on the timeframe on which they are effectively trading.
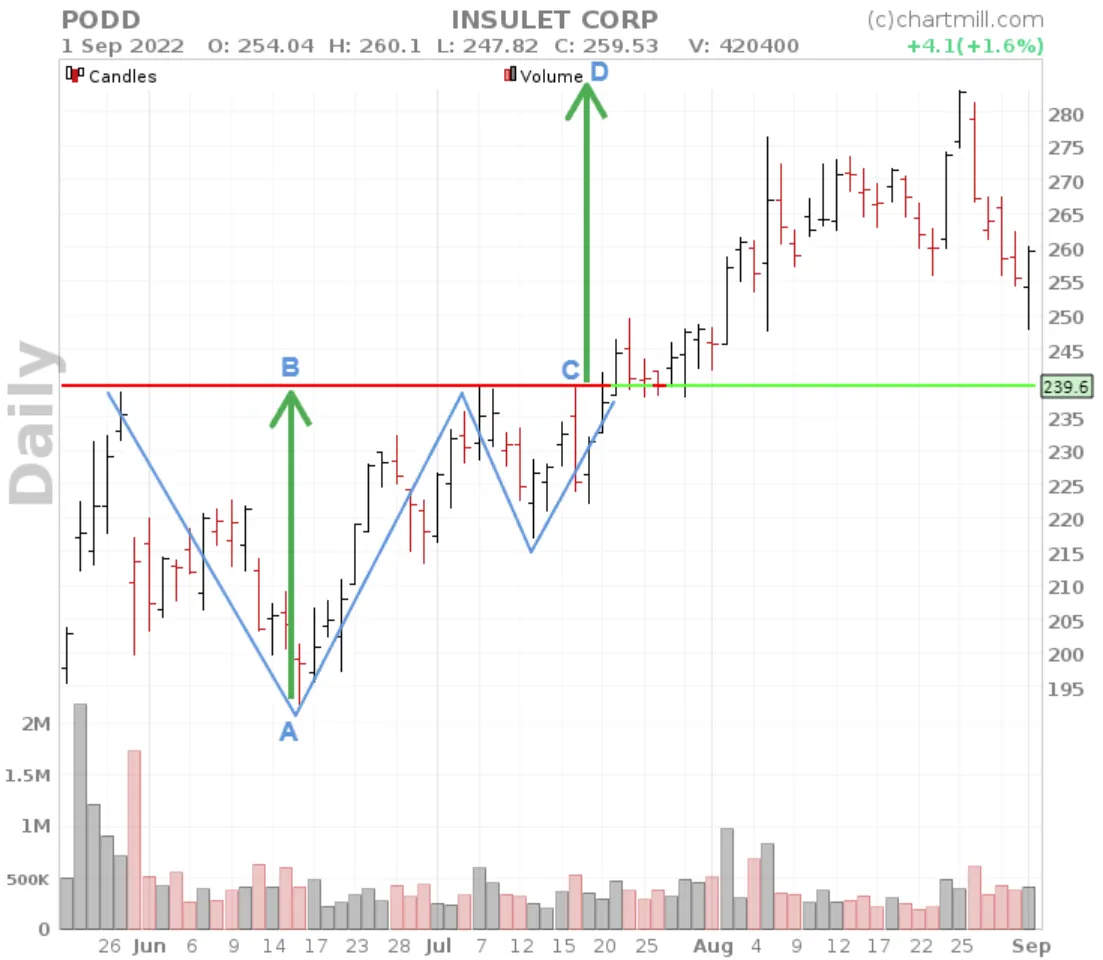
Price targets for the Cup and Handle pattern
The price target is determined by the distance between the highest and lowest points of the cup. The same distance is used from the breakout level to determine the first target.
In general this will mean that you will usually use a risk/reward ratio of 2/1 since one of the basic rules is that the low of the handle may not exceed 50% of the total cup distance.
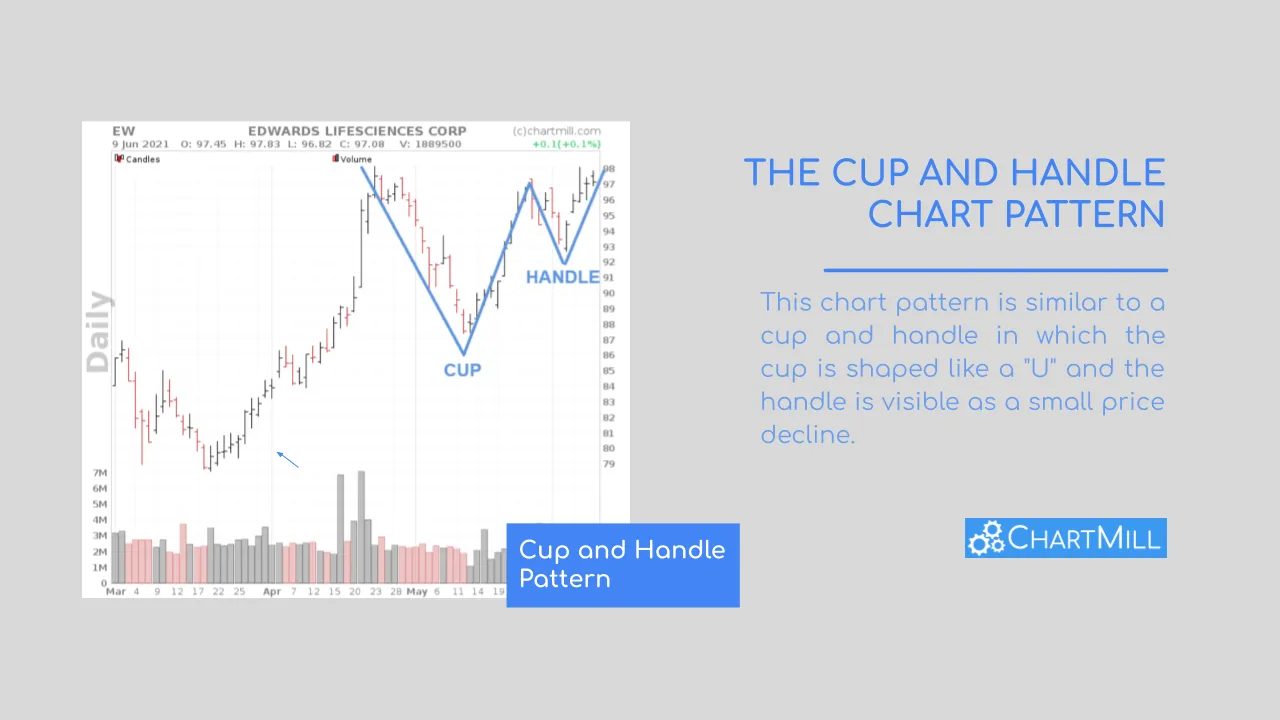
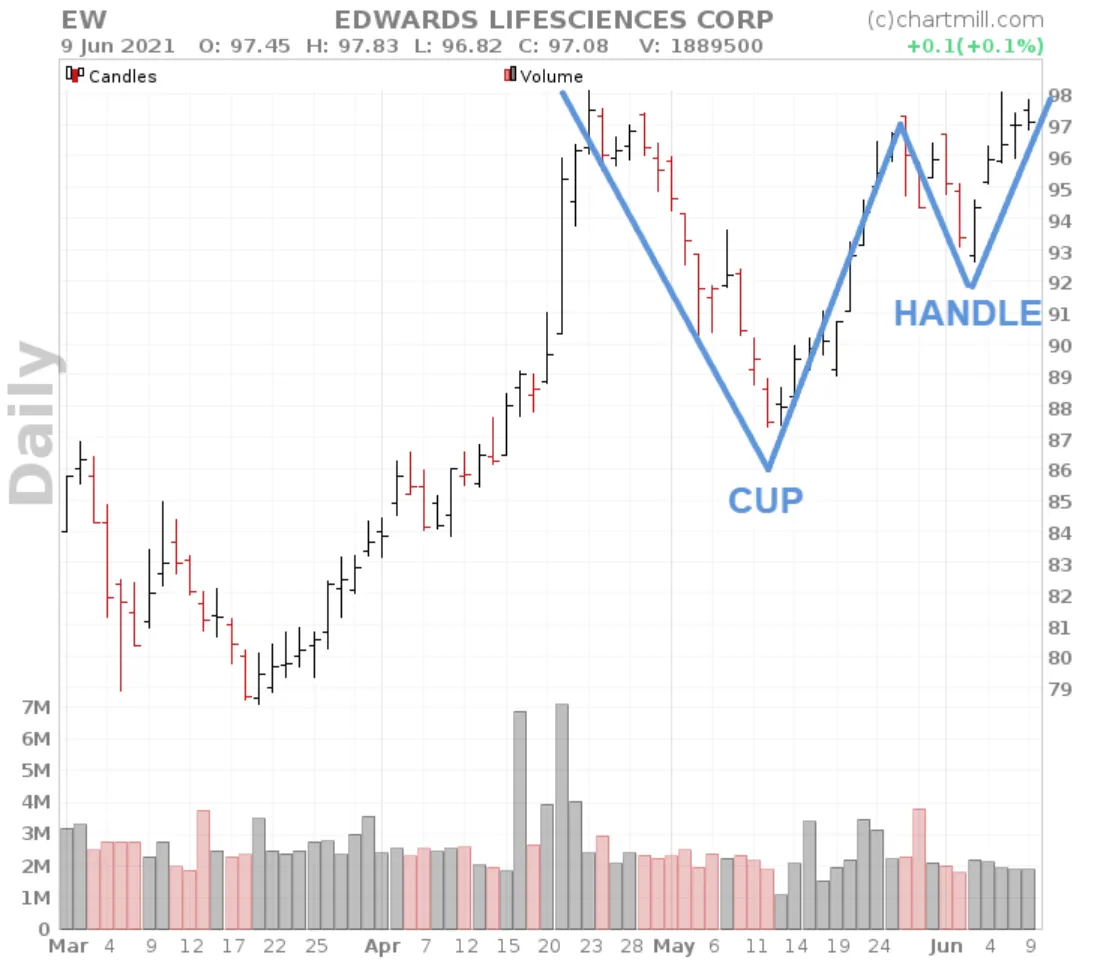
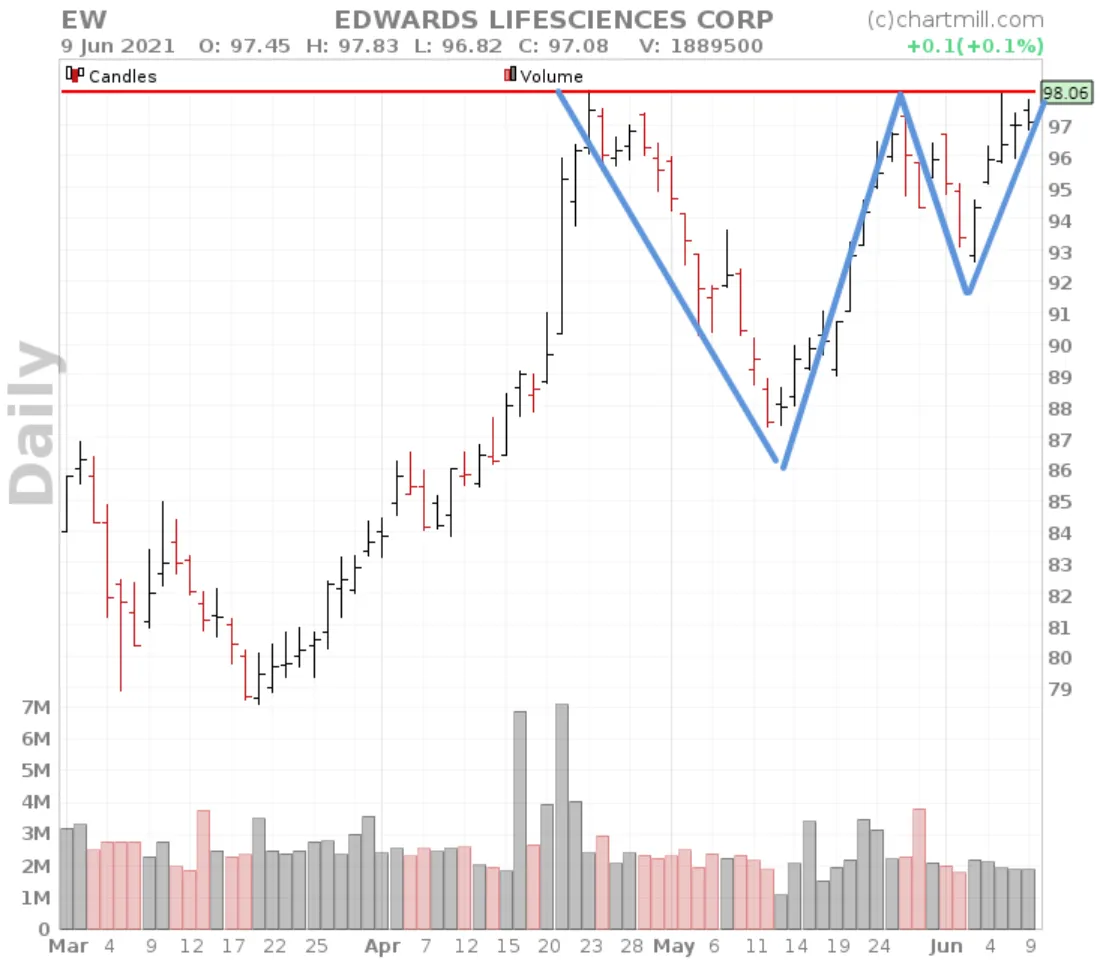
Cup and Handle trade example
As an example, we take the chart of the Edwards Lifesciences Corp. stock on date of June 09, 2021 in which there is a Cup and Handle pattern since the end of May 2021.
Longterm Trend
Because we are referring to a bullish continuation pattern, it is important to always keep an eye on the long term trend of the stock. Before we can withhold the pattern we need confirmation that the long-term trend of the stock is positive. The timeframe for determining the long-term trend depends on the timeframe on which you trade. In this example, we assume the daily chart on which the pattern is visible (this is also the timeframe on which we trade), the weekly charts are used for identifying the long-term trend.
Below is the weekly chart of the ticker EW showing the ChartMill Trend Indicator.
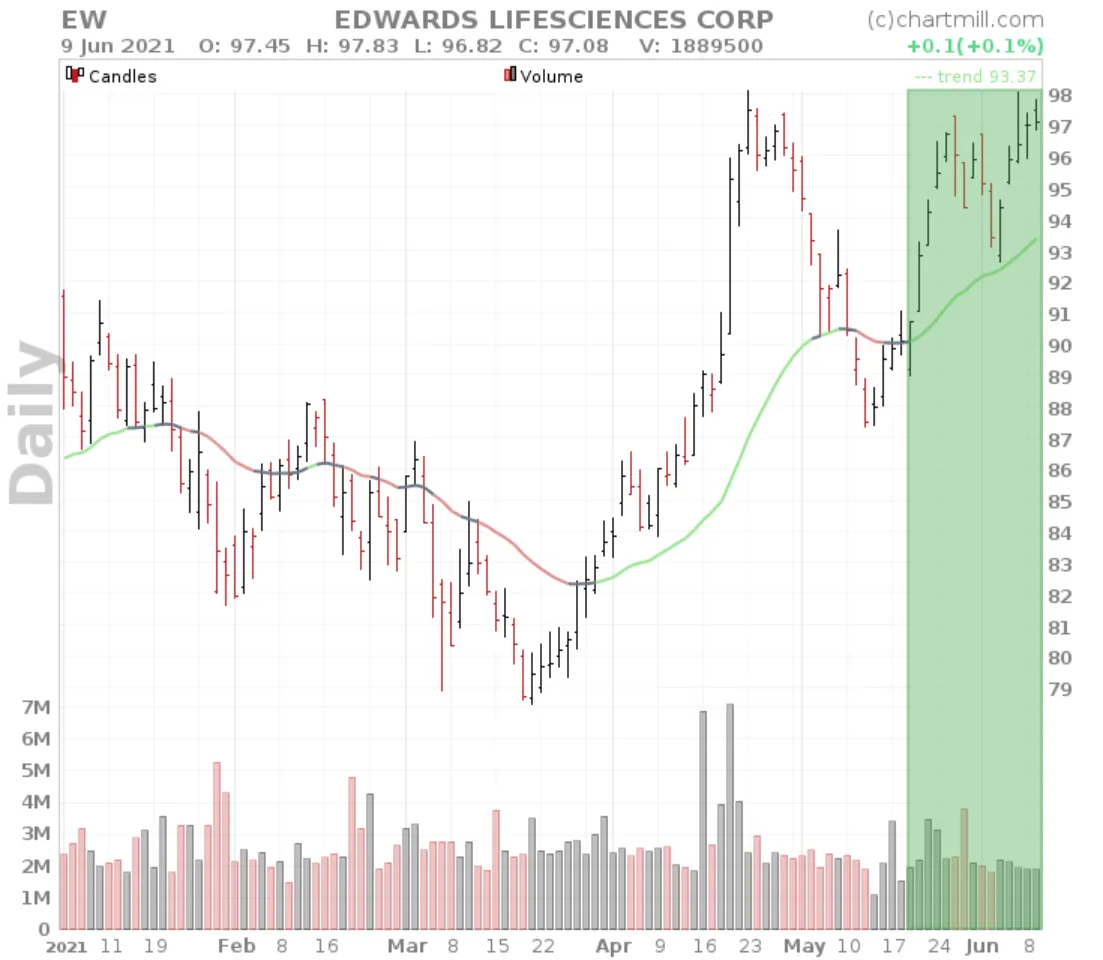
You can either put the ChartMill Trend as an overlay directly on the chart or as an indicator below the price chart. The interpretation is simple, green is positive, red is negative and gray is neutral. On the weekly chart above, we notice that the long-term trend is positive since the beginning of April 2021. So we have confirmation that the Cup and Handle pattern on the first chart is occurring in a long-term bullish trend. In other words, there is a green light to withhold the pattern for a potential longsetup. In terms of trading setups, there are two basic options for taking a position based on this pattern.
Entry Management
Option 1 - Long Entry during the breakout candle
The first option will involve entering the market at the time of the breakout. A conditional order will be entered into the market even before the breakout is visible.
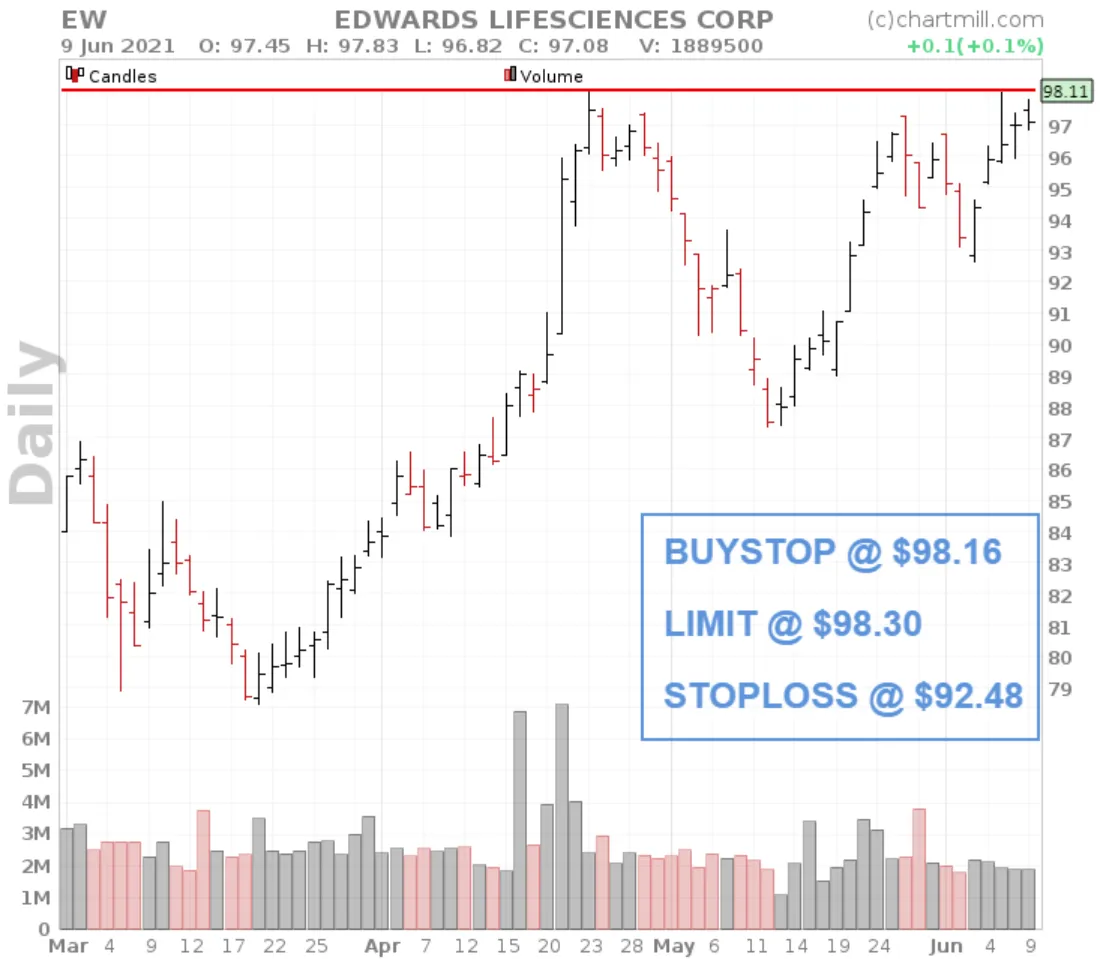
However, the buy stop limit order will only be effectively executed if the price reaches the $98.16 level with a limit at $98.30. A buy stop order has the advantage that you only buy if the trend continues. The associated ‘limitorder’ condition offers the advantage that we are protected should the price suddenly open significantly higher, also known as a gap up. If we only place a buy stop @ market and the price unexpectedly opens 10% higher the next day, our buy stop order will be executed at this high price.
The stoploss is placed below the second part of the chart pattern (below the ‘Handle’). This is a fairly large stoploss as this setup speculates on a breakout above the existing resistance which, however, has not yet occurred.
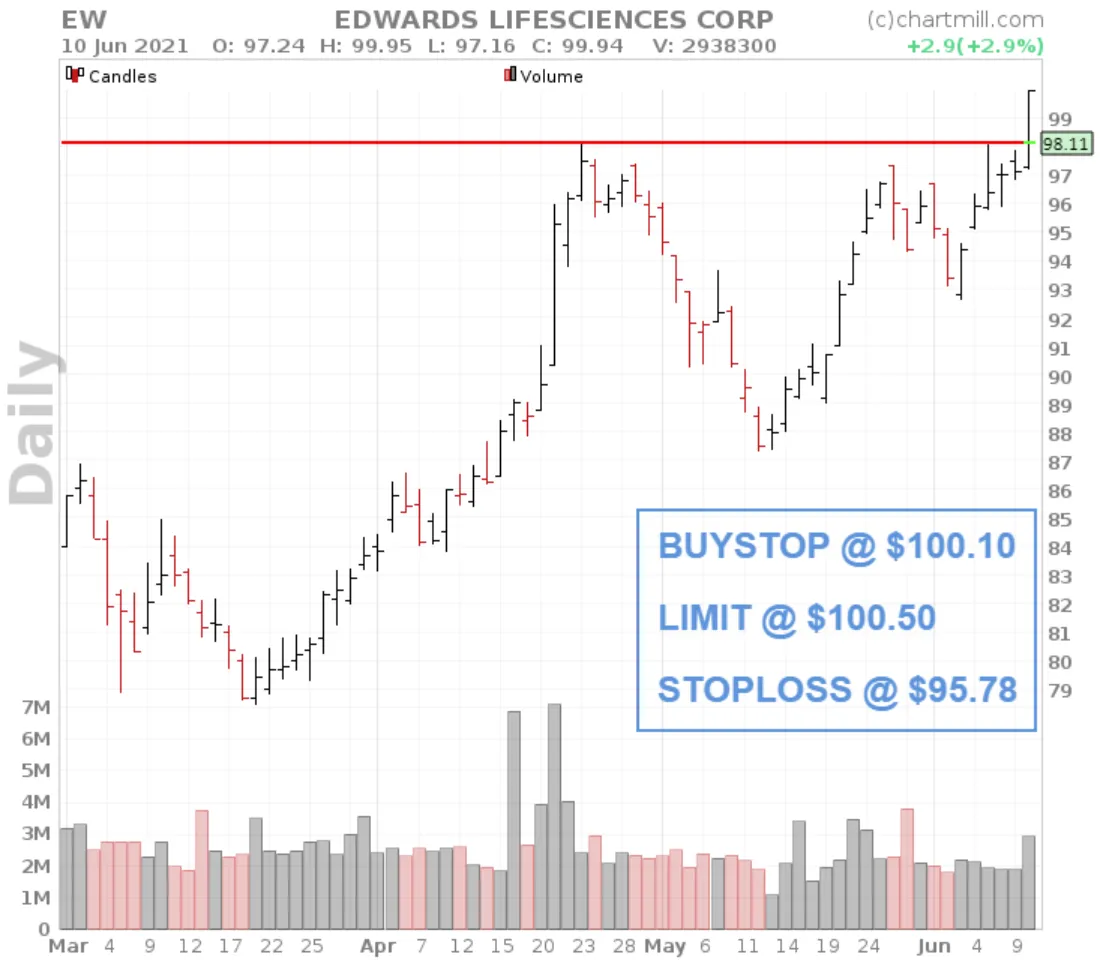
Option 2 - Long Entry after the breakout candle is visible.
For option 2, we wait until the breakout has effectively occurred. An order is then set up for the next trading day.
With a high at $99.95, we do not want to enter the market until the price effectively breaks through the $100 barrier. We set a buystop limit order at the price level $100.10 with a limit at $100.50.
Exit Management
If the price evolves in a positive way, it is at least as important to protect the accumulated profits. For this too, there are several possibilities. Below we discuss 3 alternatives:
Option 1 - Price Target
For the active traders who like to know in advance where the position will be closed there is the possibility to use a predefined price target. By default 1 time the distance in height of the cup is taken.
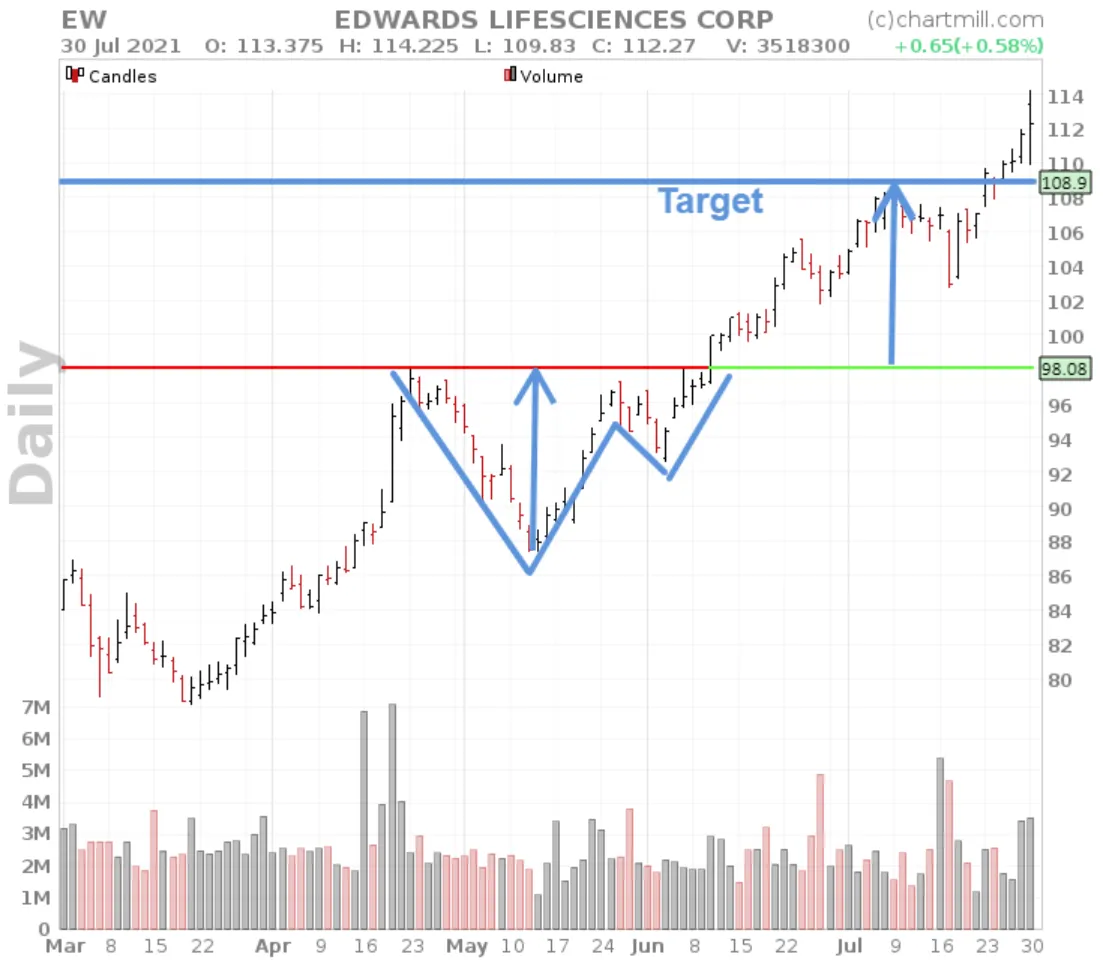
Still, it’s not a good idea to just adopt this as a standard. Much depends on the initial risk taken. If, for example, you use a first stoploss just below the ‘handle’ of the formation, best case you will end up with an R/R (Risk/Reward) of 2. If, however, you only take a long position after the break-out candle and then place a shorter stoploss below the break-out candle, in the same case you can count on an R/R of about 3 (for the same price target).
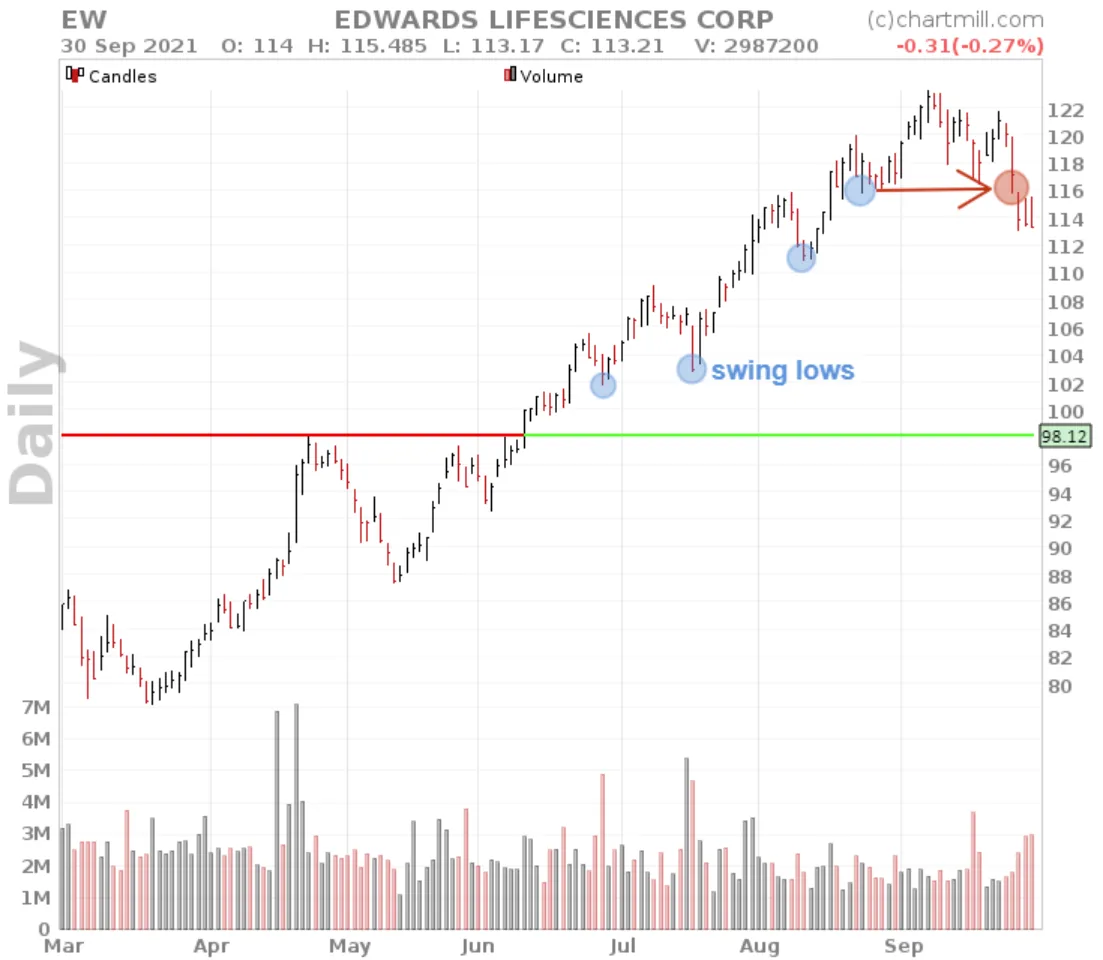
Option 2 - Swing Lows
This kind of exit management will sound familiar to trend traders. The stoploss is always increased on the basis of the last formed swinglow. The only disadvantage is that in case of strong increases with a lot of momentum, whereby no higher bottom is formed during a longer period, the stoploss can get quite far from the current price and therefore a considerable part of the accumulated profit is not protected.
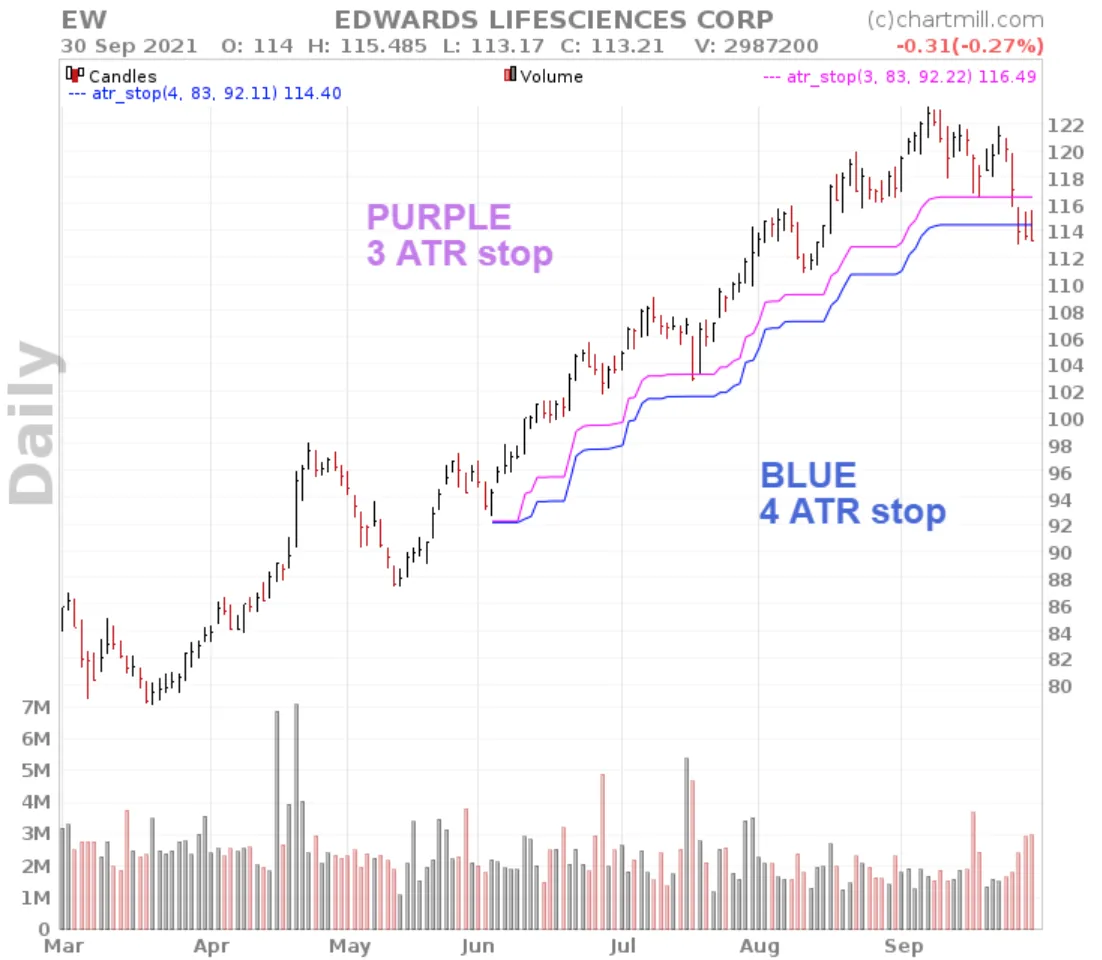
Option 3 - ATR based
Why the ATR is a good indicator for determining a stoploss, you could already read in this article. In short, the ATR is a volatility indicator, which takes into account the movement of a stock. If the share moves a lot, the ATR-based stoploss will rise less quickly than in case of calm and limited price fluctuations. Below an example with the ATR stop (chandelier exit).
A few details to keep in mind
- There should be a clear difference between the 'cup' and the 'handle'. Not only in time (the handle forms faster than the cup), but also the absolute price bottom of the 'handle' should be higher than the price bottom of the 'cup', otherwise it is simply a double bottom.
- Always keep a close eye on the volume with which the pattern is forming. Patterns in which the selling volume during the intermediate price drop in the 'cup' is smaller than the buying volume at the rounding of the bottom (when the price rises again) are preferable.
- The existing long-term trend should be respected. A too sharp decline in the 'cup' may be an indication that the existing long-term trend is weakening and on its last legs.
- Higher buying volume before or during the breakout is preferable, the more volume the greater the momentum with which the breakout occurs and the less likely it will be a fake breakout.
- Because the Cup and Handle pattern takes some time to fully develop, it is difficult for some traders to resist the temptation to take a long position before the pattern is completed. But until the pattern is completed there are so many other variations possible that there is really no point in doing so. So it is important to let the pattern develop fully before taking action. Personally, I only consider a position after the breakout from the pattern.