Market Monitor Trends and Breadth July 18 BMO
By Kristoff De Turck - reviewed by Aldwin Keppens
Last update: Jul 18, 2025

(All data & visualisations by ChartMill.com)
Daily Market Trend Analysis – July 17, 2025 (After Market Close)
SPY, QQQ & IWM all showing Doji candles on strong volume...
Short Term Trend
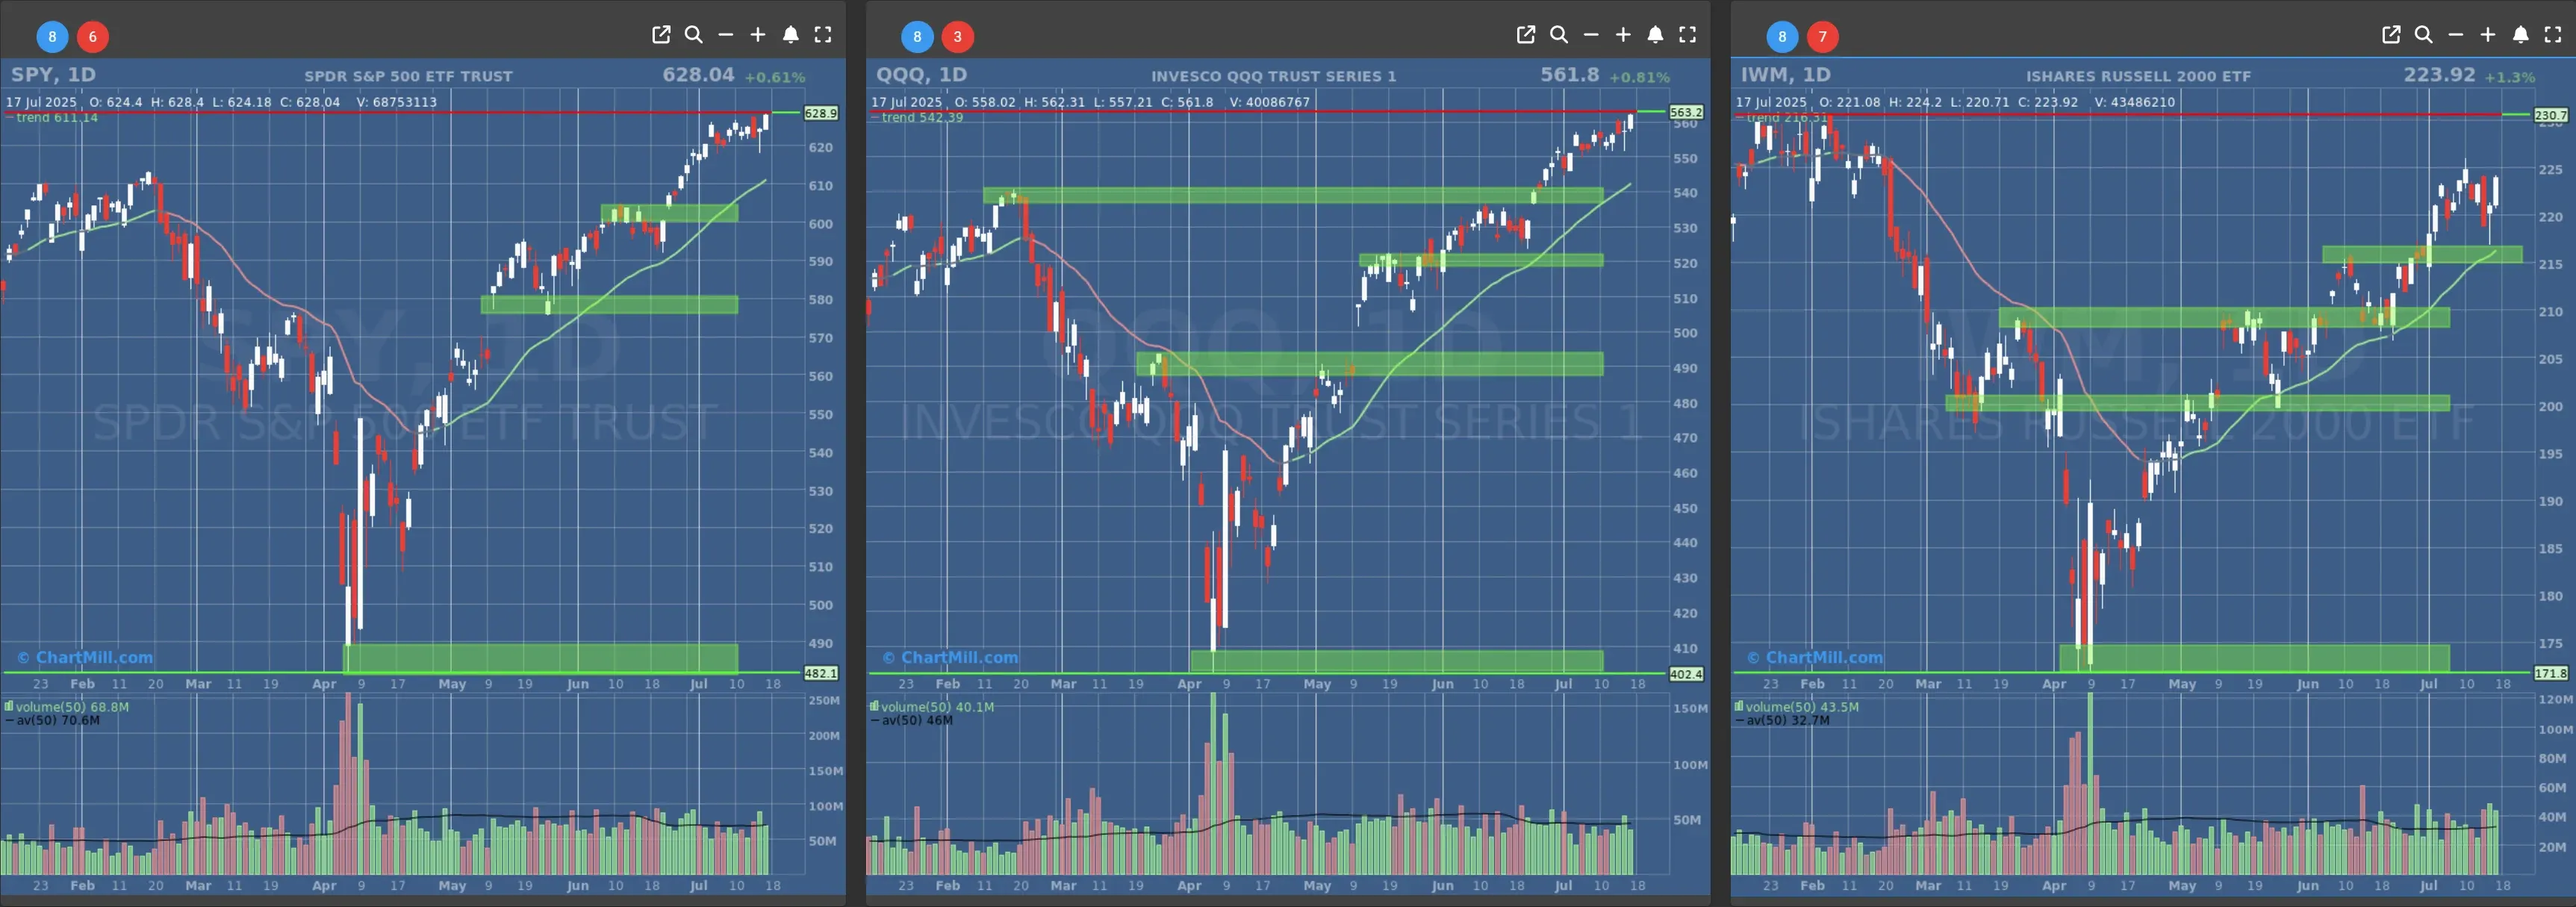
- Short-Term Trend: Bullish (no change)
- Next Support at $600 to $610
- Next Resistance at /
- Volume: At Average (50)
- Pattern: Up Day - New High
- Short-Term Trend: Bullish (no change)
- Next Support at $540
- Next Resistance at /
- Volume: Slighty Below Average (50)
- Pattern: Up Day - New High
- Short-Term Trend: Bullish (no change)
- Next Support at $210
- Next Resistance at $215 to $220
- Volume: Well Above Average (50)
- Pattern: Strong Up Day
Long Term Trend
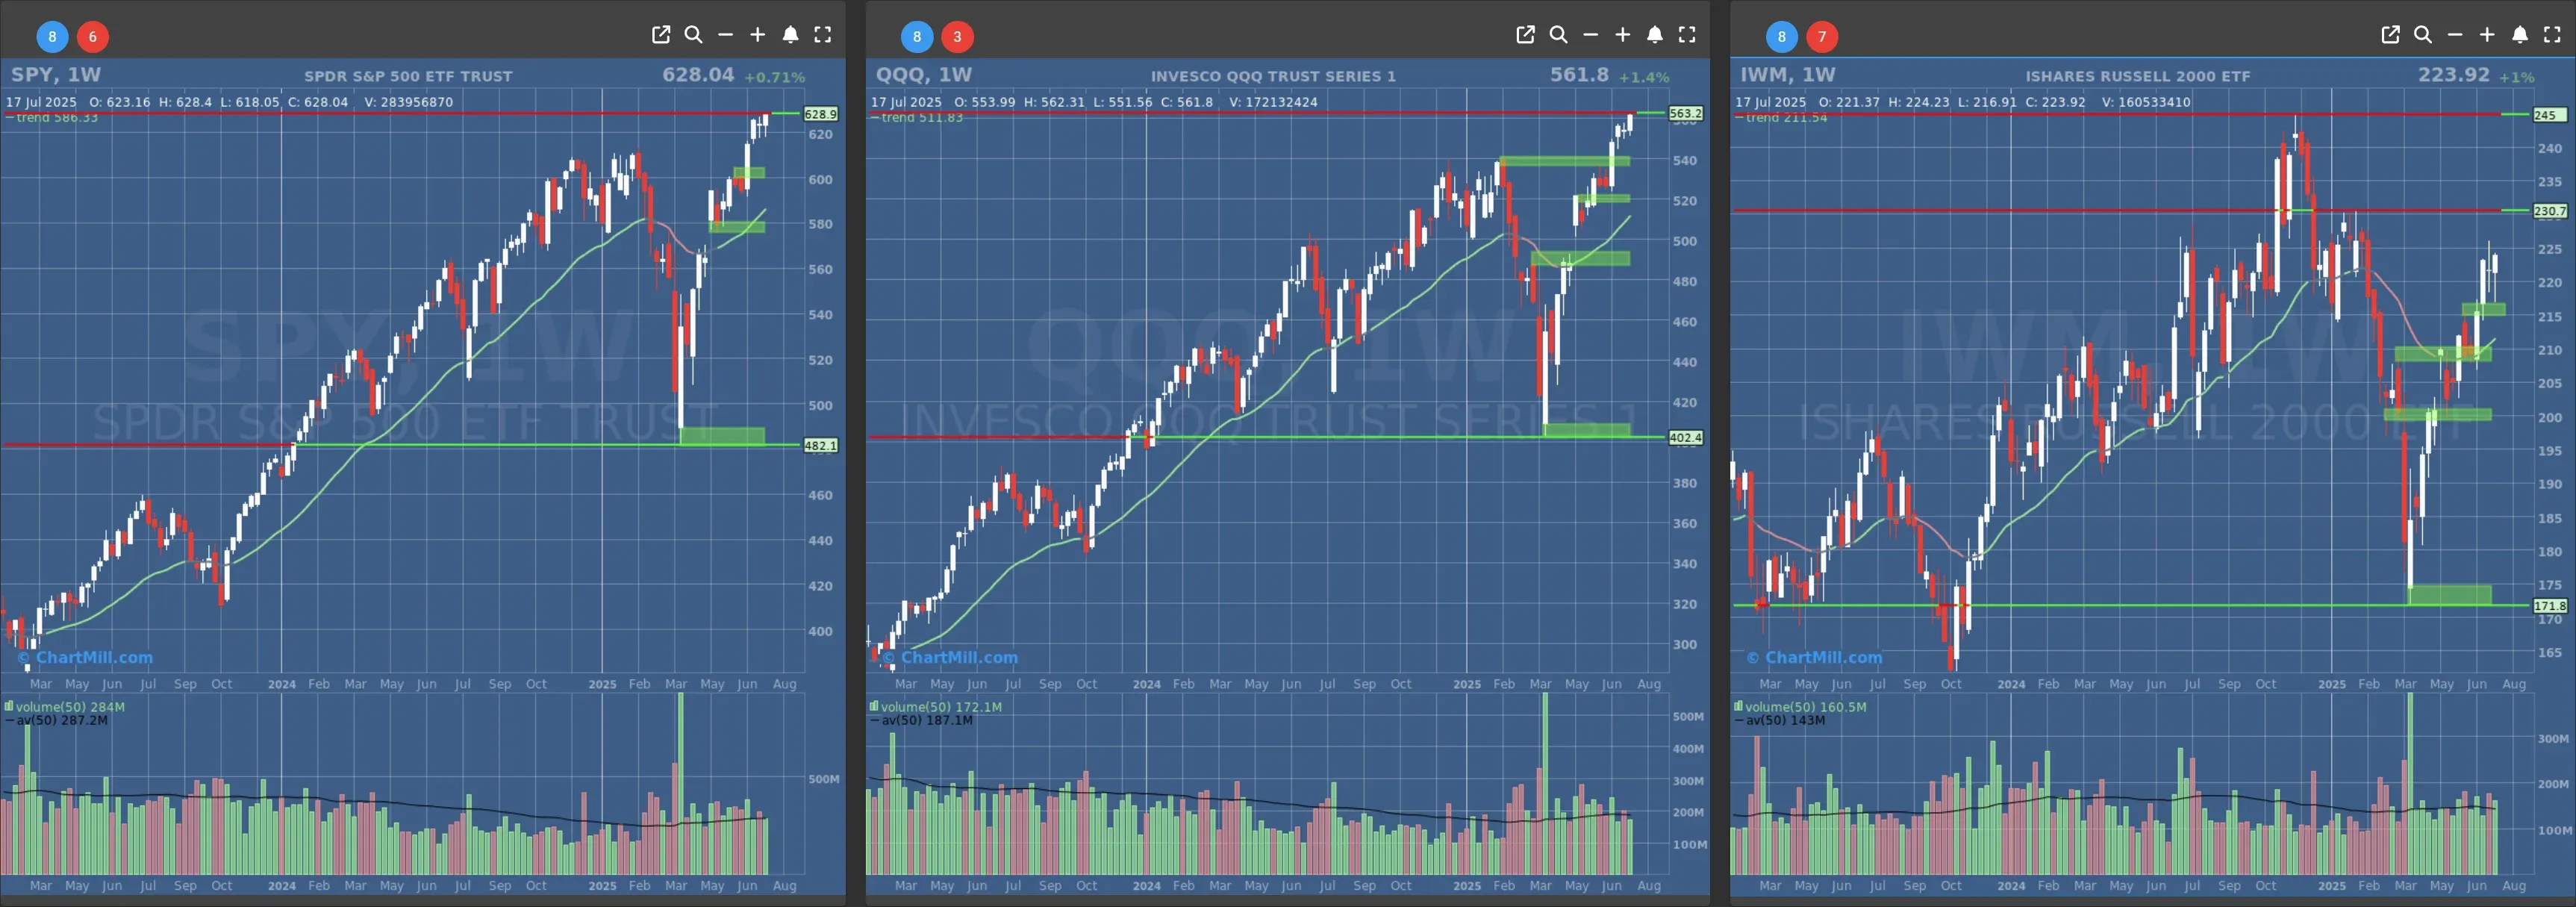
- Long-Term Trend: Positive (no change)
- Long-Term Trend: Positive (no change)
- Long-Term Trend: Positive (no change)
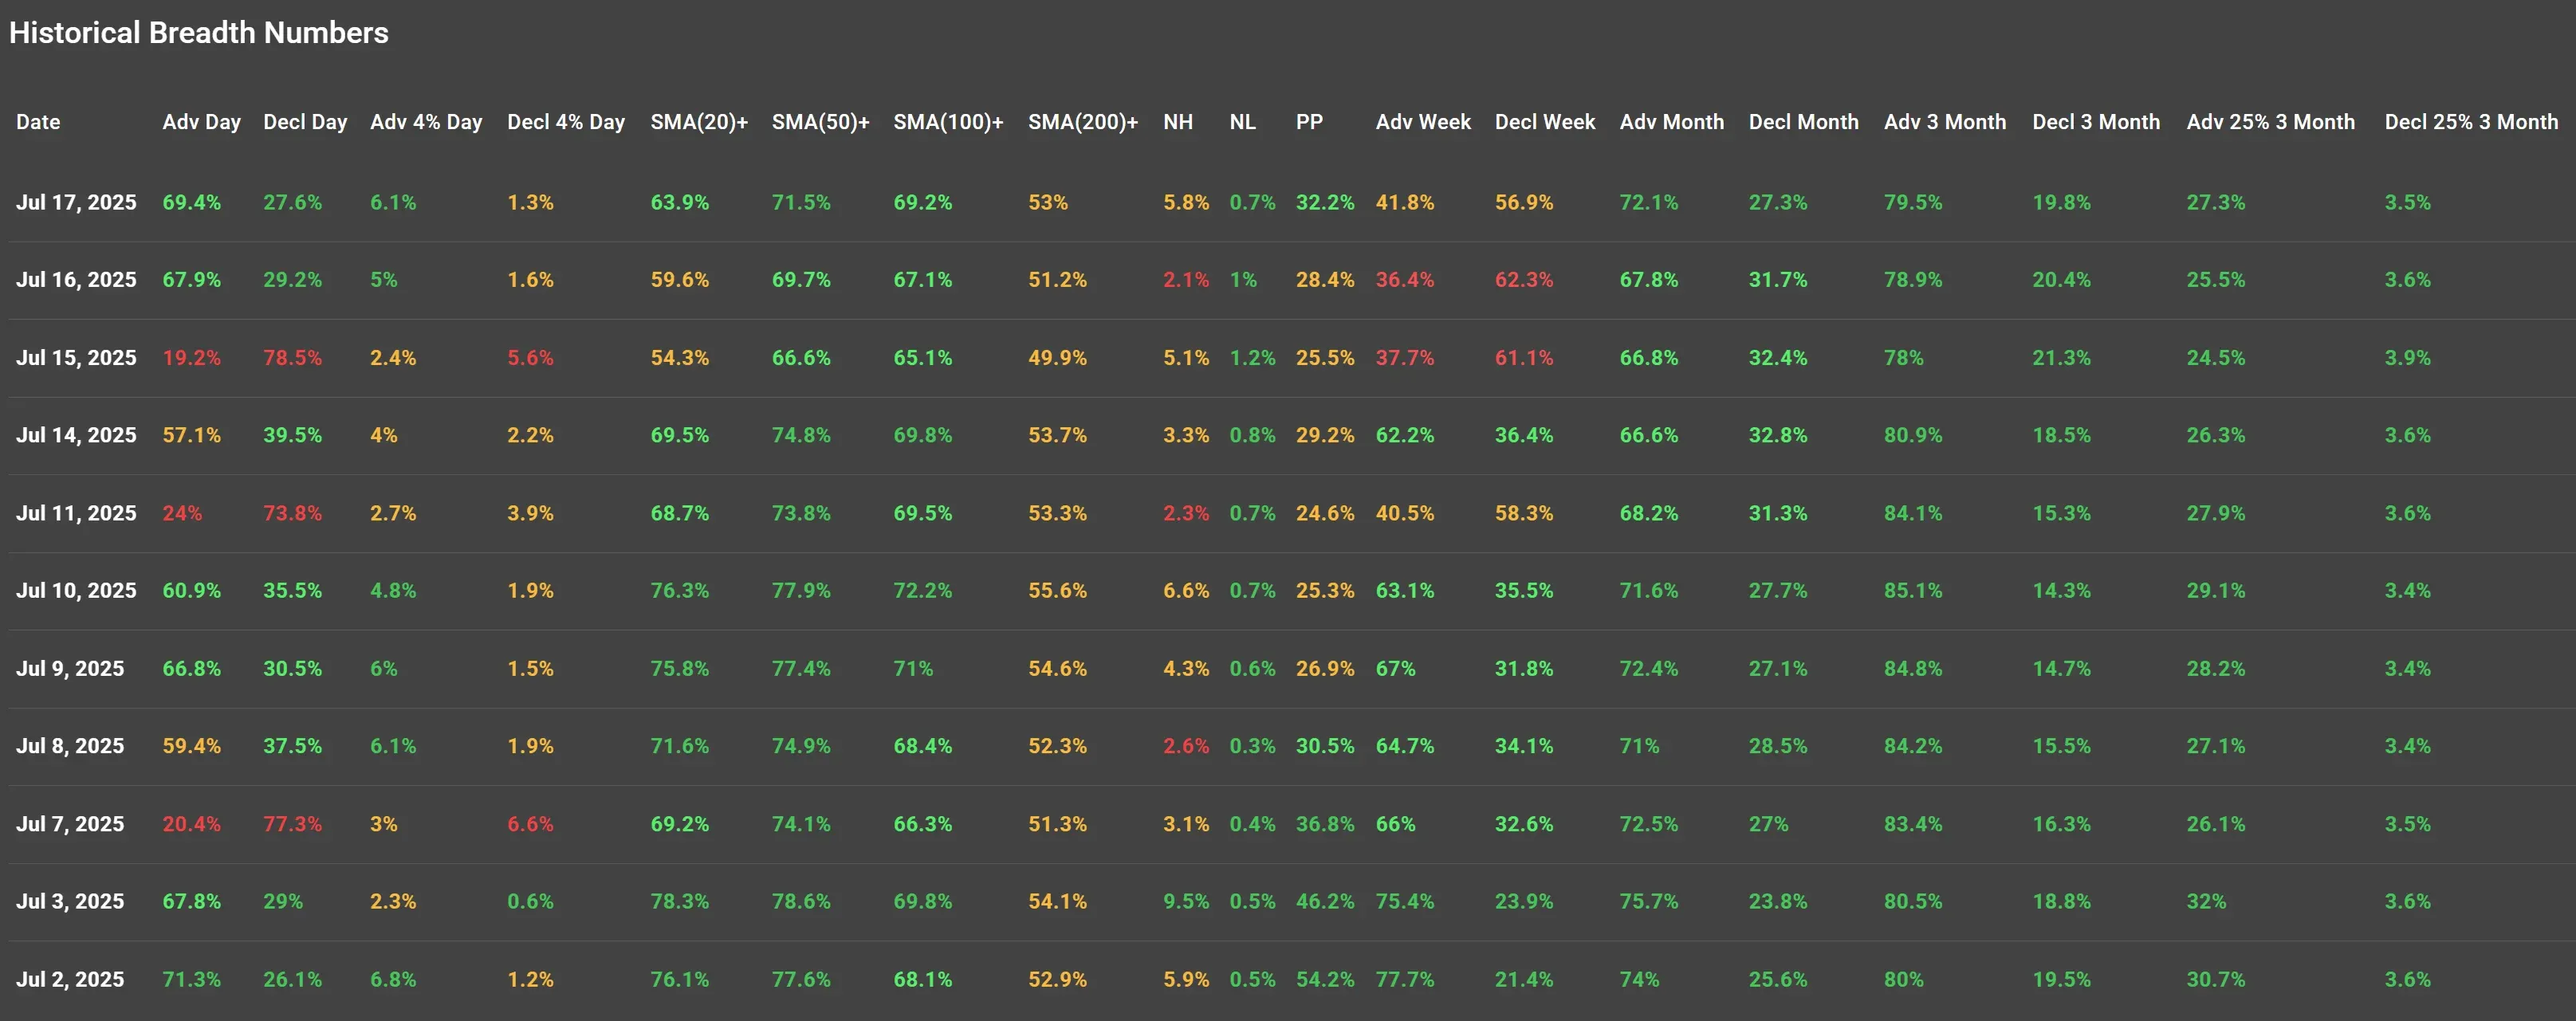
Daily Market Breadth Analysis – July 17, 2025 (After Market Close)
Market internals improved significantly on July 17, following a short-term pullback seen earlier in the week. Advancing issues made up 69.4% of all stocks traded, a notable rebound from the previous session’s 67.9%. Decliners slipped to 27.6%, indicating a broad-based recovery across the U.S. equity markets.
Positive Momentum Building Again
-
Advancing >4%: 6.1% of stocks gained more than 4%, up from 5% on July 16.
-
Declining >4%: Only 1.3% of stocks lost more than 4%, a drop from 1.6%, and the lowest reading since July 3.
This pattern shows not only broad participation but also strength within the advancing group. These figures mark the strongest internals since July 2, suggesting increasing investor risk appetite.
Trend Participation Improving
The percentage of stocks trading above their key moving averages improved:
-
SMA(20): 63.9% (up from 59.6%)
-
SMA(50): 71.5% (up from 69.7%)
-
SMA(100): 69.2% (up from 67.1%)
-
SMA(200): 53% (up slightly from 51.2%)
The short-term SMA(20) rebound is particularly noteworthy. It had declined for three consecutive sessions before reversing higher today, a potential sign of a short-term bottom forming.
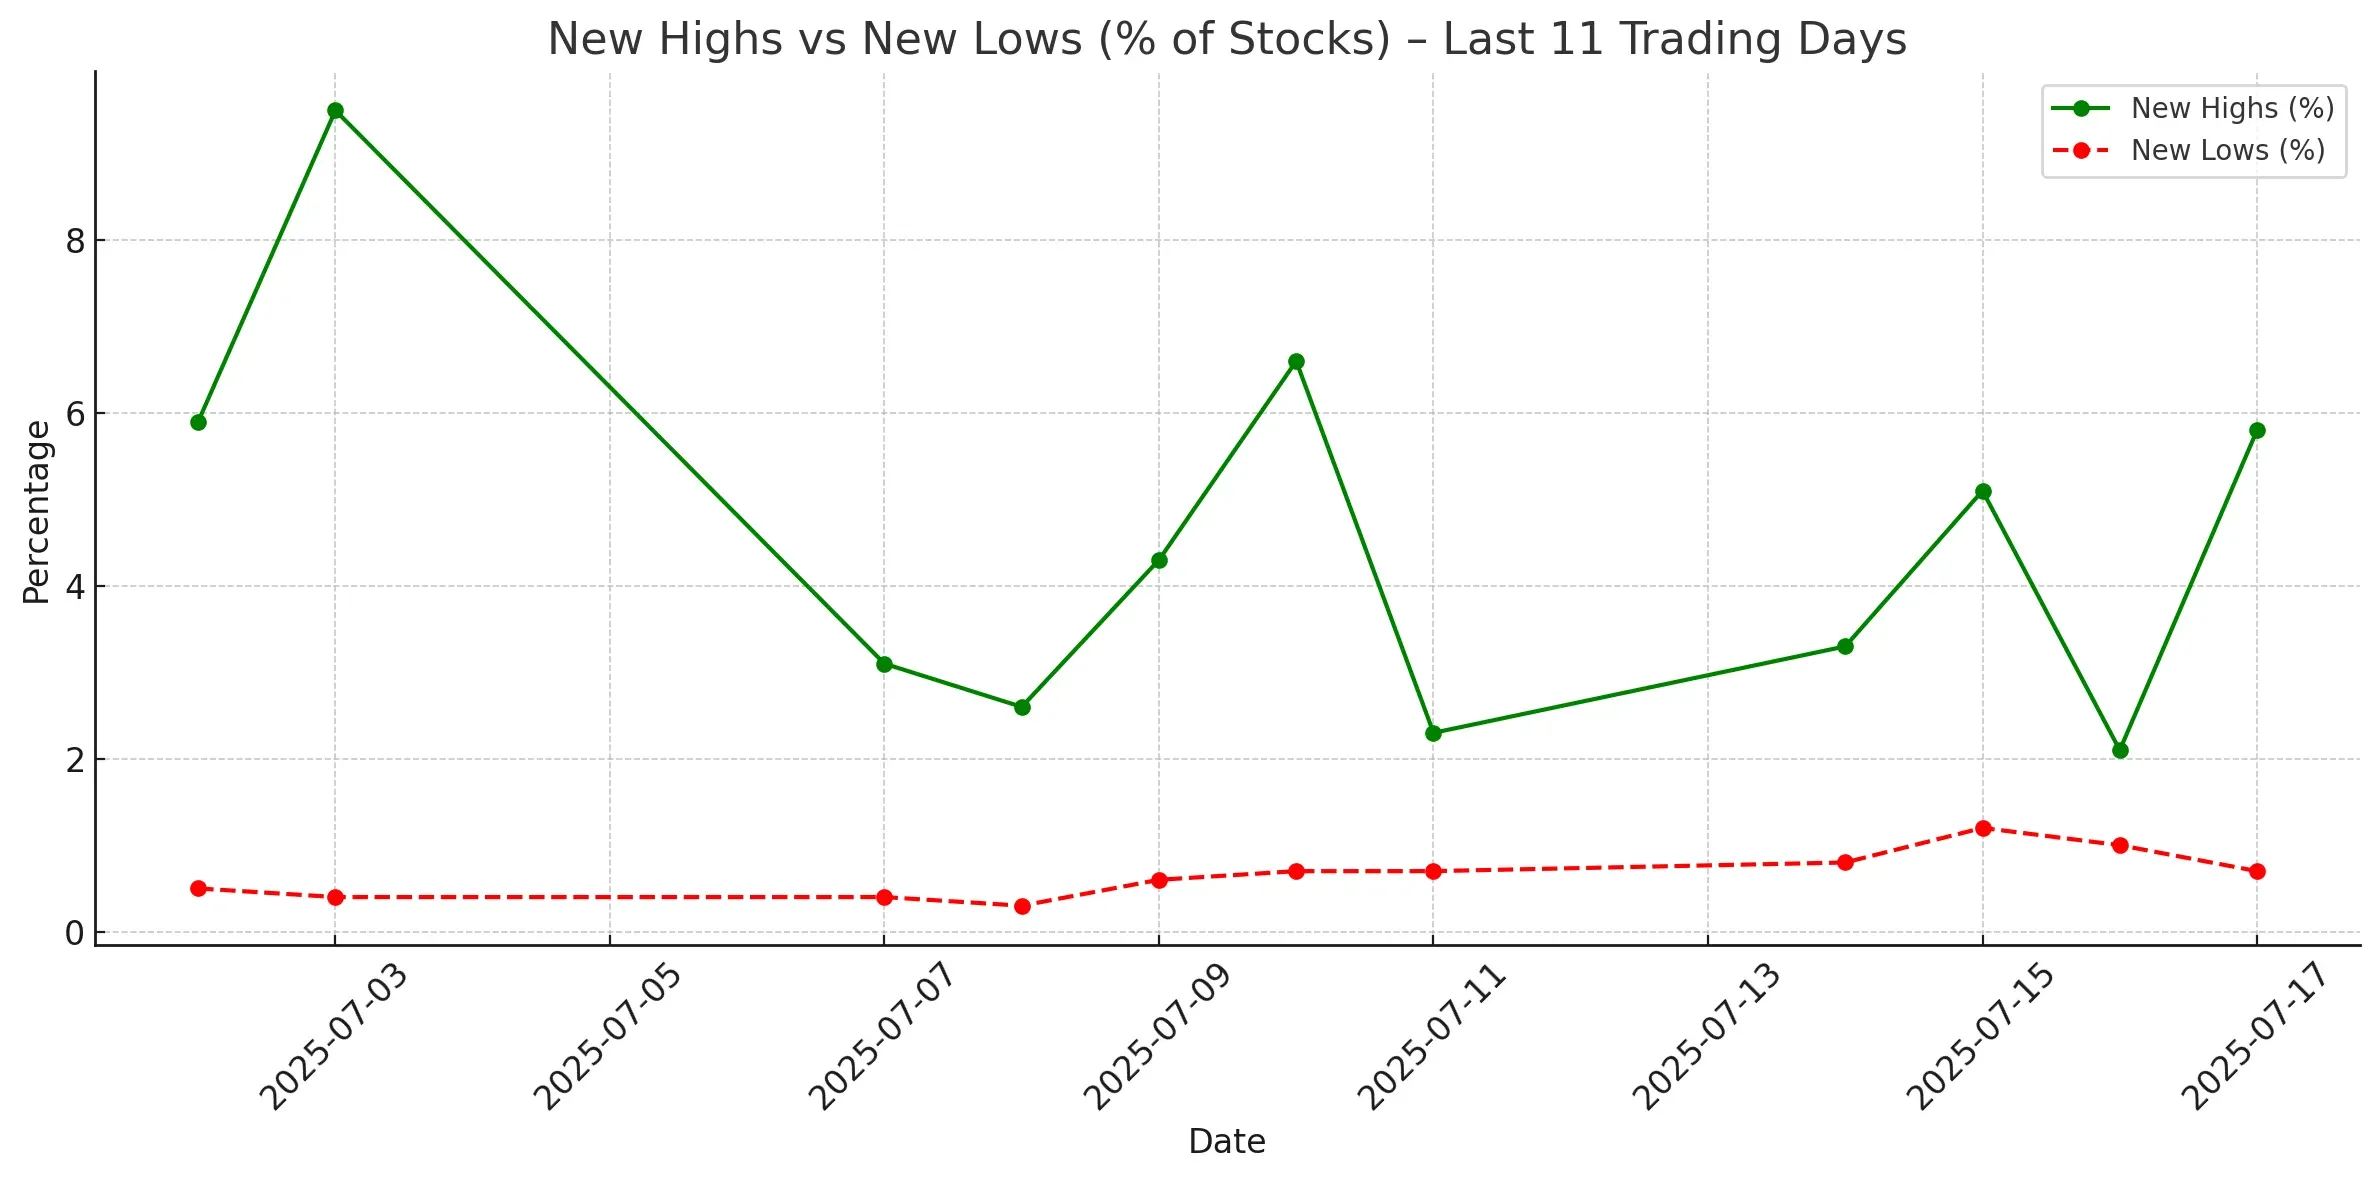
New Highs vs New Lows
-
New Highs (NH): 5.8%
-
New Lows (NL): 0.7%
The spread between NH and NL expanded again, consistent with underlying market strength. This trend has been intact since the sharp deterioration on July 15.
Cumulative Trends Point to Bullish Bias
% Above Pivot Point (PP): 32.2%, up from 28.4% the day before.
Weekly Breadth:
Advancing stocks rose to 41.8% of the weekly total, up from 36.4%. Decliners remained high at 56.9%, though slightly lower than the previous 62.3%. This reflects the fact that July 17’s advance was still working to offset earlier losses from the week’s rough start.
Monthly Breadth remains firmly bullish:
-
Advancing stocks (Month): 72.1%
-
Declining stocks (Month): 27.3%
-
3-Month Advancers: 79.5%
-
Advancing >25% in 3 Months: 27.3% — up from 25.5%
This continues the broader medium-term bullish trend, now entering its third consecutive month of strength.
Comparison to July 16, 2025
July 17's data confirmed the rebound that began on July 16, where the market had already started to recover from the sharp deterioration on July 15, a day marked by a mere 19.2% advancing stocks and 78.5% decliners, the worst breadth in this 10-day sample.
The July 15 selloff was broad and sharp, likely triggered by softer-than-expected economic data released that morning, but July 16 and now July 17 show buy-the-dip behavior, especially in stocks that had briefly fallen below short-term moving averages.
Final Takeaway
The market breadth data for July 17 confirms that the selloff from earlier this week is likely behind us. The strong participation across all key breadth metrics - from percentage of advancers to new highs and moving average participation - supports a bullish short-term outlook. The medium- to longer-term trends (1 month and 3 month) remain solidly positive.
While broader market indices may still be consolidating near highs, this renewed internal strength bodes well for the continuation of the rally, especially if supported by neutral or positive macroeconomic developments over the coming days.
Kristoff - ChartMill
Next to read: Market Monitor News, July 18
NYSEARCA:IWM (7/29/2025, 11:59:08 AM)
222.88
-1.24 (-0.55%)
NASDAQ:QQQ (7/29/2025, 11:59:10 AM)
568.491
+0.35 (+0.06%)
NYSEARCA:SPY (7/29/2025, 11:59:10 AM)
635.93
-1.01 (-0.16%)
Find more stocks in the Stock Screener
IWM Latest News and Analysis