(All data & visualisations by ChartMill.com)
Daily Market Trend Analysis – July 16, 2025 (After Market Close)
SPY, QQQ & IWM all showing Doji candles on strong volume...
Short Term Trend
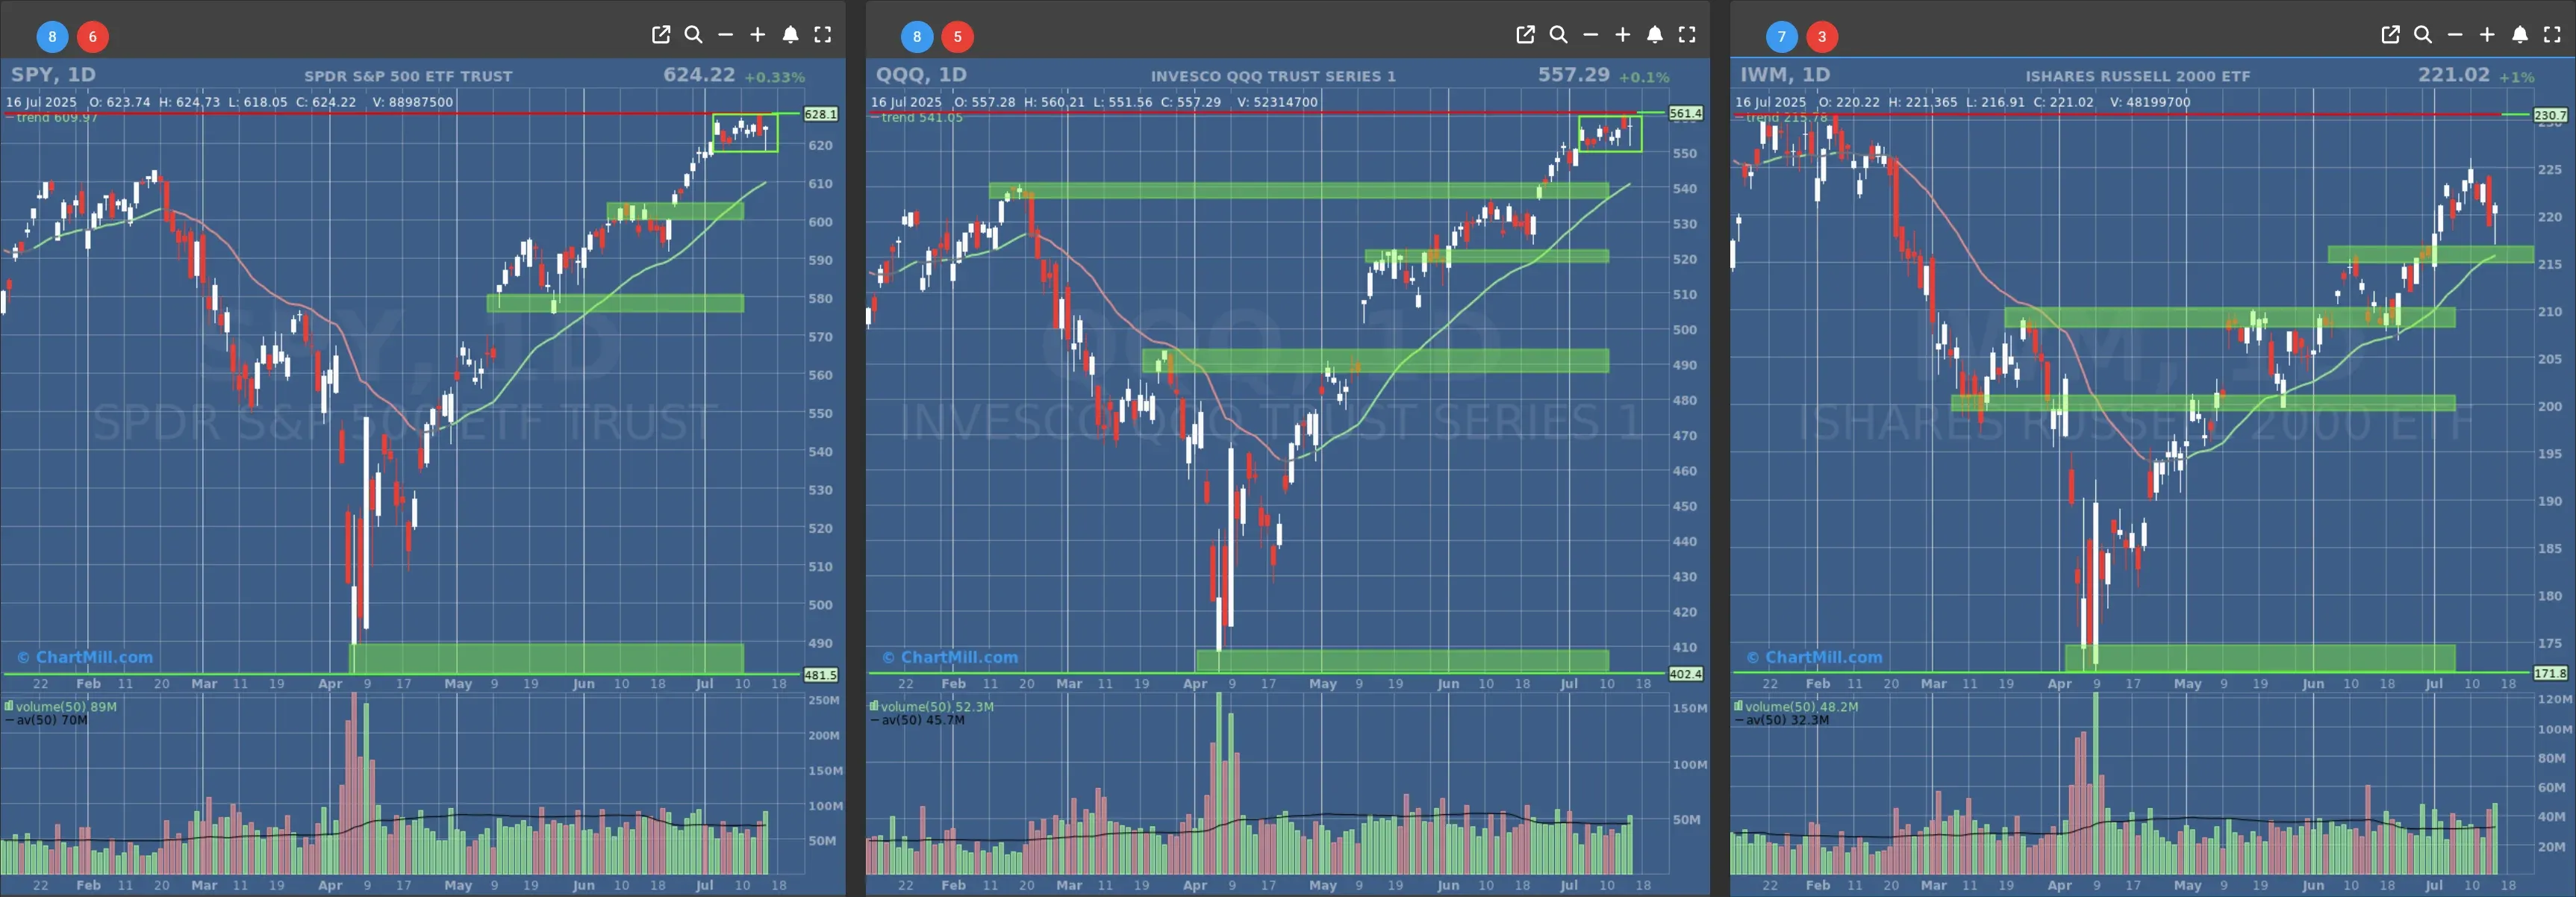
- Short-Term Trend: Bullish (no change)
- Next Support at $600 to $610
- Next Resistance at /
- Volume: Above Average (50)
- Pattern: Doji Candle - Up Day
- Short-Term Trend: Bullish (no change)
- Next Support at $540
- Next Resistance at /
- Volume: Slighty Above Average (50)
- Pattern: Doji Candle - Up Day
- Short-Term Trend: Bullish (no change)
- Next Support at $210
- Next Resistance at $215 to $220
- Volume: Well Above Average (50)
- Pattern: Doji Candle - Up Day
Long Term Trend
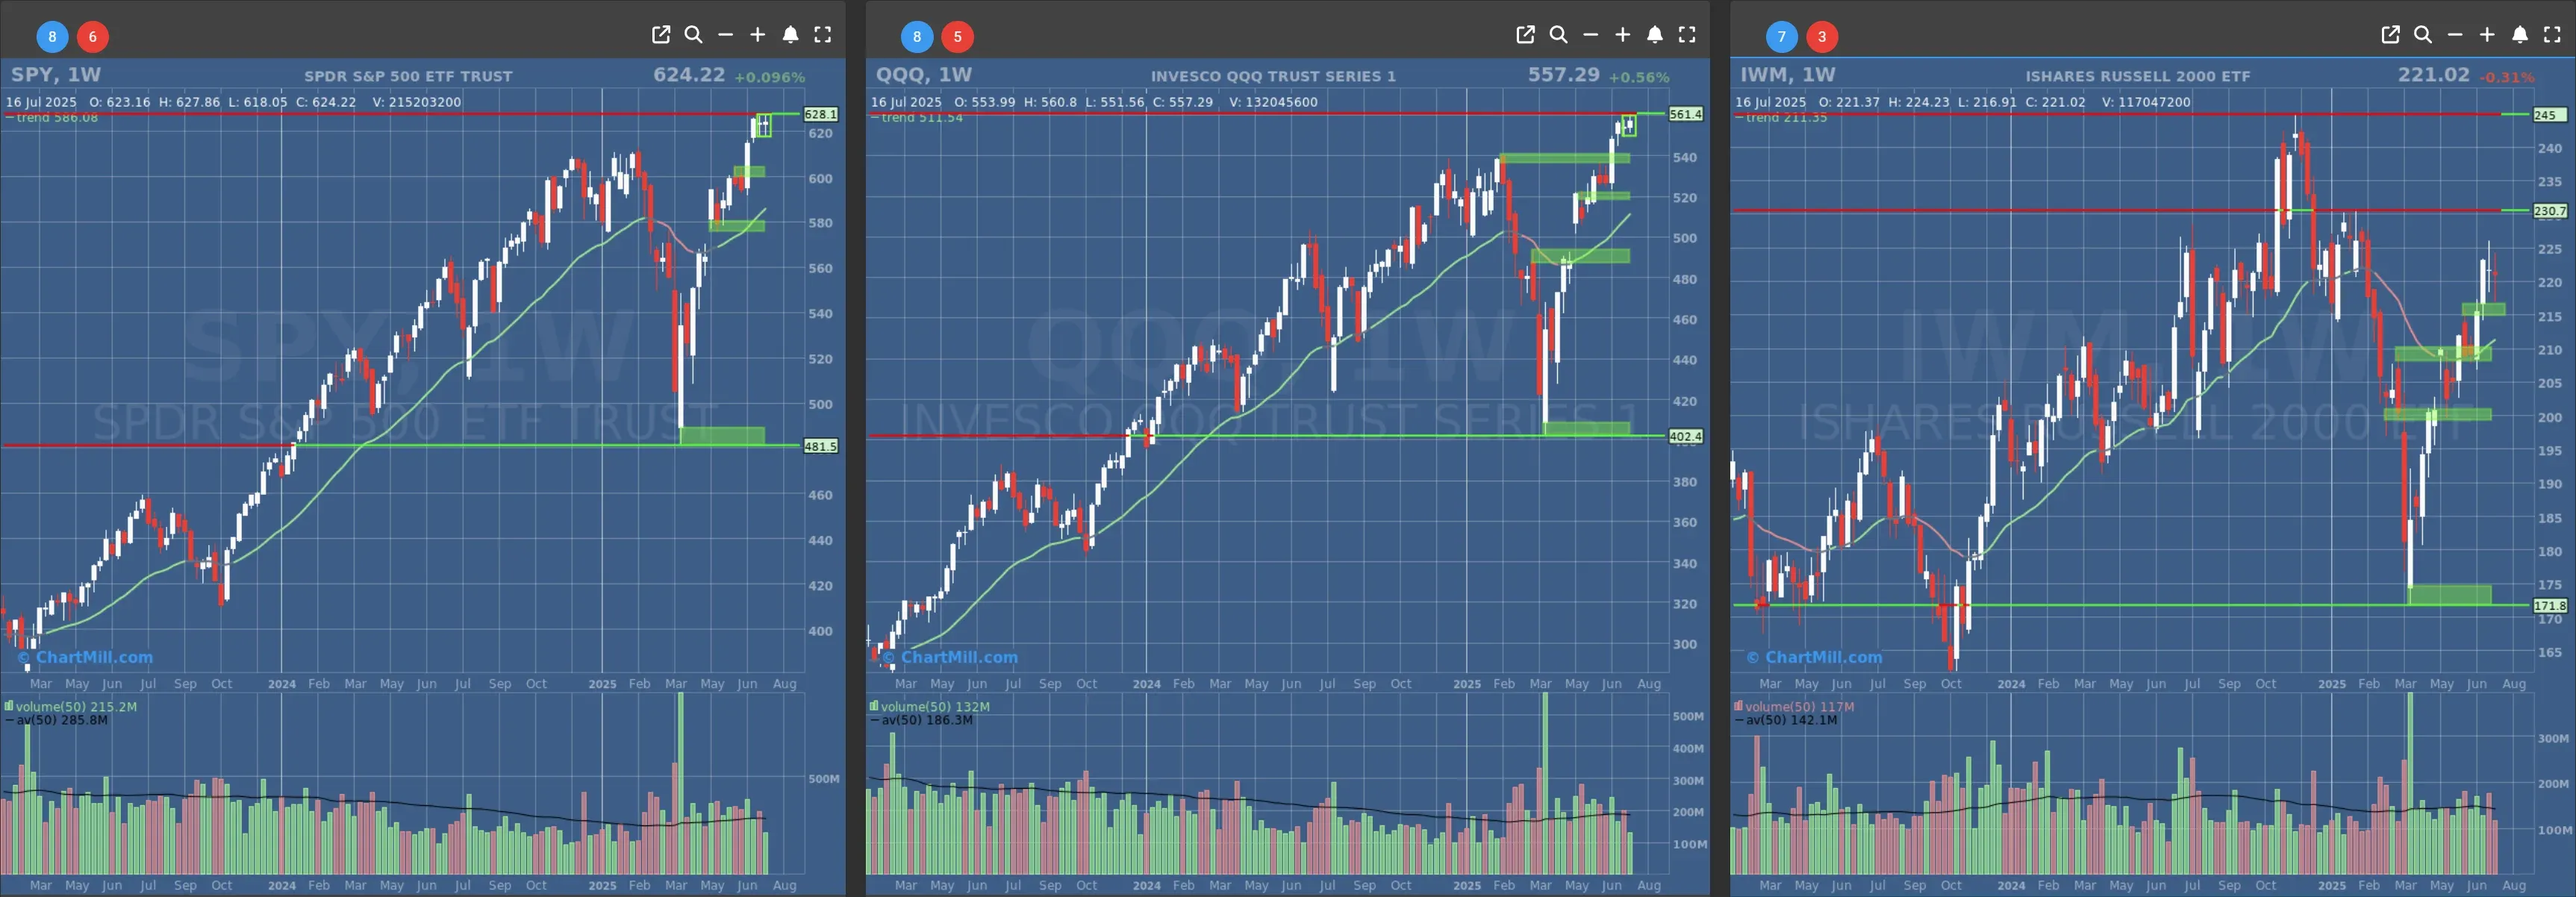
- Long-Term Trend: Positive (no change)
- Long-Term Trend: Positive (no change)
- Long-Term Trend: Positive (no change)
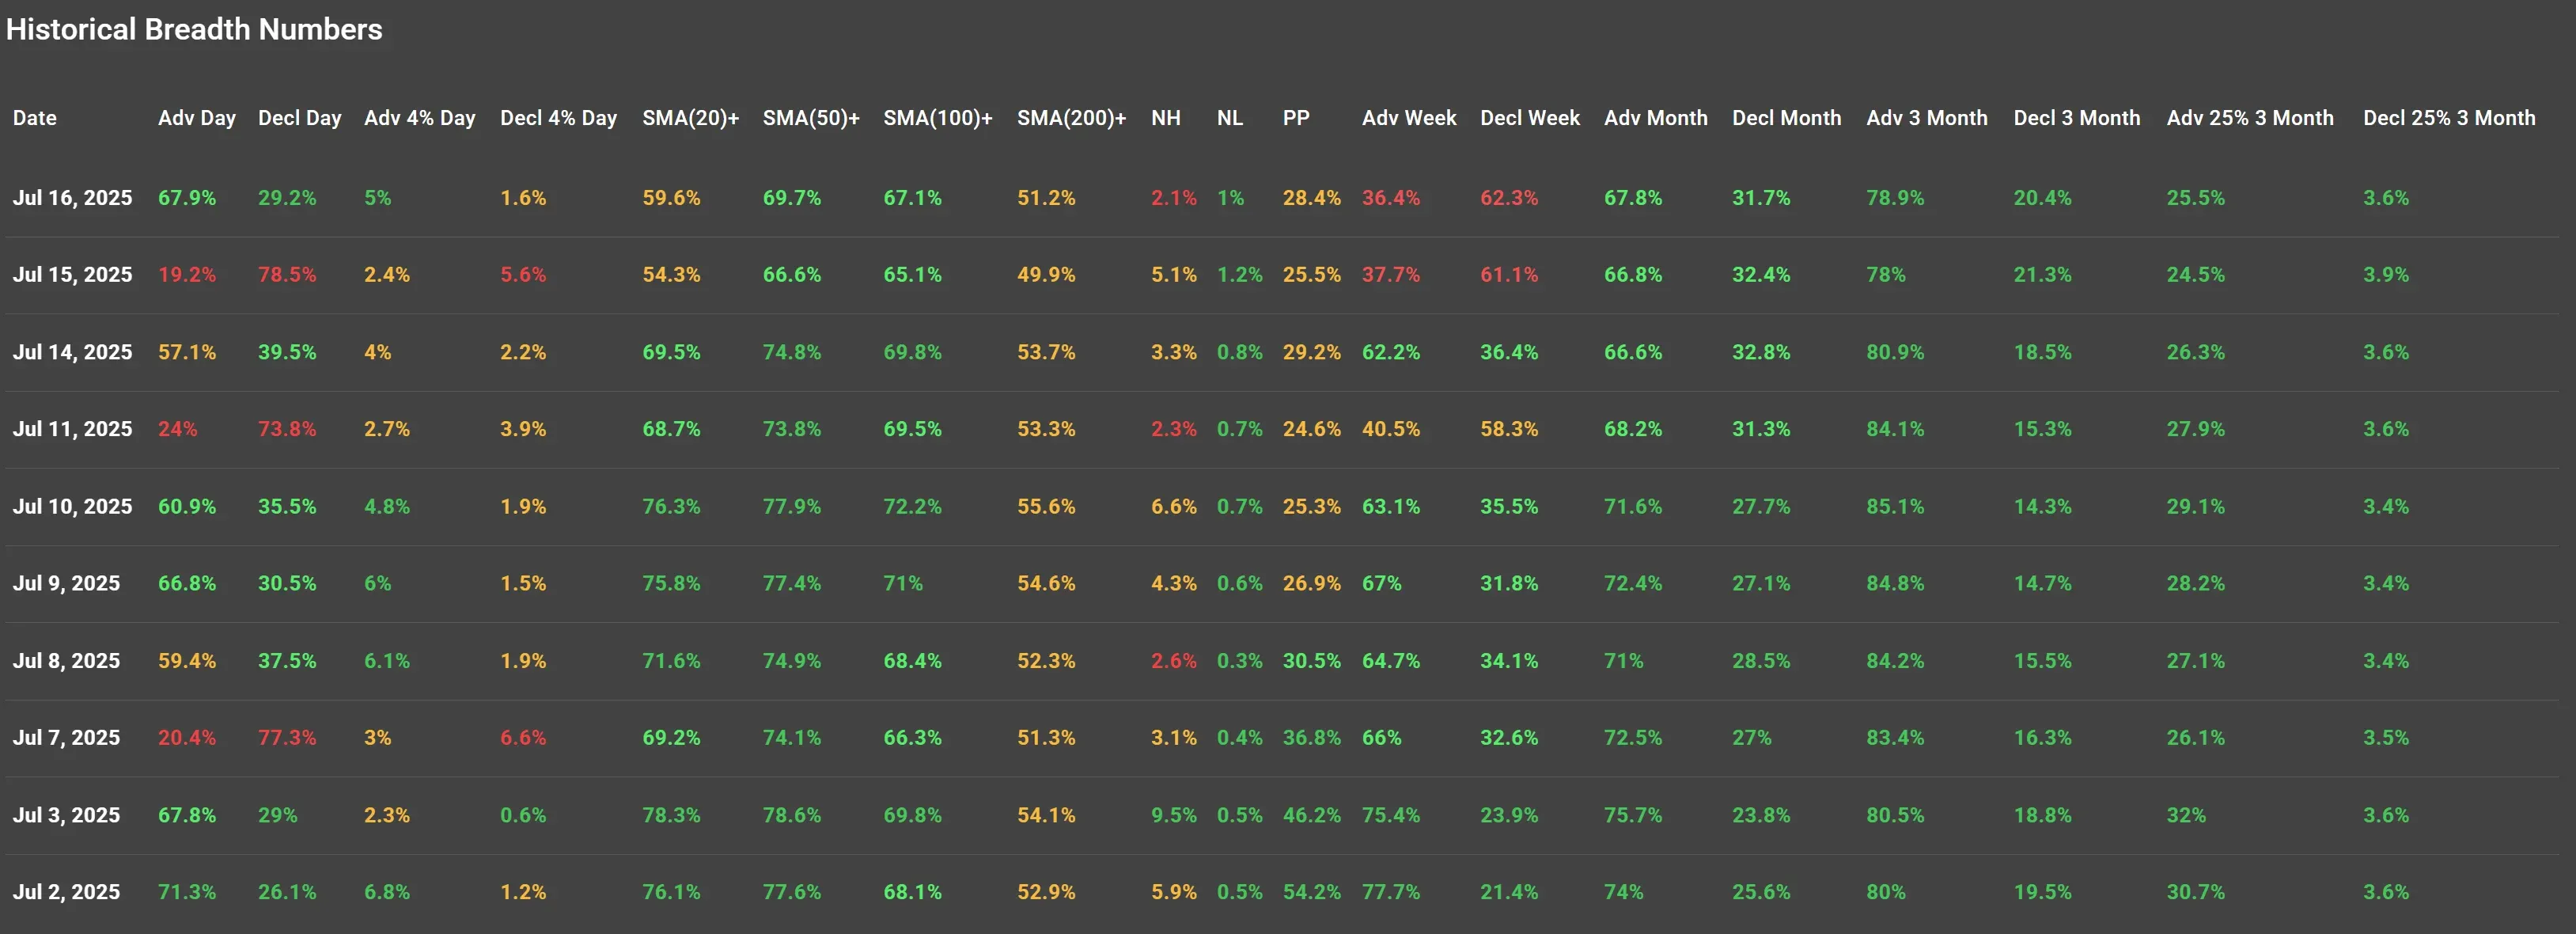
Daily Market Breadth Analysis – July 16, 2025 (After Market Close)
Market breadth metrics sharply rebounded on July 16, 2025, following the risk-off session from the day prior. Broad participation was evident across key indicators, reversing much of Monday's weakness and reinforcing the short-term resilience seen earlier this month.
Daily Breadth: Reversal from Prior Weakness
-
67.9% of stocks advanced, compared to just 19.2% on July 15. This swing mirrors the breadth recovery seen on July 10 and July 9.
-
Decliners dropped significantly to 29.2%, well below Monday's extreme 78.5%.
-
The percentage of stocks advancing over 4% rose to 5%, versus only 2.4% the previous day, indicating not only more participation but also stronger individual price moves.
-
Conversely, only 1.6% of stocks declined more than 4%, down sharply from 5.6%.
This move confirms that Monday’s selling did not lead to a prolonged breakdown, and buyers regained control quickly, similar to the recovery pattern we noted on July 10 after July 7’s weakness.
Medium-Term Momentum: Stabilization Across Key Moving Averages
-
Stocks above the SMA(20) climbed to 59.6%, from 54.3%.
-
SMA(50) and SMA(100) participation remained stable at 69.7% and 67.1%, respectively.
-
Even SMA(200) breadth ticked higher to 51.2%, showing longer-term trends are holding.
These figures suggest the broader market continues to consolidate above critical support zones, even after brief shakeouts.
New Highs and Lows: Calm After the Storm
-
New Highs (NH) declined slightly to 2.1% from Monday’s 5.1%, reflecting a cautious tone, but not a deterioration.
-
New Lows (NL) stayed near negligible levels (1%), confirming that downside momentum was not expanding.
Weekly & Monthly Trends: Holding Firm
Weekly advancers decreased modestly to 36.4%, a consequence of Monday’s sell-off, but the decline is less severe than the raw daily numbers suggested.
On a monthly scale, advancers remain strong at 67.8%, essentially flat compared to previous days, while decliners dropped to 31.7%.
The 3-month breadth continues to paint a bullish bias: 78.9% of stocks are still up over that period, while only 20.4% are down.
The "Adv 25% 3 Month" metric (stocks up at least 25% in the past three months) edged up to 25.5%, another sign that leadership remains intact.
This marks a minor uptick from Monday’s 24.5%, reinforcing the view that Monday’s move was likely rotational rather than trend-breaking.
Context & Sentiment
Tuesday’s rally came without any major macroeconomic catalyst released intraday. It appears to have been driven more by technical dynamics and sentiment rotation rather than fresh economic data. The recovery suggests market participants may have interpreted Monday's weakness as a dip-buying opportunity rather than the start of a broader correction.
While news flow around upcoming earnings reports and speculation on the Fed’s path continue to influence sentiment, these would not have factored heavily into the intraday breadth metrics on July 16.
Conclusion
The July 16 session marked a strong reversal in market breadth metrics across the board. The data confirms that the market remains in a strong medium-term uptrend, with short-term volatility continuing to be absorbed effectively. The breadth recovery after Monday’s shakeout mirrors similar resilience observed on July 10 after the July 7 dip, strengthening the case that dips are still being bought aggressively.
As we move deeper into earnings season, market breadth will be critical in determining whether leadership continues to broaden or narrows further. For now, breadth trends remain structurally healthy.
Kristoff - ChartMill
Next to read: Market Monitor News, July 17