

(All data & visualisations by ChartMill.com)
Daily Market Trend Analysis – July 24, 2025 (After Market Close)
New intraday high for SPY & QQQ , IWM down almost 12.5%
Short Term Trend
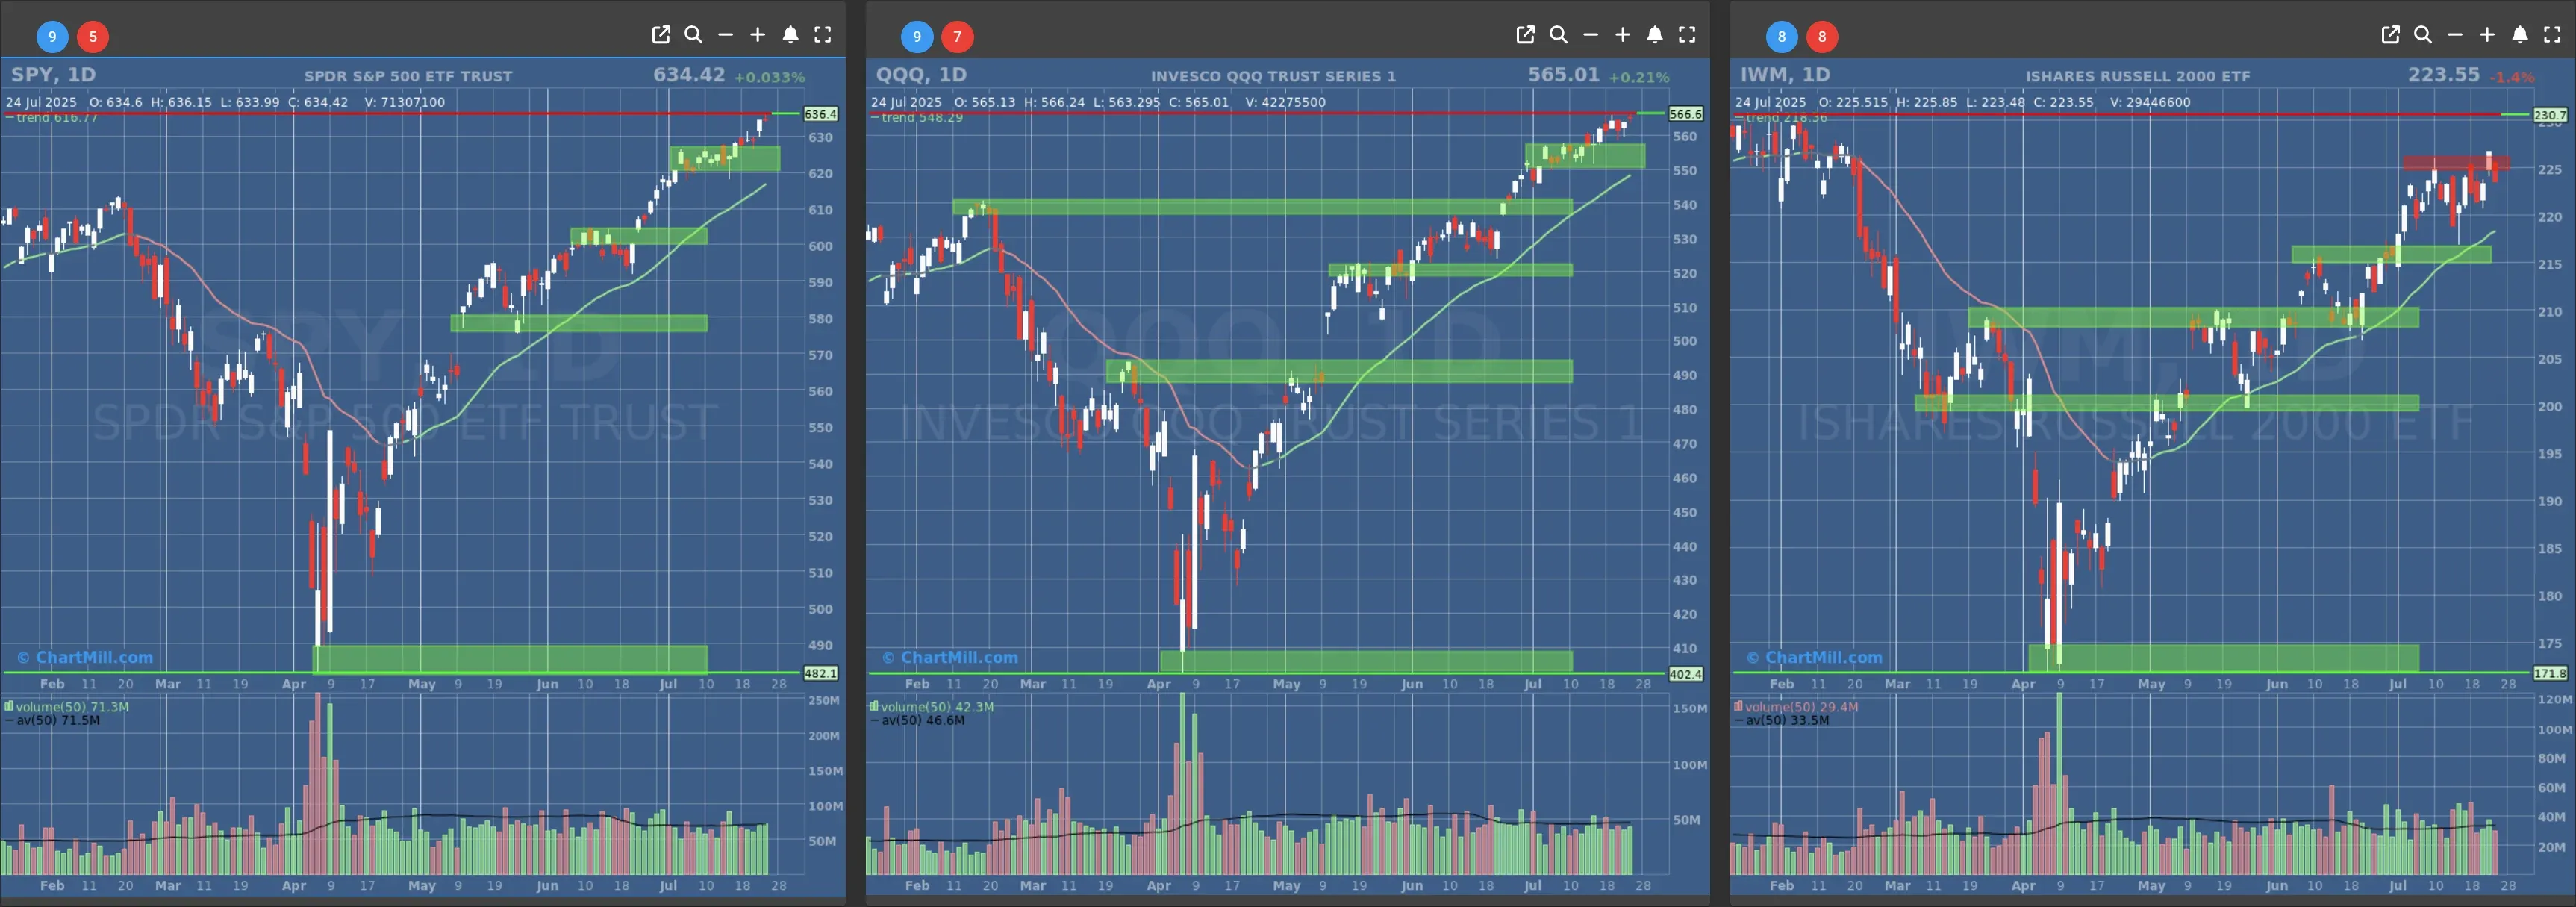
- Short-Term Trend: Bullish (no change)
- Next Support at $620 - $600
- Next Resistance at $632
- Volume: At Average (50)
- Pattern: Down Day - Doji Candle- New All Time Intraday High
- Short-Term Trend: Bullish (no change)
- Next Support at $550 - $540
- Next Resistance at $566
- Volume: At Average (50)
- Pattern: Down Day - Doji Candle- New All Time Intraday High
- Short-Term Trend: Bullish (no change)
- Next Support at $220 - $215
- Next Resistance at $225
- Volume: At Average (50)
- Pattern: Down day
Long Term Trend
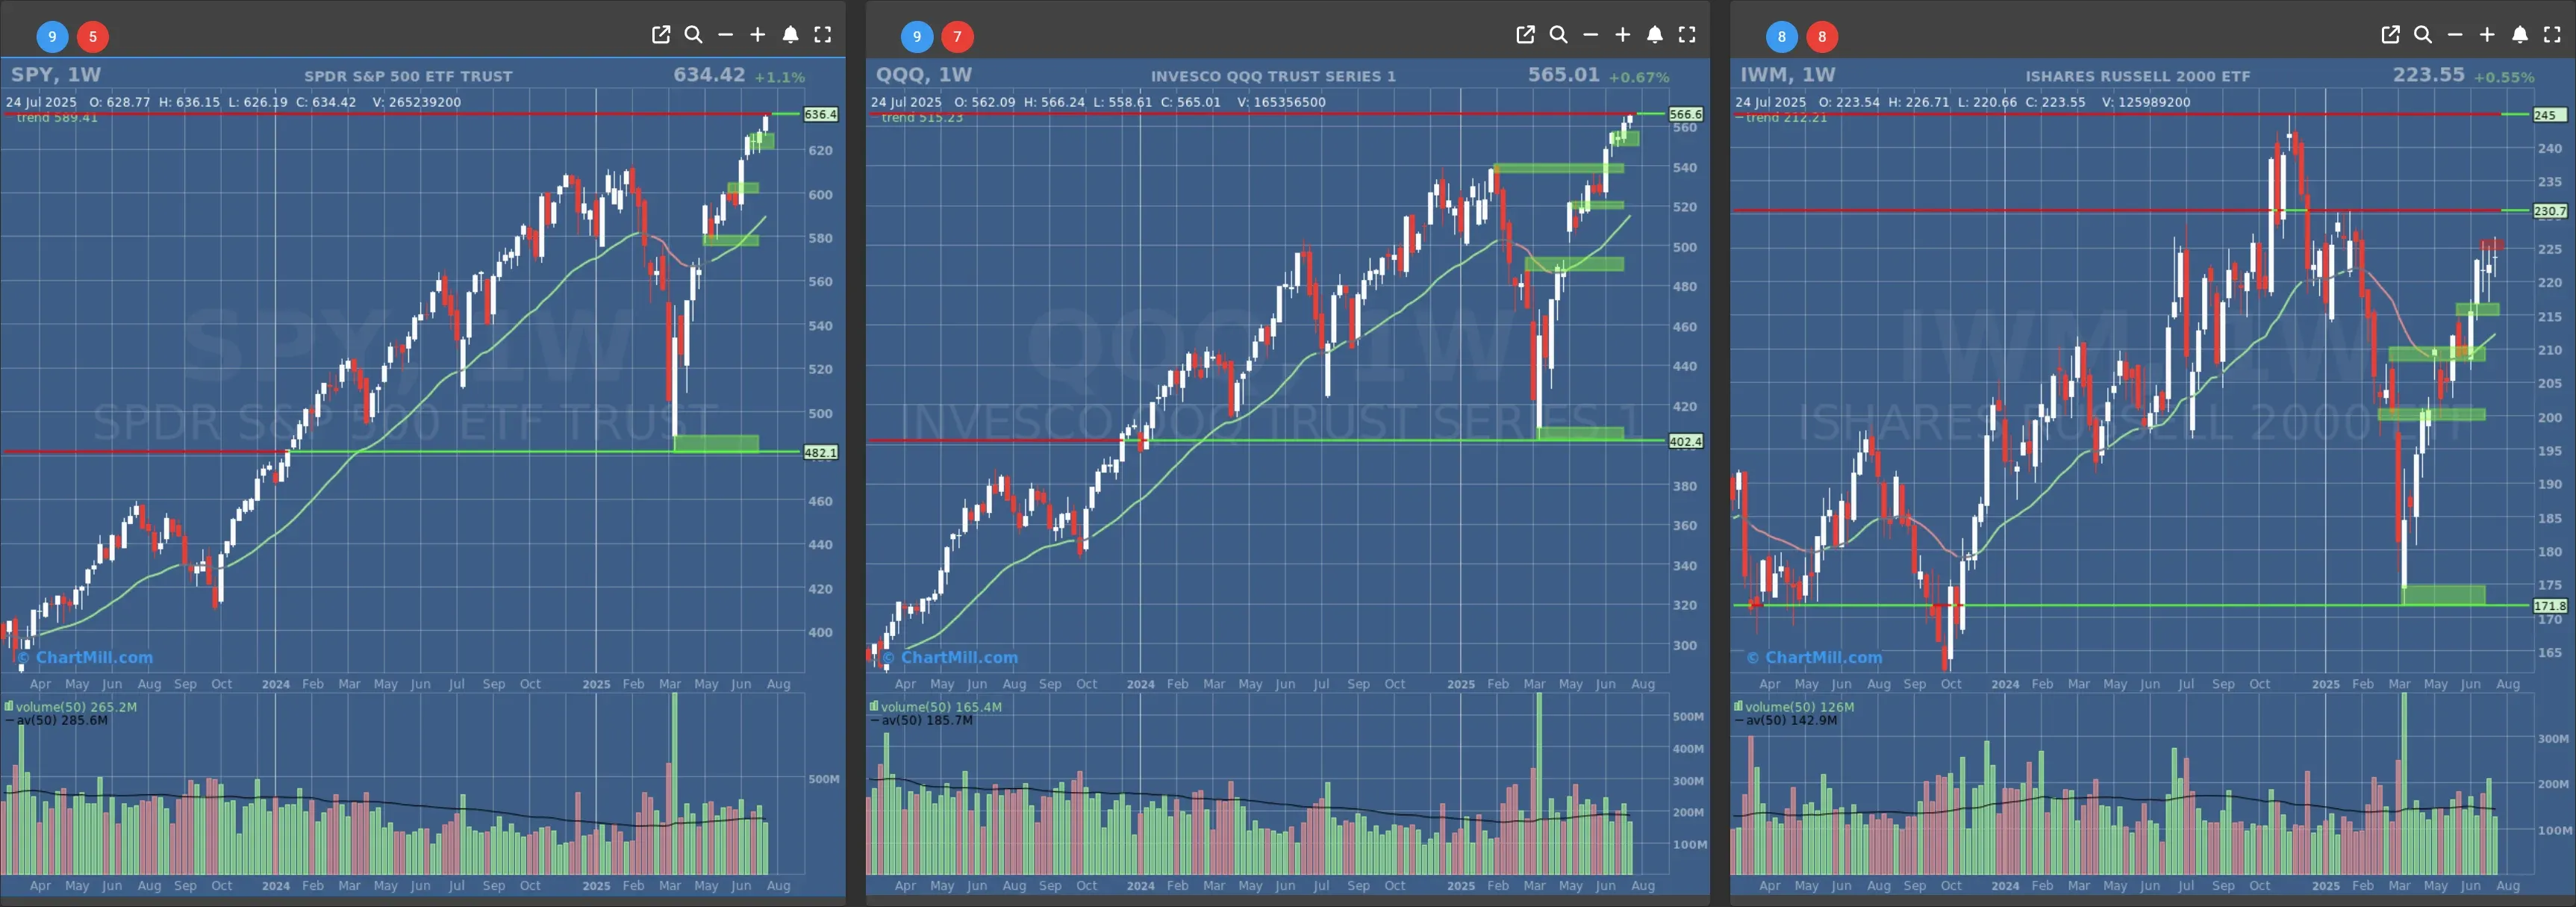
- Long-Term Trend: Positive (no change)
- Long-Term Trend: Positive (no change)
- Long-Term Trend: Positive (no change)
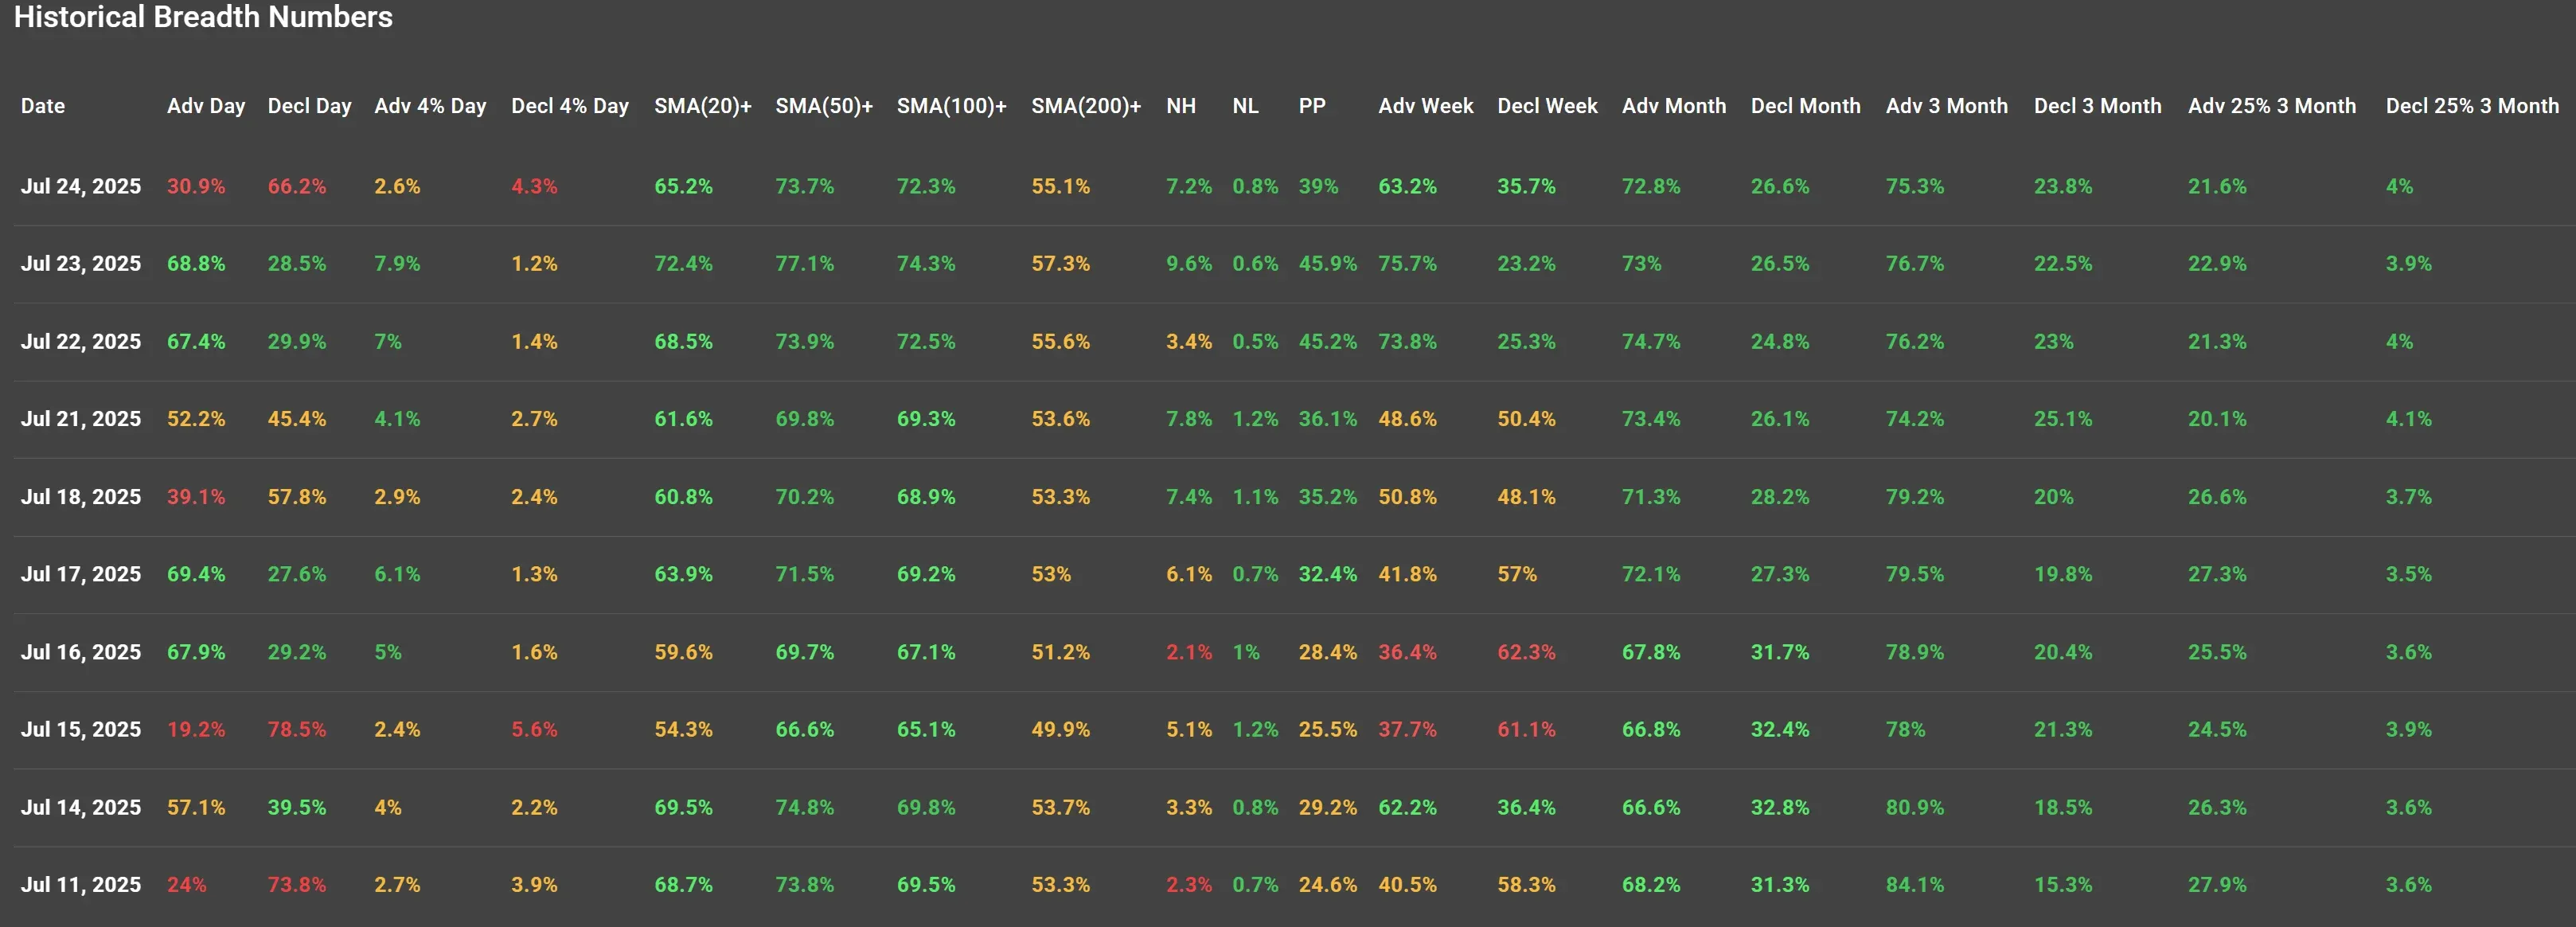
Daily Market Breadth Analysis – July 24, 2025 (After Market Close)
The market breadth on Thursday, July 24, 2025, weakened notably after two relatively strong breadth sessions on July 22 and July 23. Despite positive breadth trends earlier in the week, yesterday’s figures point to a short-term setback in participation, raising questions about the sustainability of the recent rebound.
Advancing / Declining
-
Advancing Issues (Day): 30.9%
-
Declining Issues (Day): 66.2%
-
Advancing >4% (Day): 2.6%
-
Declining >4% (Day): 4.3%
This marks a significant reversal from July 23, when advancing stocks were dominant (68.8%) and only 1.2% of stocks saw 4%+ declines. The balance tipped sharply in favor of declining stocks yesterday, showing broad weakness across the board.
Moving Average Participation (SMA Breadth):
SMA Jul 24 Jul 23 Change
(20)+ 65.2% 72.4% ▼ -7.2%
(50)+ 73.7% 77.1% ▼ -3.4%
(100)+ 72.3% 74.3% ▼ -2.0%
(200)+ 55.1% 57.3% ▼ -2.2%
Short- and medium-term momentum moderated with all SMA categories posting a decline. The steep drop in SMA(20)+ is particularly notable, suggesting a loss of immediate-term price support across a significant portion of the market.
New Highs / New Lows (NH/NL):
-
New Highs: 7.2% (vs. 9.6% on Jul 23)
-
New Lows: 0.8% (slight uptick from 0.6%)
New highs fell, while new lows remained low but edged slightly higher. This confirms a cooling trend in bullish momentum without yet triggering broader breakdowns.
Short- and Medium-Term Breadth Trends:
1-Week Trend:
-
Adv Week: 63.2% (down from 75.7%)
-
Decl Week: 35.7% (up from 23.2%)
The weekly trend still favors advancers but is weakening fast. The +12.5% drop in 1-week advancing stocks is the largest 1-day deterioration in over a week.
1-Month Trend:
-
Adv Month: 72.8% (steady)
-
Decl Month: 26.6%
Monthly breadth remains intact with over 70% of stocks still advancing over that time horizon, although this figure did not improve, suggesting a plateau in medium-term strength.
3-Month Trend:
-
Adv 3 Month: 75.3%
-
Decl 3 Month: 23.8%
-
Adv 25% 3 Month: 21.6%
-
Decl 25% 3 Month: 4.0%
The 3-month breadth metrics remain healthy, and leadership (stocks up 25%+) held up relatively well. There’s still underlying medium-term strength, though the daily/weekly figures are diverging.
Contextual Comparison: July 23 vs. July 24
The previous session (July 23) showed broad strength, with nearly 70% of stocks advancing and a robust reading across all SMA thresholds. It appeared to be a confirmation of July 22’s strength, suggesting a bullish continuation was possible.
However, the sharp reversal on July 24 casts doubt on that narrative. Participation weakened sharply, and the number of stocks closing above key SMAs declined. The short-term trend has now turned choppy and shows a lack of commitment from buyers after the midweek strength.
Sentiment & News Context
While no major macroeconomic reports were released during trading hours on July 24, cautious sentiment likely stemmed from:
-
Mixed Q2 earnings reports among large-cap tech and financials.
-
Anticipation of upcoming GDP and PCE inflation data, scheduled for Friday.
-
Traders may have opted to de-risk into the close ahead of Friday’s data, which could explain the one-day pullback in breadth participation.
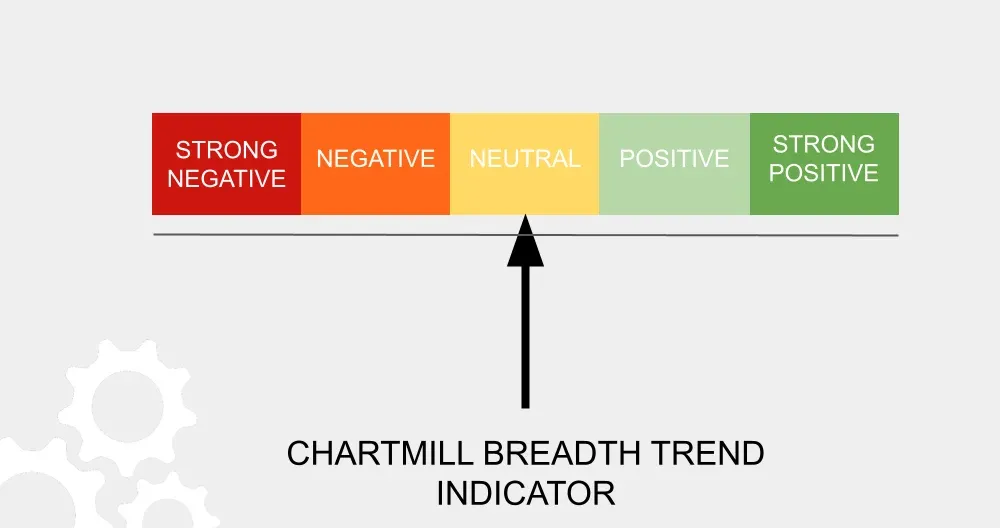
Conclusion & Trend Rating
The July 24 session showed a clear deterioration in short-term breadth, disrupting what had been a modest bullish recovery earlier in the week. Although medium- and long-term trends remain intact, the weakening short-term participation suggests caution is warranted.
The market currently finds itself in a fragile zone: not aggressively selling off, but failing to build consistent upward momentum across broader sectors.
Breadth Trend Rating: Neutral While the medium- and long-term outlook is still constructive, short-term breadth is choppy and has lost its bullish momentum, bringing the overall tone back to a neutral stance. Tomorrow’s session (July 25) will be critical to determine if Thursday was merely a pause or the start of a broader retracement.
Kristoff - ChartMill
Next to read: Market Monitor News, July 25