

(All data & visualisations by ChartMill.com)
Daily Market Trend Analysis – July 15, 2025 (After Market Close)
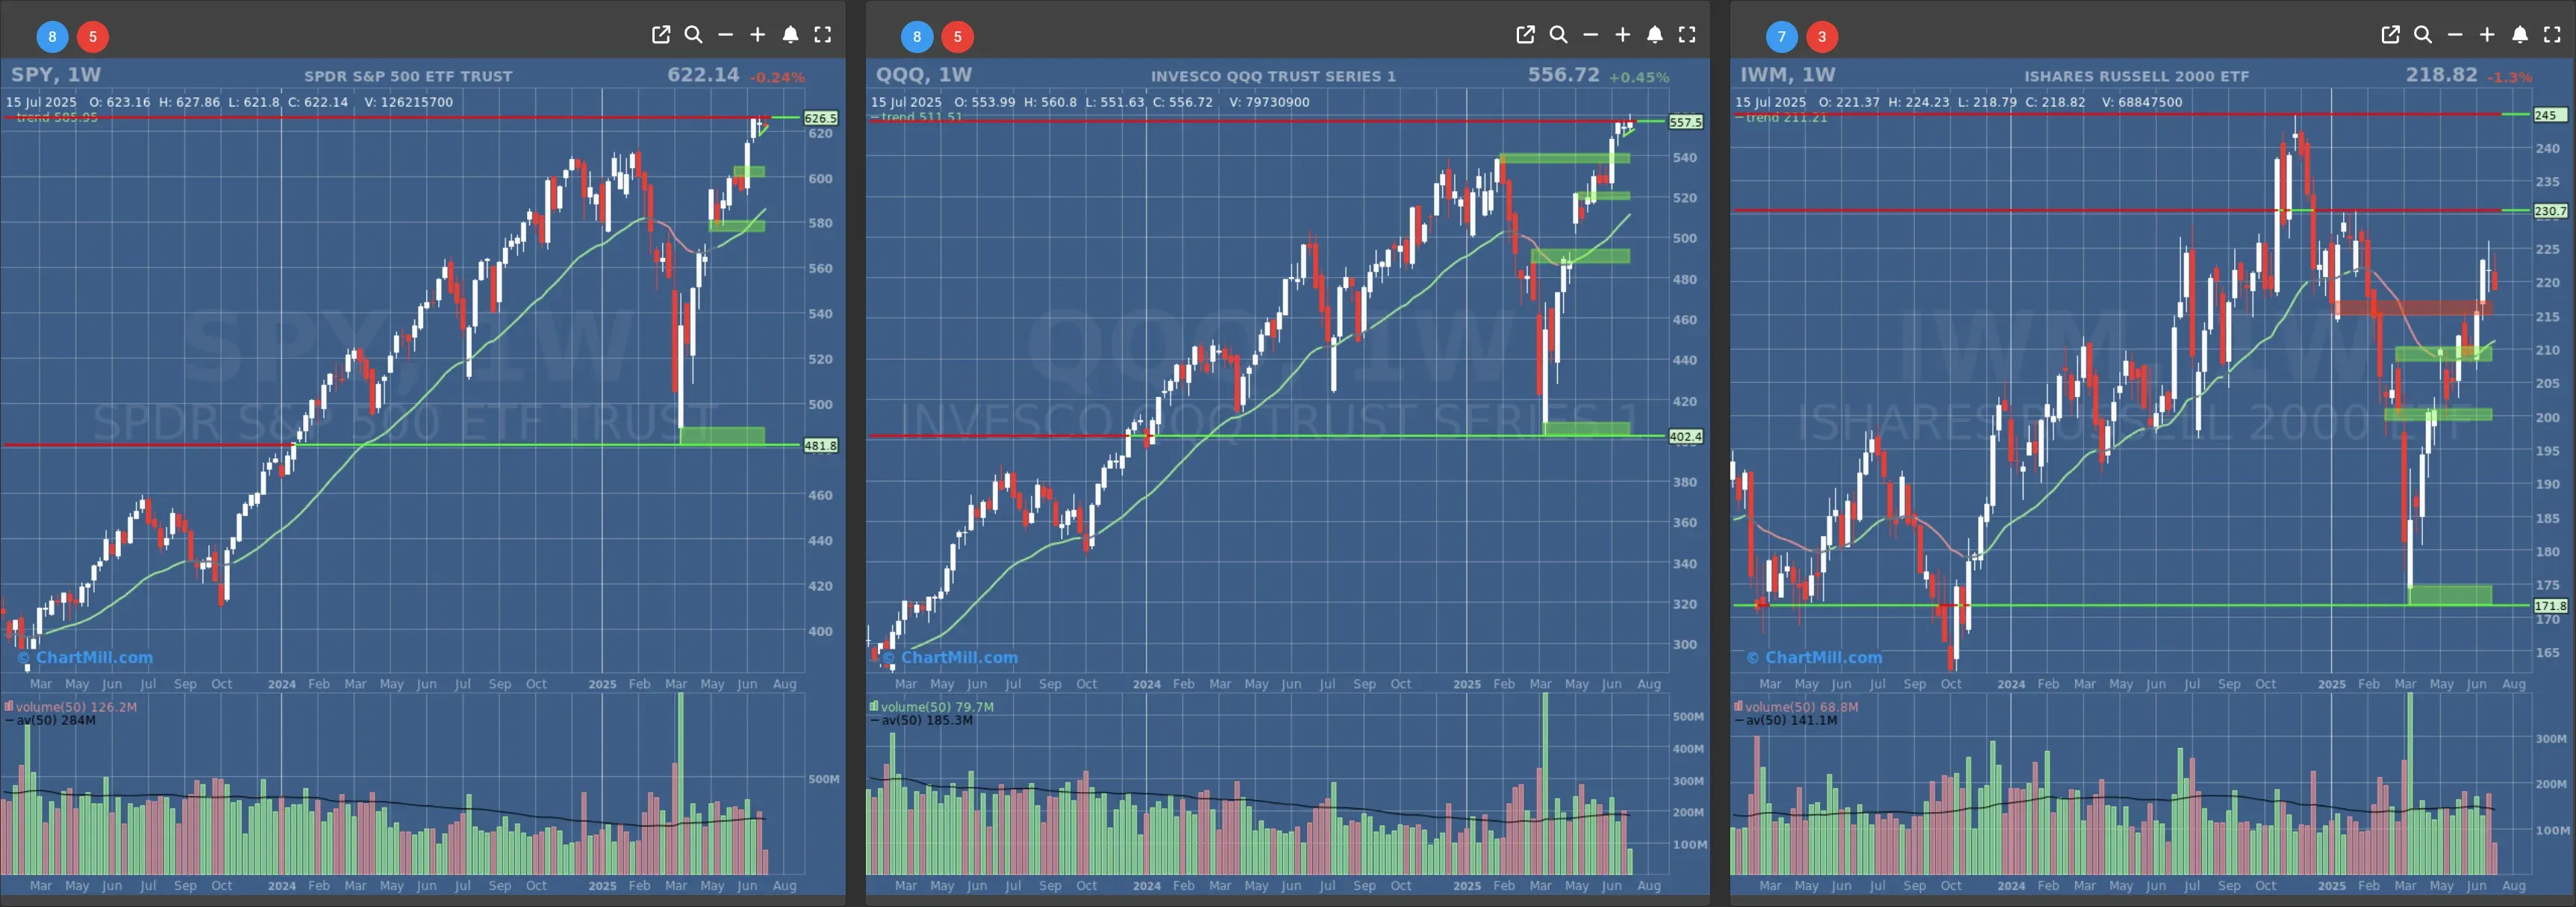
False breakouts for SPY and QQQ, heavy down day for IWM
Short Term Trend

- Short-Term Trend: Bullish (no change)
- Next Support at $600 to $610
- Next Resistance at /
- Volume: Slightly Above Average (50)
- Pattern: Gap Up - Bearish Engulfing Candle - Down Day - False B/O from Ascending Triangle
- Short-Term Trend: Bullish (no change)
- Next Support at $540
- Next Resistance at /
- Volume: At Average (50)
- Pattern: Gap Up - Down Day - False B/O from Ascending Triangle
- Short-Term Trend: Bullish (no change)
- Next Support at $210
- Next Resistance at $215 to $220
- Volume: Well Above Average (50)
- Pattern: Gap Up - Bearish Engulfing Candle - Down Day
Long Term Trend
- Long-Term Trend: Positive (no change)
- Long-Term Trend: Positive (no change)
- Long-Term Trend: Positive (no change)
Daily Market Breadth Analysis – July 15, 2025 (After Market Close)
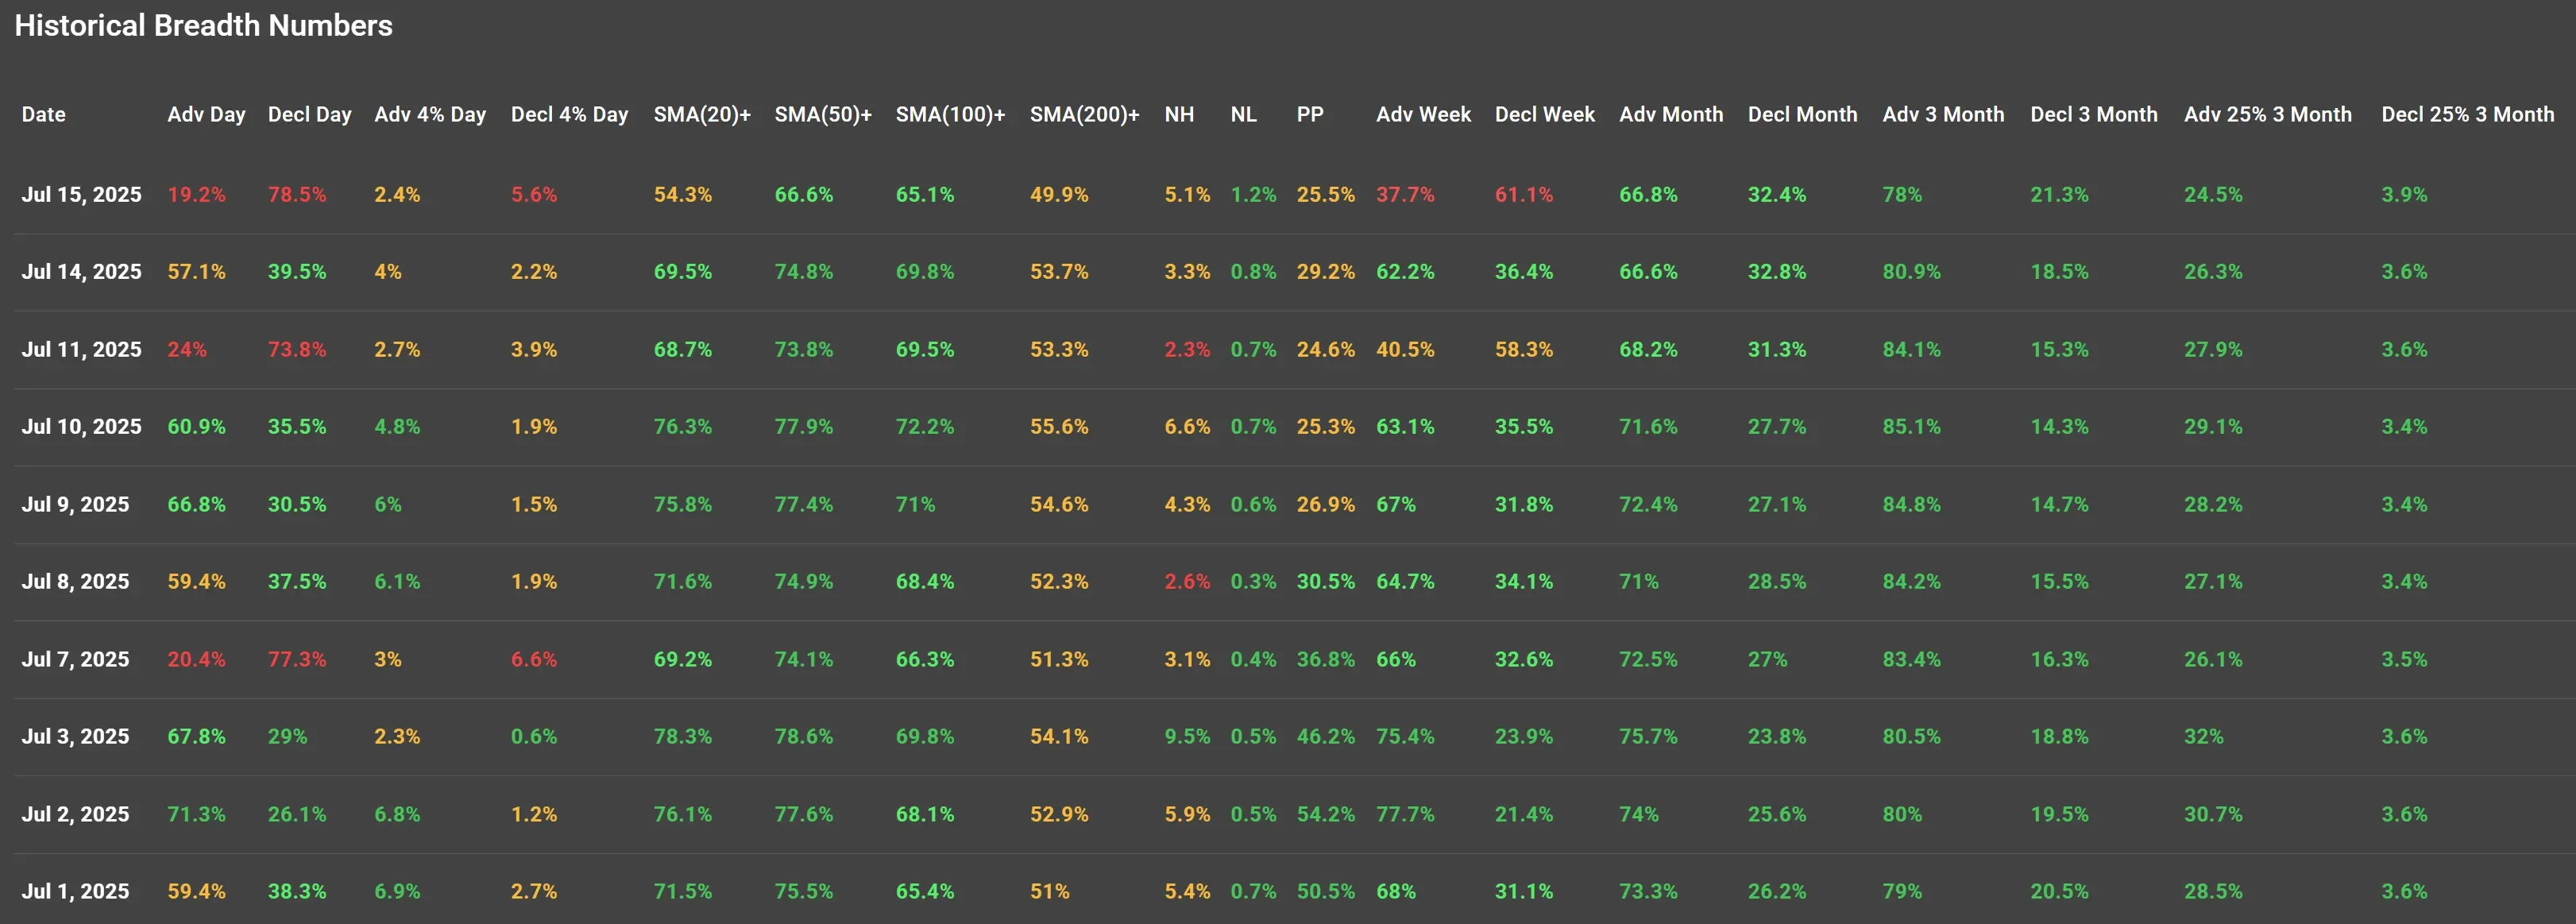
U.S. equity markets showed a sharp deterioration in market breadth on Tuesday, July 15, 2025. After a relatively balanced session on Monday, the latest data reveals significant weakness across most breadth indicators, pointing to a broad-based decline in participation and momentum across the stock market.
Daily Breadth Breakdown
Advancing vs. Declining Stocks:
Only 19.2% of stocks advanced on the day, while 78.5% declined, a stark reversal from the previous session (Jul 14: 57.1% advancers vs. 39.5% decliners).
This is the weakest advancing percentage in the past ten sessions.
High-Magnitude Moves:
Just 2.4% of stocks gained more than 4%, while 5.6% declined more than 4%, reflecting increased downside volatility.
Stocks Above Key Moving Averages:
-
SMA(20): 54.3% ↓ (from 69.5% on Jul 14)
-
SMA(50): 66.6% ↓ (from 74.8%)
-
SMA(100): 65.1% ↓ (from 69.8%)
-
SMA(200): 49.9% ↓ (from 53.7%)
The pullback in these indicators shows that the selloff was broad enough to push a considerable number of stocks below important trend levels.

New Highs and New Lows (NH/NL)
New Highs (NH) dropped to 5.1%, while New Lows (NL) ticked up slightly to 1.2%, reversing the improvement seen on Jul 14. Despite the selloff, the lack of a spike in new lows suggests the decline was swift but not yet structurally damaging across most stocks.
Short-Term Breadth Trends (1W, 1M)
Advancing Week fell to 37.7%, while Declining Week jumped to 61.1%, confirming a pivot toward weakness that began late last week.
Monthly Advance/Decline numbers remained relatively stable:
-
Adv Month: 66.8%
-
Decl Month: 32.4%
This suggests that although the short-term breadth has deteriorated quickly, the broader trend over the last 20 trading sessions is still positive.
Three-Month Breadth Trend
-
Adv 3 Month: 78% (holding steady despite the drop)
-
Decl 3 Month: 21.3%
-
Adv 25% 3M: 24.5%
-
Decl 25% 3M: 3.9%
These longer-term figures remain strong and continue to reflect a longer-term uptrend, though the short-term weakness warrants caution.
Context and Interpretation
This steep decline in breadth came after a brief relief rally on Monday (Jul 14), where most metrics had improved. That bounce now appears to have been a one-day event rather than a sustainable reversal.
The deterioration on July 15 reflects a renewed wave of selling, which could be attributed to:
-
Continued concerns over corporate earnings season, with key tech results still pending.
-
Rising U.S. Treasury yields intraday, putting pressure on growth and tech stocks.
-
A cautious sentiment ahead of upcoming economic data due later in the week, including housing and industrial production numbers.
Importantly, this weakness started to manifest in breadth as early as Friday, July 11, but was masked by the temporary bounce on Monday.
Conclusion
The market breadth picture has quickly shifted from mixed to decisively weak. A large majority of stocks declined, and fewer remain above key moving averages.
While the longer-term indicators still support a bullish structure, the short-term pressure suggests caution is warranted.
If this trend continues for another session or two, we may begin to see spillover into medium-term metrics and potential technical breakdowns in leadership stocks.
Market participants should closely monitor follow-through action on July 16 to determine if Tuesday’s drop was an isolated event or the beginning of a broader corrective move.
Kristoff - ChartMill
Next to read: Market Monitor News, July 16