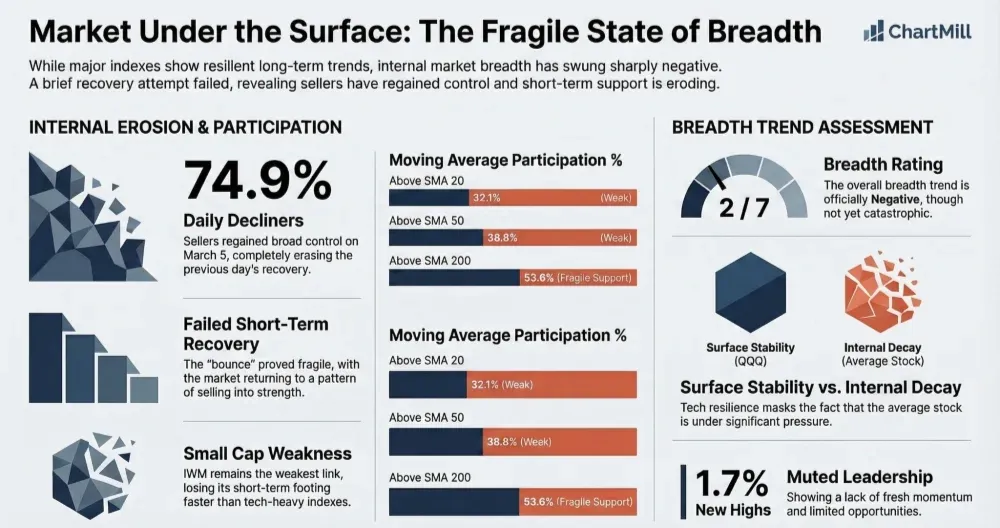
The one-day recovery in breadth did not hold. Thursday’s data swung back sharply negative, with heavy daily and weekly selling pressure, a clear drop in participation above key moving averages, and continued weakness in small caps. The long-term trend in the major indexes is not broken yet, but short-term breadth remains under real pressure.
Index Overview (SPY, QQQ, IWM)
Short Term (Daily)

Long Term (Weekly)
The clearest message from the index charts is that the market remains in a short-term repair phase at best, not in a renewed expansion phase.
SPY
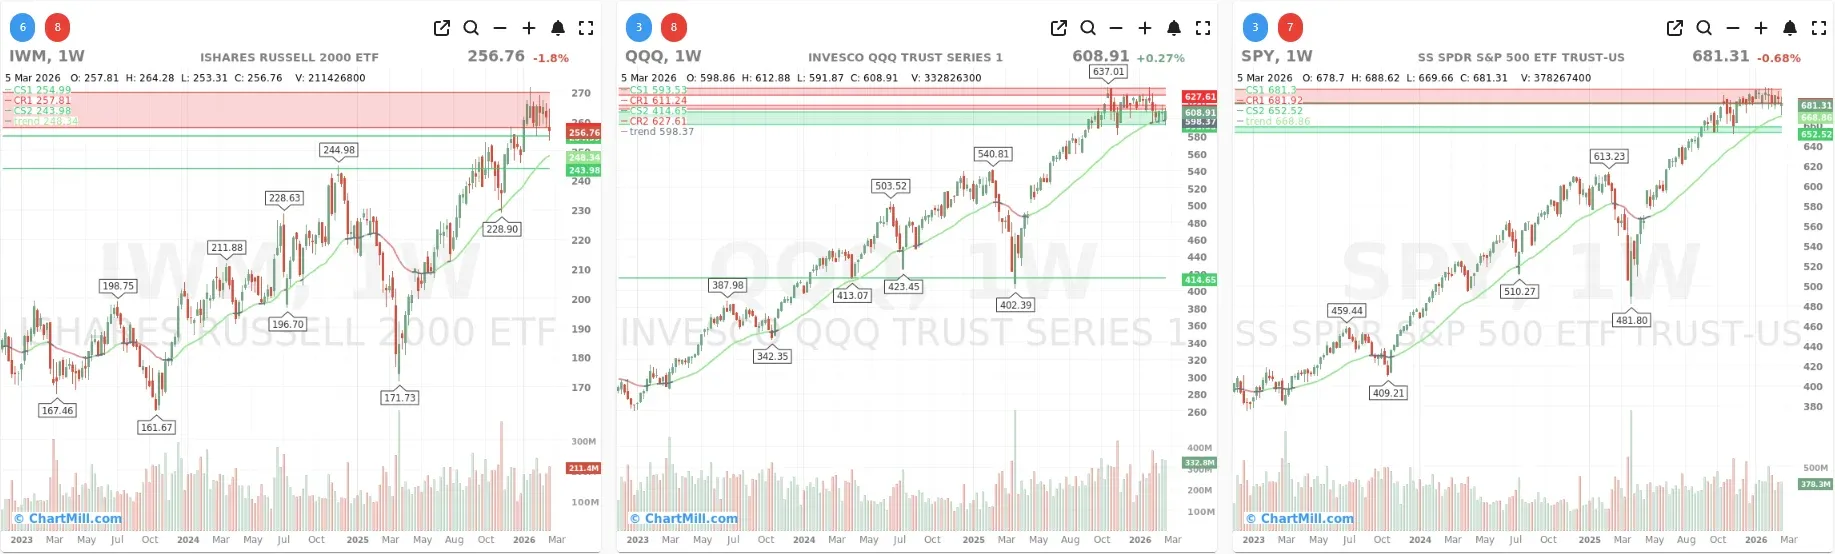
SPY closed at 681.31, down 0.56%. On the daily chart, price remains below both the EMA9 (684.86) and EMA21 (686.27). That keeps the short-term structure soft and suggests the recent range remains unresolved. On the weekly chart, SPY is still holding above its rising long-term trend line, so the bigger picture is not broken, but upside progress has clearly stalled.
QQQ
QQQ held up better, closing at 608.91, down 0.3%. Relative to SPY and especially IWM, tech remains the most resilient index. Even so, the daily chart still looks more like consolidation after damage than leadership with conviction. QQQ is hovering around its short-term moving averages rather than reclaiming higher ground decisively. On the weekly chart, it remains in a constructive longer-term uptrend, but momentum has flattened.
IWM
IWM was again the weakest link, closing at 256.76, down 1.9%. The daily chart shows clear short-term weakness, with price below both the EMA9 (261.33) and EMA21 (262.04). This matters because small caps had led the rebound attempt earlier in the week. That leadership did not last. On the weekly chart, IWM is still above its long-term trend line, but it is much closer to losing its short-term footing than SPY or QQQ.
So while the weekly trend structure for all three major ETFs is still broadly intact, the daily charts continue to reflect hesitation, failed follow-through, and weak internal sponsorship. That remains the key issue.
Breadth Analysis
Thursday’s breadth data is a clear setback and, more importantly, it reinforces the main concern from the previous session: the rebound was fragile.
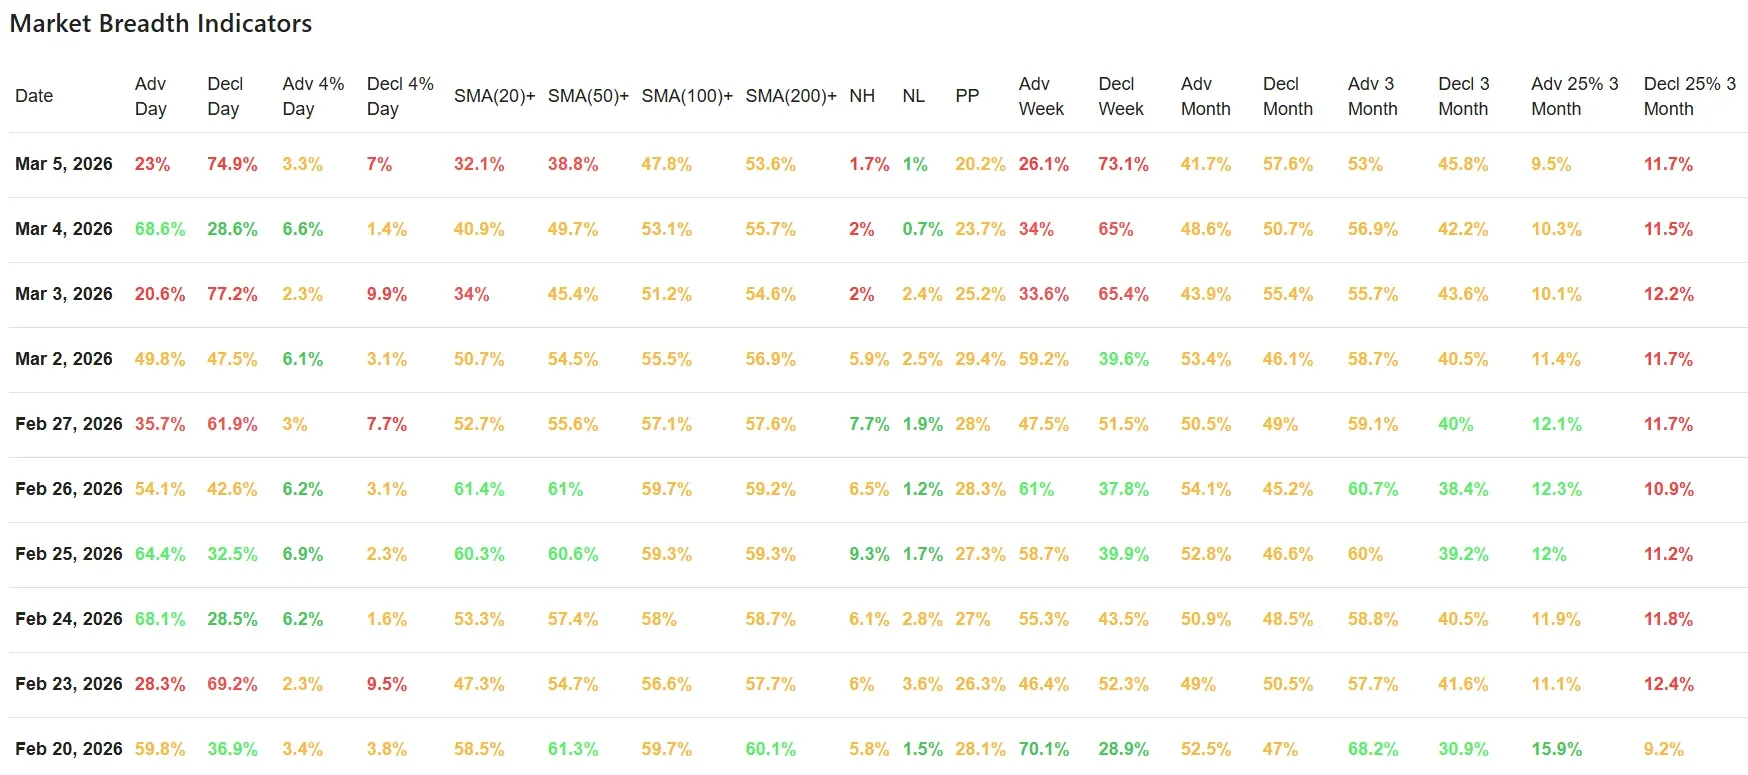
On March 4, breadth had improved meaningfully, with 68.6% advancers versus 28.6% decliners. That looked like a possible stabilization day, but even then the broader message was that one good session was not enough to repair the damage from the repeated selling waves seen in recent days.
Thursday confirmed that concern.
On March 5, daily breadth turned sharply negative again:
-
Advancers: 23%
-
Decliners: 74.9%
-
Advancing 4%+: 3.3%
-
Declining 4%+: 7.0%
That is a session where sellers regained control quickly and broadly. The rebound attempt from the prior day failed to attract durable participation.
The same pattern shows up in the trend participation data.
Participation above key moving averages weakened sharply
Compared with the prior session, the percentage of stocks above their key moving averages fell across the board:
-
Above SMA20: down to 32.1% from 40.9%
-
Above SMA50: down to 38.8% from 49.7%
-
Above SMA100: down to 47.8% from 53.1%
-
Above SMA200: down to 53.6% from 55.7%
This is important.
The sharpest deterioration remains in the short- and intermediate-term layers of the market. Only about one-third of stocks are above the 20-day average, and fewer than 40% remain above the 50-day average. That is weak participation and suggests the average stock is under much more pressure than the headline indexes alone might imply.
The longer-term reading above the SMA200 is still slightly above 50%, which prevents the picture from becoming outright catastrophic. But that number is also slipping, which tells us the weakness is no longer confined to a brief short-term shakeout.
New highs remain subdued, but new lows are not exploding.
There is one moderating factor in the data.
-
New Highs: 1.7%
-
New Lows: 1.0%
This is still a muted environment in terms of expansion at both extremes. That suggests the market is not in a full panic-style washout. But it also highlights the absence of strong leadership. The market is not generating many fresh highs, and that is consistent with the low PP reading of 20.2%, which points to a thin opportunity set.
In other words, this is not a market with broad internal momentum. It is a market where many stocks are slipping, but only a limited group is breaking down in dramatic fashion. That often creates a frustrating environment rather than a clean directional one.
Weekly and monthly breadth remain under pressure
The daily reversal was not isolated. It also showed up in the broader timeframes.
Weekly breadth
-
Adv Week: 26.1%
-
Decl Week: 73.1%
That is very weak and notably worse than the prior day’s already poor weekly split of 34% advancing and 65% declining. So the short-term bounce did not improve the weekly internal picture. In fact, it deteriorated further.
Monthly breadth
-
Adv Month: 41.7%
-
Decl Month: 57.6%
Monthly breadth remains negative as well. This is not yet extreme, but it confirms that weakness is not confined to just a couple of isolated sessions.
Three-month breadth
-
Adv 3 Month: 53%
-
Decl 3 Month: 45.8%
The 3-month data is still slightly positive, but that cushion continues to narrow. Also worth noting:
-
Adv 25% in 3 months: 9.5%
-
Decl 25% in 3 months: 11.7%
That means more stocks are down 25% over the last three months than up 25%, which is another sign that underlying leadership has faded.
Context versus the previous breadth update
The previous article described the bounce as fragile, and Thursday’s data strongly supports that interpretation.
What changed was not the broad narrative, but the confirmation. Wednesday hinted at a possible internal rebound. Thursday showed that buyers still lack sustained control. Instead of follow-through, the market slipped back into the same pattern seen repeatedly over the last two weeks: brief relief, followed by renewed selling pressure.
That is especially visible in three areas:
-
First, small caps rolled over again, which weakens the idea that risk appetite is improving.
-
Second, participation above the 20-day and 50-day averages fell hard again, showing that short-term damage is spreading faster than it is being repaired.
-
Third, weekly breadth worsened further, which means the market is not just choppy day to day. The broader short-term trend is still leaning lower internally.
Human context
From a market psychology perspective, this looks like an environment where traders remain quick to sell strength and reluctant to commit aggressively after one good day. That usually happens when confidence is low and participants are still uncertain whether recent weakness is just consolidation or the start of a deeper correction.
QQQ’s relative resilience helps prevent the picture from turning fully bearish at the index level, but breadth keeps telling a more cautious story underneath. When the average stock remains weak while the large-cap indexes hold up better, the market can look healthier on the surface than it really is.
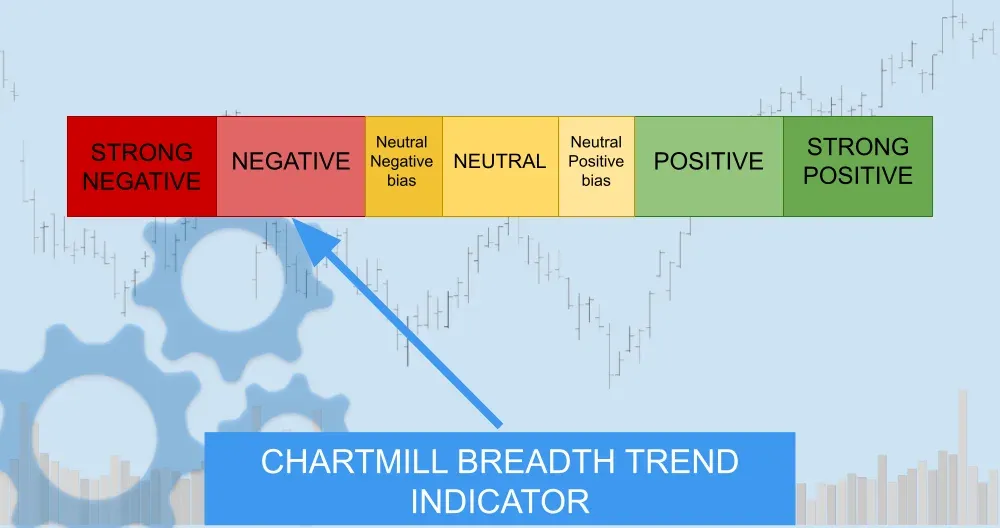
Breadth trend rating
Current breadth trend rating: 2 / 7 — Negative
The long-term weekly trends in SPY, QQQ, and IWM are still broadly positive, which is why this is not a “very negative” reading. But the latest breadth data is clearly negative: daily participation is poor, weekly breadth is weak, short-term trend participation has deteriorated sharply, and the prior bounce failed almost immediately.
Conclusion
Thursday’s market breadth data is a clear reminder that the market is still struggling to build internal support. The bounce from the prior session did not evolve into a meaningful improvement in participation. Instead, breadth snapped back negative, with heavy decliners, weakening moving-average participation, and renewed small-cap underperformance.
Kristoff - ChartMill
Next to read: Oil Surges 4%, Reviving Inflation Fears That Sent Wall Street Sliding