Index Overview (SPY, QQQ, IWM)
Short Term (Daily)
Long Term (Weekly)

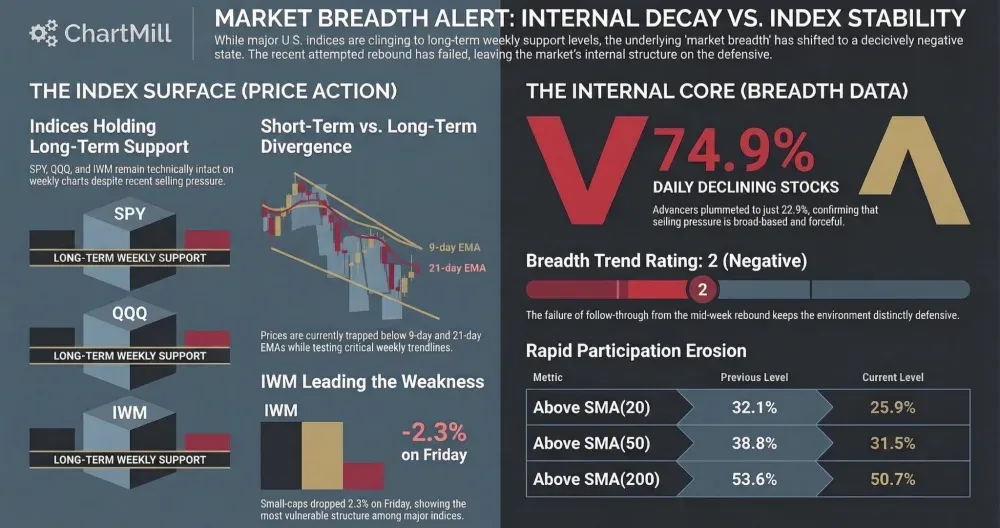
Breadth weakened further on Friday, confirming that Wednesday’s rebound was not the start of a durable recovery. While the major indexes are still holding above important longer-term weekly trend levels, the underlying participation data has deteriorated enough to keep the near-term backdrop clearly on the defensive.
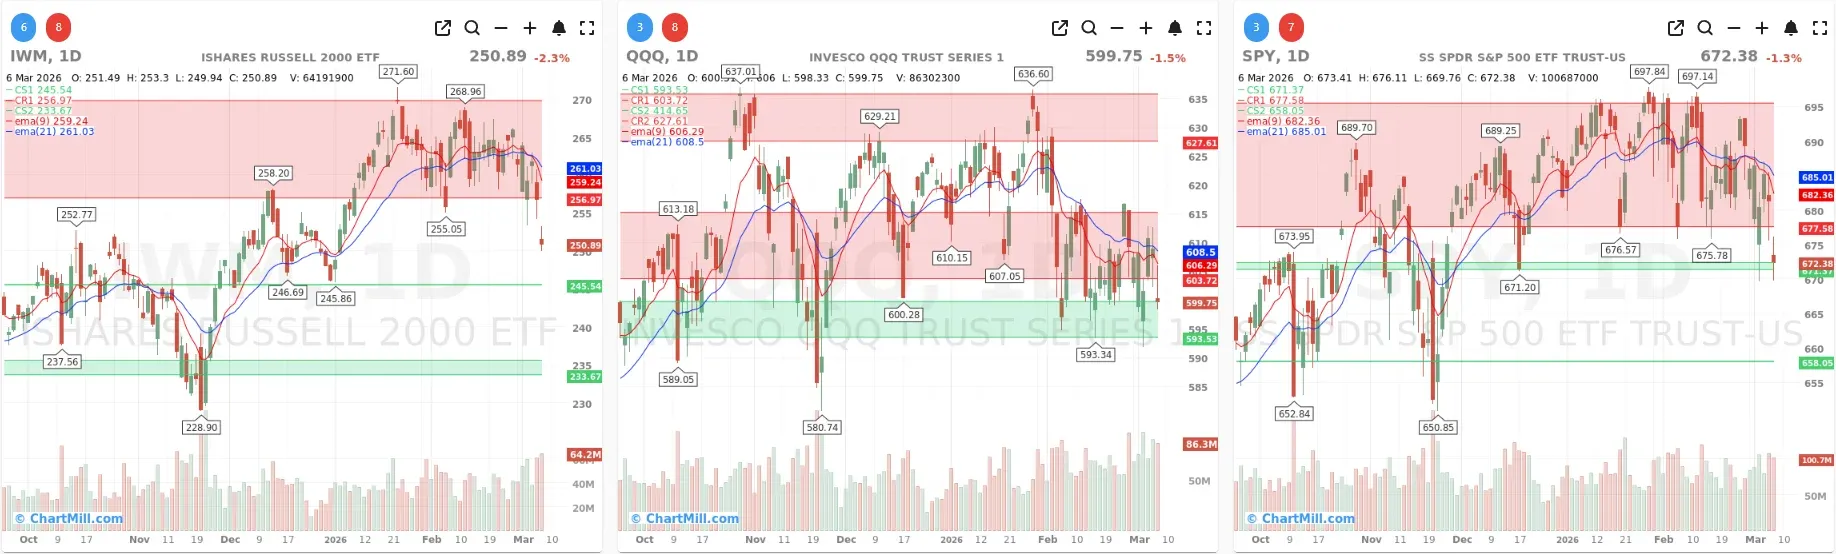
SPY lost 1.3% and closed at 672.38. On the daily chart, price remains below both the 9-day and 21-day EMA, which keeps the short-term trend under pressure. More importantly, SPY is now testing a key support area around the 672 zone. That level held into the close, but the index is clearly no longer trading from a position of strength. On the weekly chart, SPY is still marginally above its positive long-term trend line, so the bigger trend has not fully broken down yet, but the buffer is getting thin.
QQQ fell 1.5% to 599.75. Like SPY, it remains below both short-term moving averages on the daily timeframe. The chart shows continued rejection from the 620-628 resistance zone, and price is now drifting back toward the lower support band near the mid-590s. On the weekly chart, QQQ is still holding just above its long-term trend indicator, but only barely. That keeps the long-term structure technically intact, while the short-term picture continues to deteriorate.
IWM was again the weakest of the three, dropping 2.3% to 250.89. Small caps are showing the clearest relative weakness at the moment. The daily chart has rolled over decisively, with price well below the 9-day and 21-day EMA, and Friday’s move pushed IWM deeper away from the recent consolidation zone. On the weekly chart, IWM still trades above its rising long-term trend line, but compared with SPY and QQQ, the small-cap structure looks much more vulnerable.
Taken together, the index charts show a market that is losing short-term support while still trying to defend its longer-term uptrend. That tension is exactly what the breadth data reflects as well.
Breadth Analysis
Breadth Data: Another Very Weak Day
Friday’s breadth numbers were poor across the board and offered little evidence of stabilization.
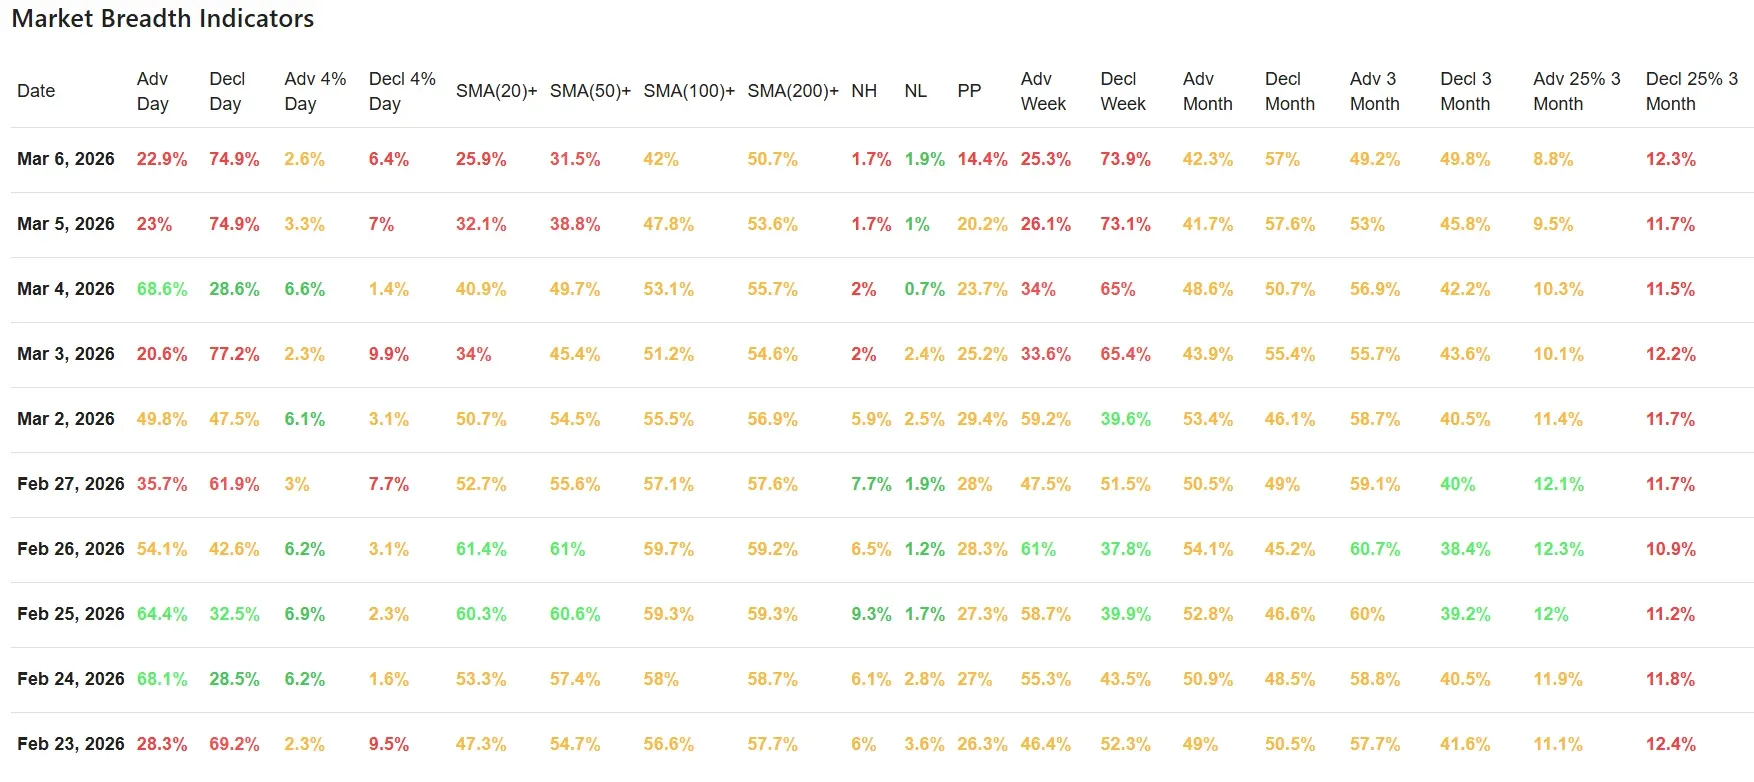
Daily advancers came in at just 22.9%, while 74.9% of stocks declined. That is nearly identical to Thursday’s already weak reading of 23.0% advancing versus 74.9% declining. In other words, Thursday’s weakness was not an isolated stumble. Friday confirmed it.
The more aggressive internal measures were weak as well. Only 2.6% of stocks gained more than 4% on the day, while 6.4% fell more than 4%. Thursday already showed poor downside expansion, and Friday kept that pressure firmly in place. This tells us that the selloff is not just broad, but also increasingly forceful in individual names.
The participation metrics versus key moving averages continued to erode:
-
Above SMA(20): 25.9% down from 32.1%
-
Above SMA(50): 31.5% down from 38.8%
-
Above SMA(100): 42.0% down from 47.8%
-
Above SMA(200): 50.7% down from 53.6%
This is one of the most important developments of the day. Thursday already warned that the rebound from Wednesday had failed to improve the broader structure in any lasting way. Friday confirms that deterioration is continuing, not stabilizing. The drop in the 20-day and 50-day participation figures is especially notable, because it shows that short- and medium-term trend damage is spreading quickly.
New Highs, New Lows, and Pocket Pivots
New highs remained muted at 1.7%, while new lows rose to 1.9% from 1.0% the day before. That shift may not look dramatic in absolute terms, but it reinforces the message that upside leadership is scarce and downside leadership is slowly gaining ground again.
Pocket pivot activity also weakened further, dropping from 20.2% to 14.4%. After Wednesday’s stronger session briefly lifted internal momentum, both Thursday and Friday showed that buyers were unable to maintain follow-through. When pocket pivot participation fades this quickly, it usually signals that institutional demand is not broad enough to support a sustainable advance.
Weekly and Monthly Breadth Also Remain Weak
The weekly data remains especially heavy. Just 25.3% of stocks advanced on the week, while 73.9% declined. That is even worse than Thursday’s already weak weekly profile. It also fits what the charts are showing: this is no longer just a one-day dip, but a broader short-term retrenchment.
The monthly data continues to lean negative as well:
-
Advancing month: 42.3%
-
Declining month: 57.0%
That tells us the recent weakness is not limited to the last few sessions. The broader one-month trend has already shifted toward more stocks participating on the downside than on the upside.
The 3-month figures are now essentially balanced, with 49.2% advancing versus 49.8% declining. That is a meaningful deterioration from Thursday, when the 3-month data still leaned modestly positive. This matters because it shows the market is losing even its intermediate-term internal advantage.
A similar message comes from the longer swing metrics:
-
Adv 25% over 3 months: 8.8%
-
Decl 25% over 3 months: 12.3%
Stocks with substantial 3-month losses continue to outnumber those with major gains. That is not the profile of a healthy broad market.
Context Versus the Previous Session
Compared with Thursday’s analysis, Friday looks more like confirmation than a surprise.
Thursday already told us that Wednesday’s strong rebound had not repaired the market internally. The breadth collapse on Thursday suggested the bounce was fragile and likely event-driven rather than the start of a renewed accumulation phase. Friday’s numbers validate that view. Instead of stabilizing after Thursday’s selloff, the market delivered another session with deeply negative internals, further weakening participation and pushing the major ETFs back toward critical support.
So the key difference versus the prior session is not that the trend changed again, but that the weakness broadened and became more convincing.
Human Interpretation
What the market is showing right now is hesitation turning into caution.
The headline indexes are not in outright collapse. On the weekly charts, all three major ETFs still retain positive long-term trend structures. But underneath that surface, fewer and fewer stocks are holding above short- and intermediate-term trend levels, upside leadership remains scarce, and small caps are weakening faster than large caps.
That combination usually reflects a market where investors are becoming more selective and more defensive. Buyers are still willing to support major index levels, but they are doing so without broad conviction. Until participation improves meaningfully, rallies should be treated with skepticism.
Breadth Trend Rating
Current breadth trend rating: 2 — Negative
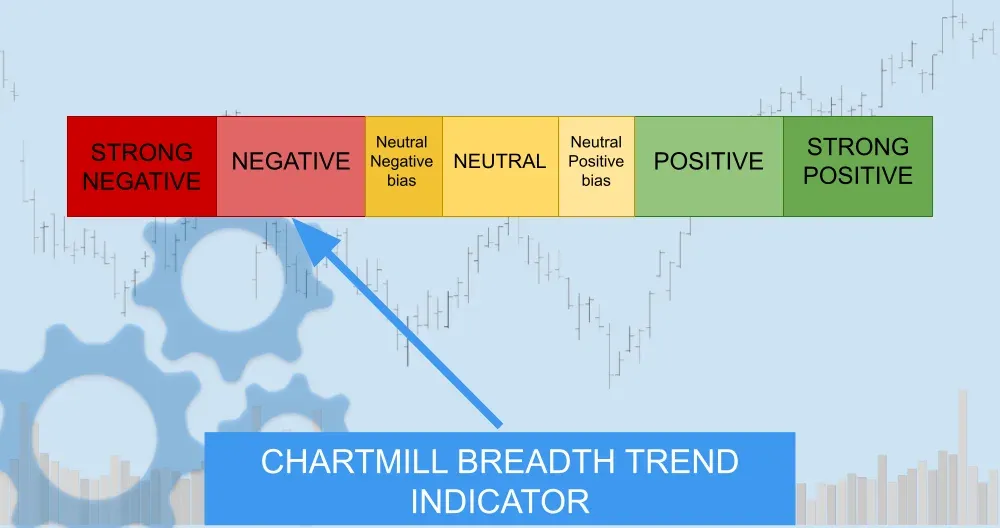
The reason this is not rated “very negative” is that the longer-term weekly trend structure of SPY, QQQ, and IWM has not fully broken yet, and roughly half of stocks still remain above their 200-day moving average. But the short-term and medium-term breadth picture is clearly deteriorating, daily internals are decisively weak, and the follow-through from Wednesday’s rebound has now failed. That keeps the market in a distinctly negative breadth environment.
Conclusion
Friday’s market breadth data confirms that the rebound seen earlier in the week has lost credibility. Selling remained broad, downside pressure stayed elevated, and participation across key moving averages deteriorated further. The major indexes are still trying to defend important weekly trend levels, but the underlying internals continue to argue for caution.
Unless breadth improves quickly and convincingly, this remains a market where the charts may look only moderately damaged at the index level while the internals tell a much weaker story.
Kristoff - ChartMill
Next to read: Oil Shock, Stagflation Fears, and a Bright Spot in AI — Wall Street Ends the Week in the Red