U.S. market breadth remained firmly negative on March 13, even though the one-day advance/decline reading improved somewhat from the extremely weak March 12 session. The major indexes are now testing key support zones, while underlying participation remains too weak to suggest any durable improvement in market health.
Index Overview (SPY, QQQ, IWM)
Short Term (Daily)

Long Term (Weekly)
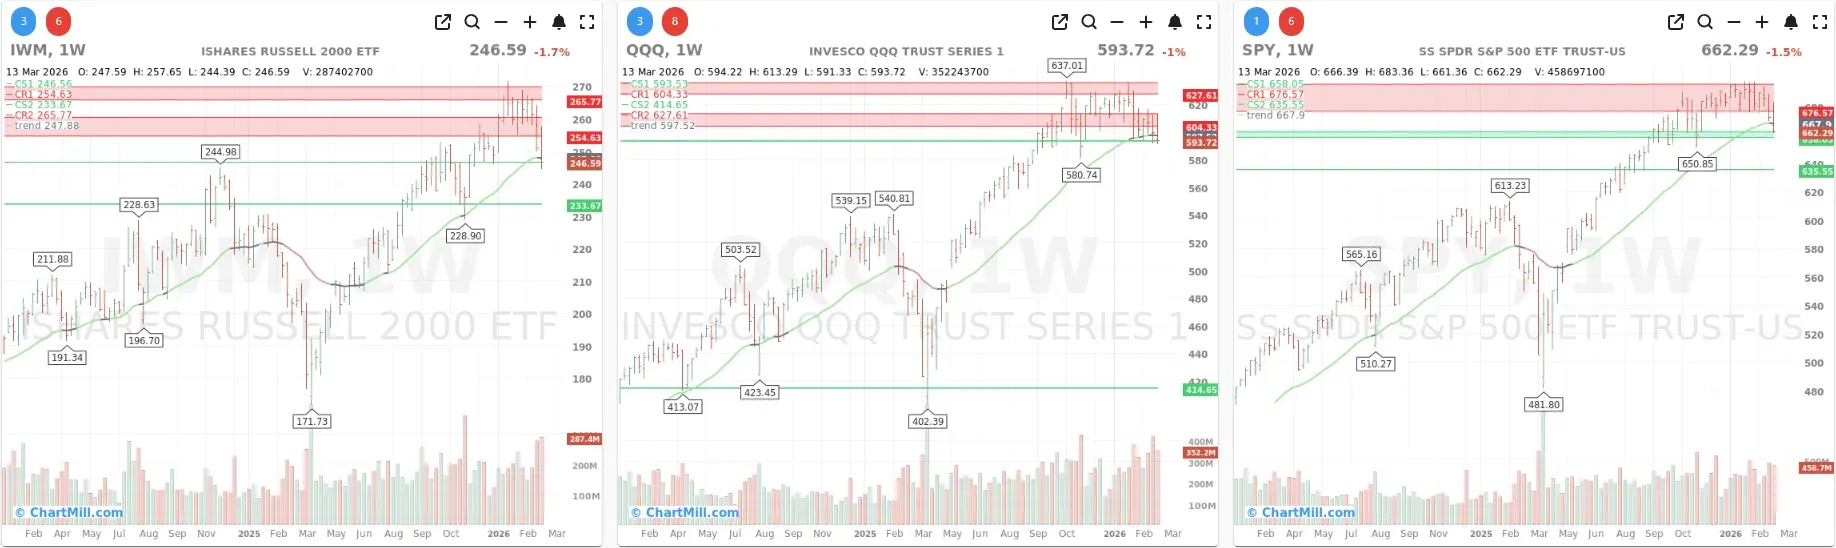
SPY closed at $662.29, down 0.57%, and continues to weaken on the daily chart. Price is now clearly below both the 9-day EMA (674.1) and the 21-day EMA (679.8), which confirms the short-term loss of momentum. The ETF is now pressing into an important support area around 658-662. If that area fails, the next more meaningful downside reference sits closer to 635.5.
On the weekly chart, the longer-term trend is still intact. SPY remains above its rising 30-week trend line, which sits near 667.9, although this week’s pullback is now testing that area. So the short-term picture is deteriorating, but the long-term trend has not fully broken yet.
QQQ closed at $593.72, down 0.59%, and remains one of the weaker large-cap index ETFs from a short-term technical perspective. It is trading below both the 9-day EMA (602.8) and 21-day EMA (606.1), and is sitting right on a key support zone around 593-600. That level is now critical. A failure there would likely open the door to a deeper retracement.
The weekly chart still shows a positive longer-term structure, but just barely. QQQ is now testing its rising long-term trend area near 597.5. In other words, the Nasdaq 100 is no longer just pulling back within an uptrend; it is now at a level where buyers need to show up.
IWM IWM closed at $246.59, down 0.33%, and continues to look relatively fragile. It remains below both the 9-day EMA (252.9) and 21-day EMA (257.0). Unlike SPY and QQQ, small caps are already sitting closer to the lower end of their recent range, and the daily chart suggests momentum has weakened materially after the failed attempt to hold above the late-February breakout zone.
On the weekly chart, IWM is still above its long-term trend line near 247.9, but only marginally. That makes small caps especially vulnerable here. If this area breaks decisively, the loss of trend support would be more meaningful than in SPY or QQQ.
Market Breadth Analysis
The broad message from the internals is still negative.
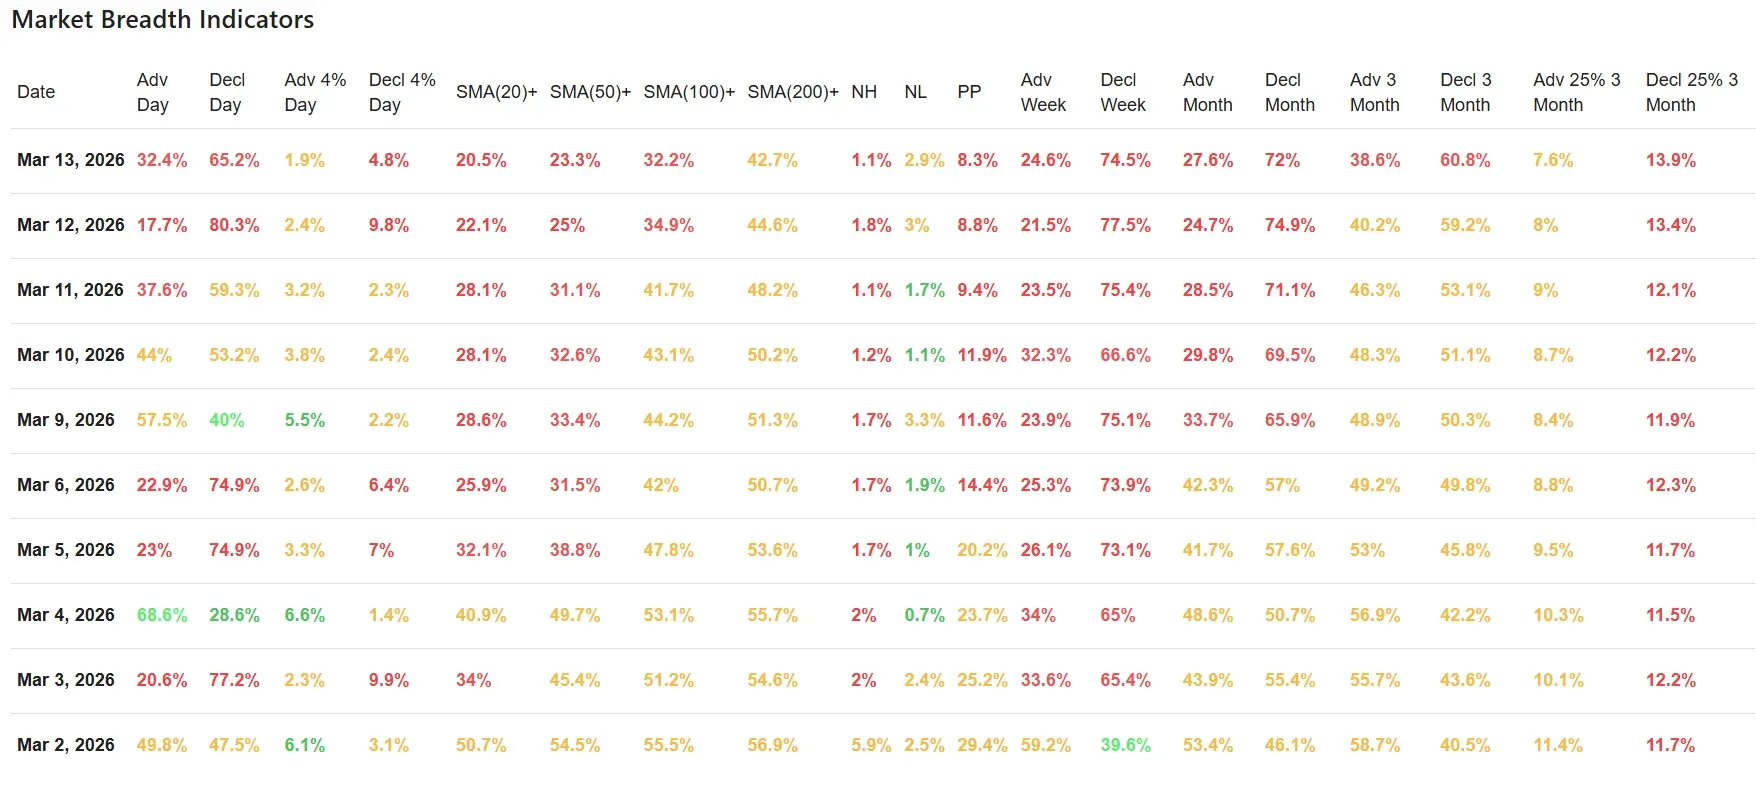
After Thursday’s extremely washed-out readings, Friday brought a modest day-to-day improvement, but not enough to change the character of the tape. Advancing stocks came in at 32.4%, up from 17.7% the day before, while declining stocks eased from 80.3% to 65.2%. That is better, but still clearly weak. This was not a healthy rebound day in breadth terms. It was merely “less bad.”
That same pattern shows up in the moving-average data:
-
SMA(20)+: 20.5%, down from 22.1%
-
SMA(50)+: 23.3%, down from 25.0%
-
SMA(100)+: 32.2%, down from 34.9%
-
SMA(200)+: 42.7%, down from 44.6%
This is an important point. Even though the one-day advance/decline figures improved versus Thursday, the broader participation metrics kept deteriorating. That tells us the market is still losing structural strength beneath the surface. The short-term damage is not being repaired; it is continuing to spread.
The leadership statistics also remain uninspiring. New highs were just 1.1%, while new lows rose to 2.9%. That is not panic territory, but it does confirm a market where fresh leadership is scarce and breakdowns still outnumber meaningful breakouts.
Pocket Pivots dropped to 8.3%, from 8.8% the previous day and well below the stronger readings seen earlier in the 10-day window. That is another sign that upside thrust is lacking.
Trend Across the Last 10 Trading Days
Looking at the full 10-day table, the deterioration remains clear.
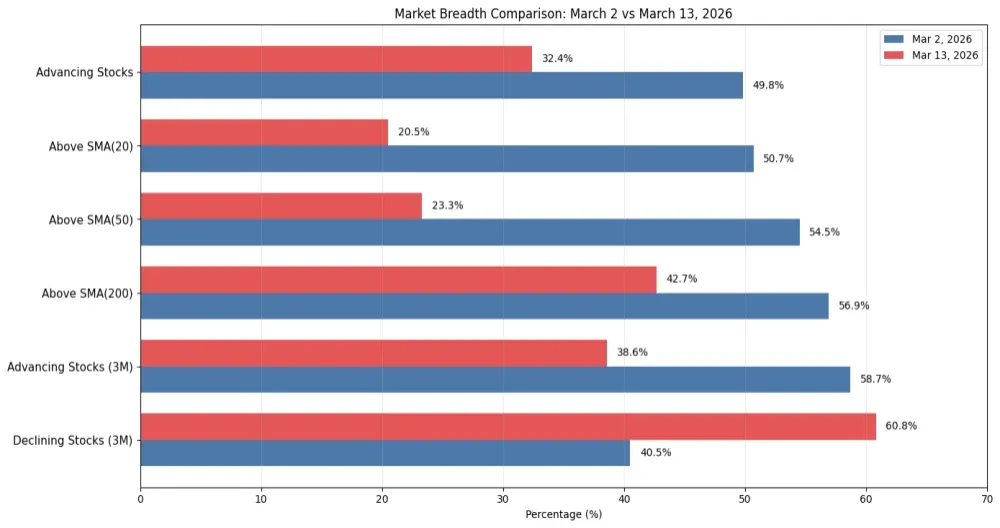
On March 2, the market still had relatively balanced internals, with:
-
49.8% advancing stocks
-
50.7% above the 20-day
-
54.5% above the 50-day
-
56.9% above the 200-day
By March 13, those numbers had slipped to:
-
32.4% advancing stocks
-
20.5% above the 20-day
-
23.3% above the 50-day
-
42.7% above the 200-day
That is a significant loss of participation in less than two weeks.
The medium-term breadth trends tell the same story:
-
Advancing stocks over 3 months: down from 58.7% on March 2 to 38.6%
-
Declining stocks over 3 months: up from 40.5% to 60.8%
So while the major indexes are only now approaching obvious technical support, the breadth data has already been weakening for days. That disconnect is important. It means the internals were warning ahead of the price damage becoming more visible in SPY, QQQ, and IWM.
Compared with the Previous Trading Day
Relative to Thursday, Friday did not bring a true improvement in the underlying picture.
Yes, the one-day breadth readings were less extreme. That matters at the margin. But nearly all the broader participation metrics worsened again, and the indexes themselves continued to close weak and near support. So this was not a “reversal” session in the data. It was more of a pause in an already deteriorating environment.
That fits the pattern from the previous breadth articles: oversold conditions can generate temporary stabilization in the daily numbers, but until the percentage of stocks reclaiming key moving averages starts improving, the broader market remains fragile.
Bottom Line
The market remains under pressure, and breadth is still weak enough to argue that this pullback has not finished repairing itself. Friday’s data was better than Thursday’s very poor one-day reading, but the improvement was too limited and too narrow to shift the broader message.
SPY, QQQ, and IWM are all now testing important support zones on both the daily and weekly timeframes. At the same time, only 20.5% of stocks are above their 20-day moving average and just 23.3% are above their 50-day. That is not the kind of participation backdrop that normally supports a healthy advance.
As long as the indexes remain below their short-term averages and the broader moving-average participation continues to erode, the market should still be viewed as being in a weak and vulnerable state.
Breadth Trend Rating
2/7 – Negative
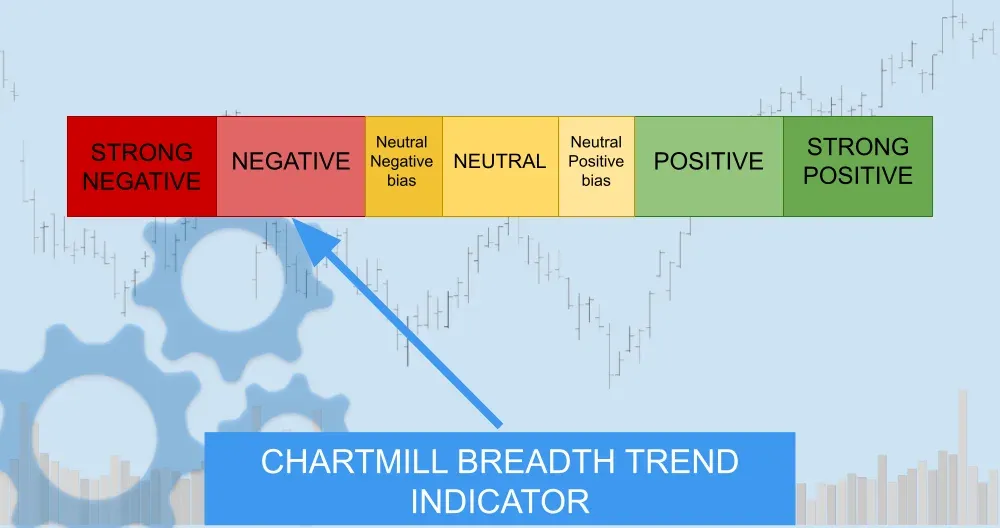
The rating stays at negative. Friday’s one-day breadth improved from Thursday’s washout, but the broader participation data continued to worsen, and all three major index ETFs remain under short-term pressure while testing key support. That is not yet enough evidence for a neutral stance.
Kristoff - ChartMill
Next to read: Oil at $103, Adobe in Freefall, and a Market That Just Can't Catch a Break