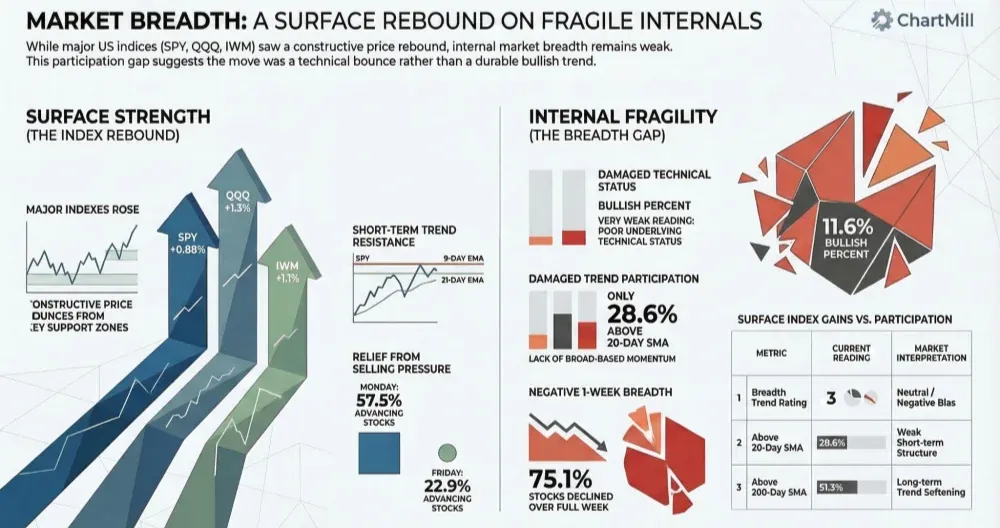
A strong upside day on Monday helped stabilize the tape after Friday’s sharp internal breakdown, but the broader message from market breadth remains cautious. The major indexes bounced from important support zones, yet participation beneath the surface is still too weak to call this a healthy reset or a durable improvement in trend.
Index Overview (SPY, QQQ, IWM)
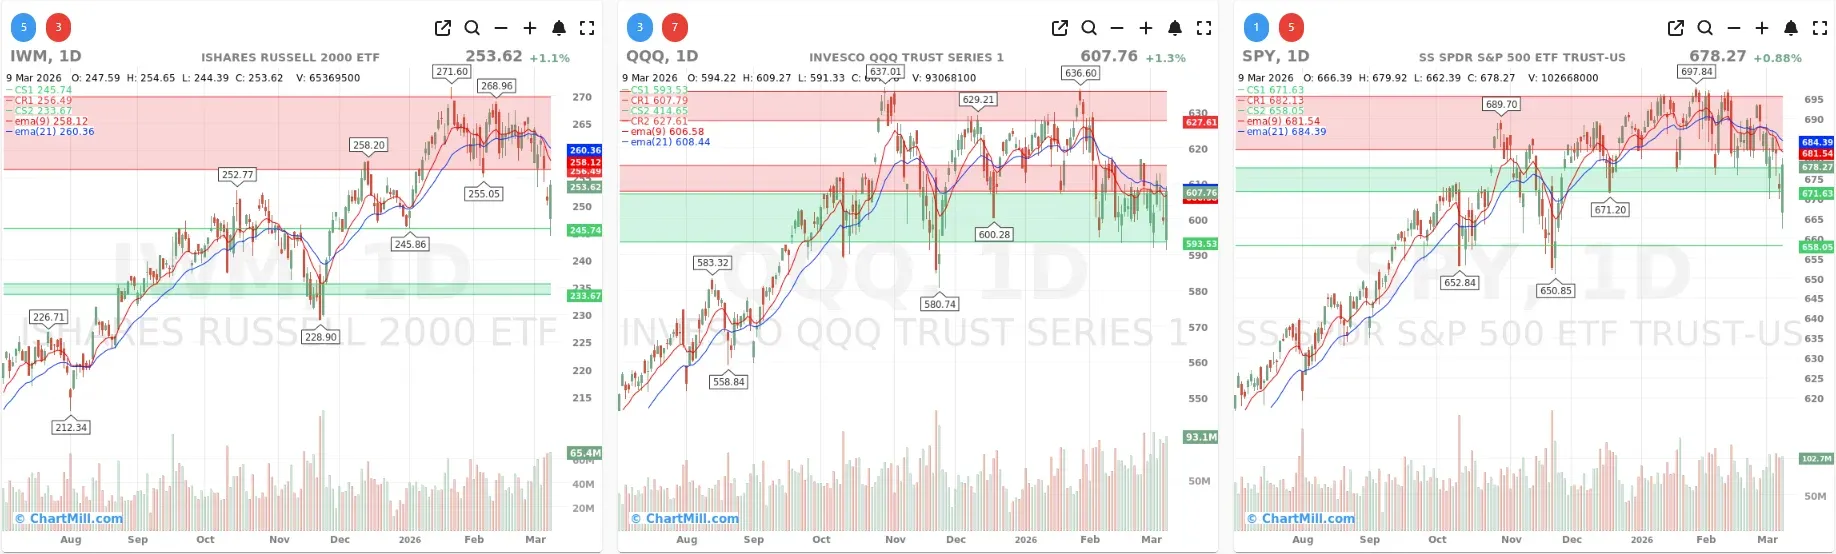
Short Term (Daily)
Long Term (Weekly)
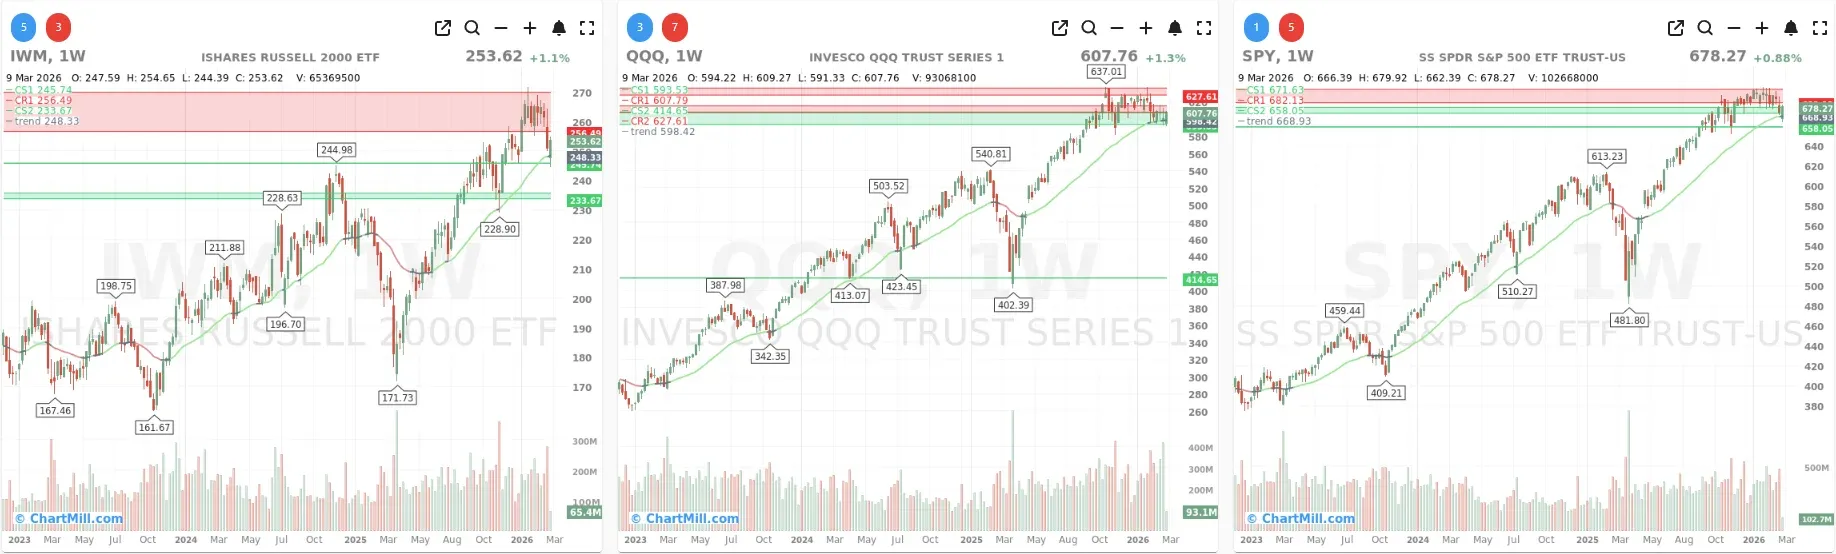
SPY gained 0.88% and bounced from the lower end of its recent support zone. That was constructive, especially after Friday’s weakness, but price still closed below both the 9-day and 21-day EMA, which shows that short-term trend control has not yet shifted back to the bulls. On the weekly chart, SPY remains above its rising 30-week trend line, so the longer-term uptrend is still intact, but momentum has clearly cooled near resistance.
QQQ rose 1.3%, showing a stronger rebound than SPY. The Nasdaq ETF reclaimed ground after recent selling pressure and closed back above its short-term 9-day EMA, but it still sits around a messy congestion area and remains below nearby higher resistance. On the weekly chart, QQQ is still holding above its longer-term trend line, but leadership has narrowed and upside follow-through remains limited.
IWM also rebounded, up 1.1%, but it still looks technically weaker than both SPY and QQQ. Small caps remain below their short-term moving averages on the daily chart, and although the weekly trend is still positive, price action has become much more hesitant. That fits with the broader message from internal data: risk appetite is present in bursts, but it is not yet broad or stable.
Compared with the previous trading day, this is broadly the kind of response the market needed after Friday’s internal washout. But just as importantly, it is also the kind of bounce that still needs confirmation. Friday’s breadth deterioration was too severe to be fully repaired in one session.
Daily Breadth: Clear Improvement, But Not a Breadth Thrust
The headline daily breadth numbers improved sharply:
-
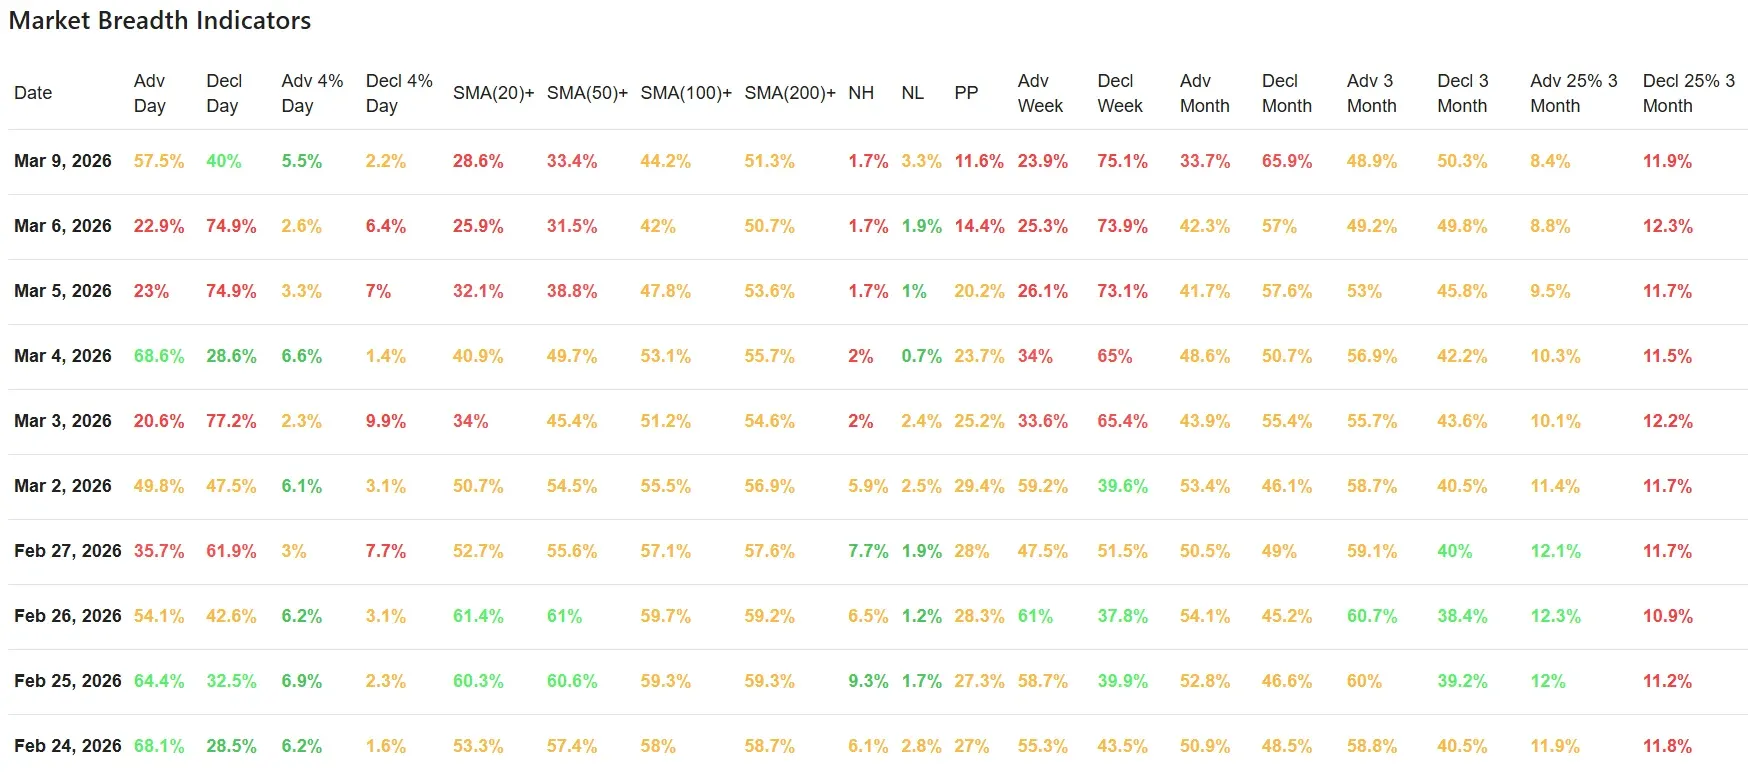
Advancing stocks: 57.5%
-
Declining stocks: 40.0%
That is a meaningful reversal from Friday, when only 22.9% of stocks advanced and 74.9% declined. So yes, Monday brought real buying interest back into the market.
However, the quality of that rebound was only moderate, not overwhelming.
Only 5.5% of stocks gained more than 4% on the day, while 2.2% fell more than 4%. That is better than Friday’s downside skew, but it does not reflect the kind of broad upside expansion typically seen when a market is launching into a powerful new leg higher. In other words, participation improved, but conviction remained limited.
This is an important distinction. Monday’s session helped relieve immediate pressure, but it did not produce the sort of internal surge that would strongly suggest a new bullish impulse is underway.
Trend Participation: Still Weak Across All Time Horizons
This is where the real caution remains.
The percentage of stocks trading above key moving averages is still poor:
-
Above SMA(20): 28.6%
-
Above SMA(50): 33.4%
-
Above SMA(100): 44.2%
-
Above SMA(200): 51.3%
These are weak readings, especially at the short-term end. In practical terms, it means the market may have bounced, but a large majority of stocks are still in damaged short-term technical structures.
Compared with Friday, the deterioration continued in the shortest trend measures:
-
SMA(20)+ fell from 25.9% to 28.6%. Actually that is a small rebound, but still very weak in absolute terms.
-
SMA(50)+ rose slightly from 31.5% to 33.4%
-
SMA(100)+ improved from 42.0% to 44.2%
-
SMA(200)+ edged up from 50.7% to 51.3%
So there was some stabilization, but the bigger message is unchanged: too few stocks are in healthy trends. A market can bounce with these numbers, but it is much harder for it to sustain a durable advance unless these metrics continue to improve meaningfully over the next few sessions.
This is also consistent with the point made in the previous breadth update: weakness had become too widespread to ignore, even if the major indexes were still near important support.
Highs, Lows, and Bullish Percent: Still a Weak Internal Picture
New highs and new lows remain unimpressive:
-
New Highs: 1.7%
-
New Lows: 3.3%
That leaves new lows still ahead of new highs, even on a positive index day. This is not what a strong internal market typically looks like. In healthier conditions, rebound days are usually accompanied by a better expansion in new highs and a sharper contraction in new lows.
The Bullish Percent reading fell further to 11.6%, down from 14.4% on Friday and well below the levels seen earlier in the period. That is a very weak figure and one of the clearest signs that internal trend damage remains significant. Even if prices are trying to stabilize, the underlying technical status of individual stocks is still poor.
This is one of the biggest reasons Monday should be viewed as a bounce first, not yet a genuine internal reset.
Weekly and Monthly Breadth: Damage Still Dominates
The longer-look breadth readings remain decisively negative:
1-Week Breadth
-
Advancing: 23.9%
-
Declining: 75.1%
Despite Monday’s bounce, the 1-week data still shows overwhelming downside pressure. That tells us the market is still climbing out of a hole rather than building from a position of strength.
1-Month Breadth
-
Advancing: 33.7%
-
Declining: 65.9%
That is a very weak monthly backdrop. More importantly, it confirms that recent weakness is not just a one- or two-day event. The market’s internal tone has been deteriorating for some time.
3-Month Breadth
-
Advancing: 48.9%
-
Declining: 50.3%
The 3-month data is closer to neutral, but even here the tone is soft. It suggests the larger structure has not fully broken down, yet it also shows that leadership has thinned considerably.
Stocks Up/Down 25% Over 3 Months
-
Up 25%: 8.4%
-
Down 25%: 11.9%
This remains another subtle but important warning sign. There are still more stocks in deep drawdowns than in powerful uptrends. That is not the profile of a market with strong broad-based momentum.
Context Versus Friday’s Analysis
Monday’s session largely confirms the cautious tone from Friday’s breadth analysis.
On Friday, the key concern was that internal deterioration had become too severe to dismiss as a normal pause. Monday did bring a rebound, and that was necessary. But the broader evidence still says this was only a first step.
What changed:
-
Daily breadth improved materially
-
The major indexes bounced from important support areas
-
Short-term panic eased
What did not change:
-
Short-term participation remains weak
-
Weekly and monthly breadth are still heavily negative
-
New highs remain scarce
-
Bullish Percent continues to deteriorate
So the most important conclusion is this: Monday interrupted the immediate downside pressure, but it did not yet invalidate the broader internal weakness that built up over the previous sessions.
Final Assessment
The market got the bounce it needed, and that prevents the picture from turning outright bearish in the very short term. But under the surface, the damage remains too extensive to call this healthy.
The indexes are still holding their longer-term weekly trends, which matters. But breadth is not yet supporting a more constructive stance. For that to happen, we would need to see stronger follow-through, expanding participation above short-term moving averages, improving Bullish Percent readings, and a better new highs/new lows profile.
For now, this looks like a technical rebound inside a still-fragile internal environment.
Breadth Trend Rating
3 — Neutral / Negative Bias
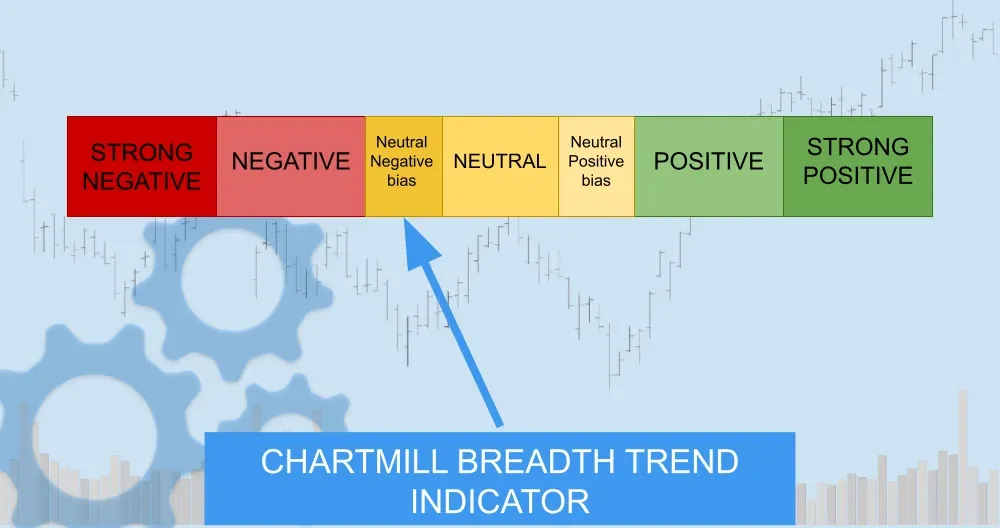
That is unchanged to only marginally improved from the previous session. Monday helped stabilize conditions, but not enough to reverse the underlying message of weakening participation and ongoing internal damage.
Kristoff - ChartMill
Next to read: From Red to Green: How Trump's Iran Endgame Sparked a Wall Street Comeback