Tuesday’s breadth data shows that Monday’s improvement did not develop into a broader recovery. While the major indexes remain relatively close to key support zones on the weekly charts, internal participation is still weak, especially on a one-week and one-month basis. The market is not in full washout mode, but the underlying data continues to argue for caution rather than renewed confidence.
Index Overview (SPY, QQQ, IWM)
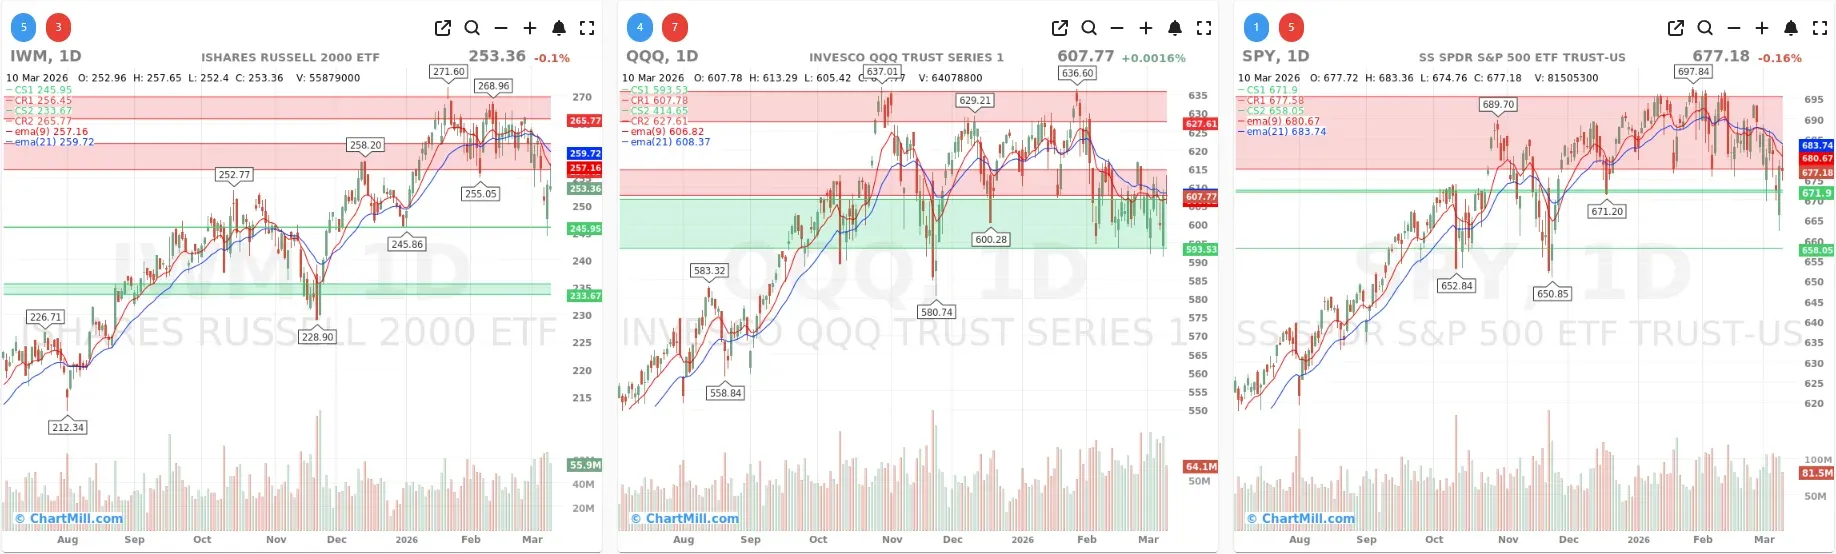
Short Term (Daily)
Long Term (Weekly)
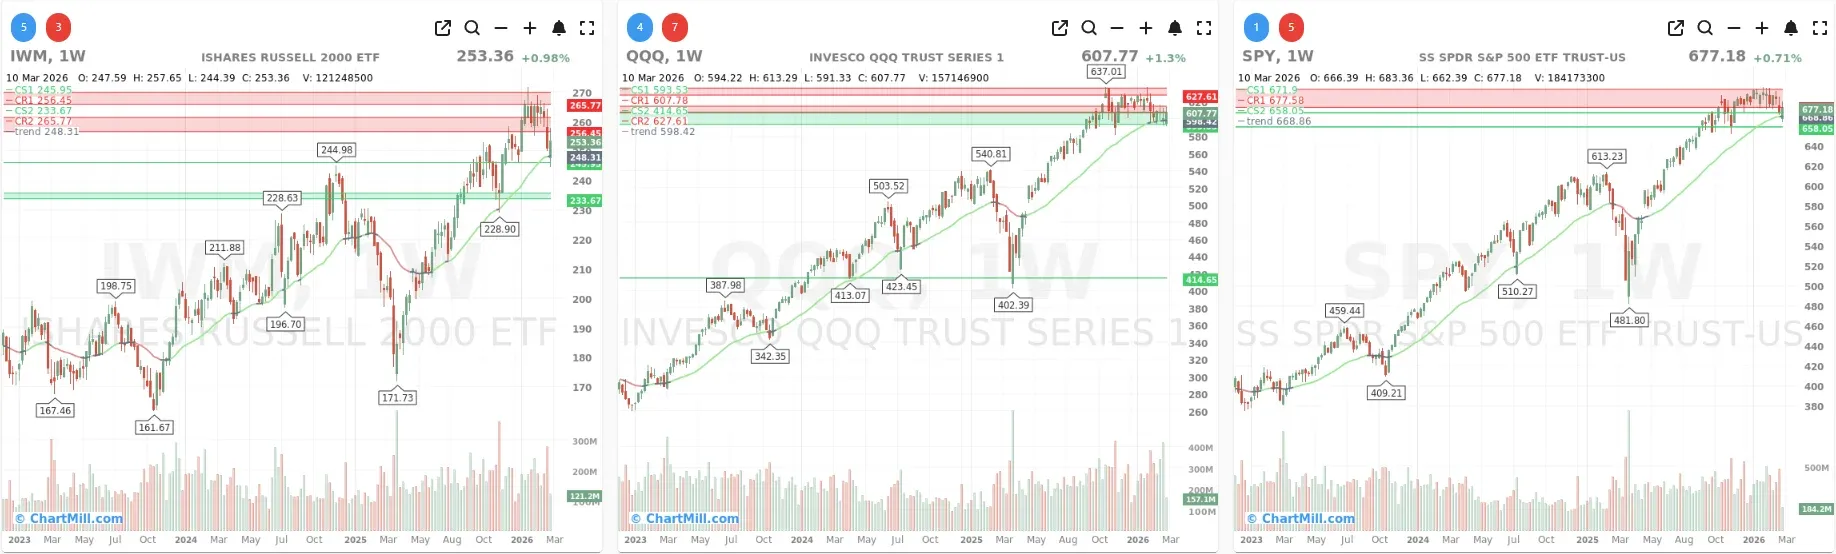
SPY finished at 677.18 and continues to hold above an important support area around 671-672, with lower support near 658. On the daily chart, however, price remains below both the EMA9 and EMA21, which keeps the short-term structure under pressure. The weekly chart is still constructive in the bigger picture, but momentum has clearly slowed and the ETF is no longer acting with the same confidence it showed earlier in the advance.
QQQ closed at 607.77 and is sitting right near an important pivot area. On the daily chart, it is moving sideways to slightly lower and is caught between support around 593.5 and overhead resistance around the low 610s into the upper 620s. The short-term structure is fragile, with the EMA9 below the EMA21. On the weekly chart, the longer-term trend is still intact, but leadership is not expanding enough beneath the surface to make that trend feel comfortable.
IWM closed at 253.36 and remains the weakest-looking of the three on the daily chart. It did bounce off support near 246, but it is still trading below both short-term moving averages and below nearby resistance around 256.5. The weekly chart remains better than the daily one suggests, with price still above the long-term trend line near 248, but small caps are not yet showing the kind of follow-through that would signal a real risk-on revival.
Breadth Analysis
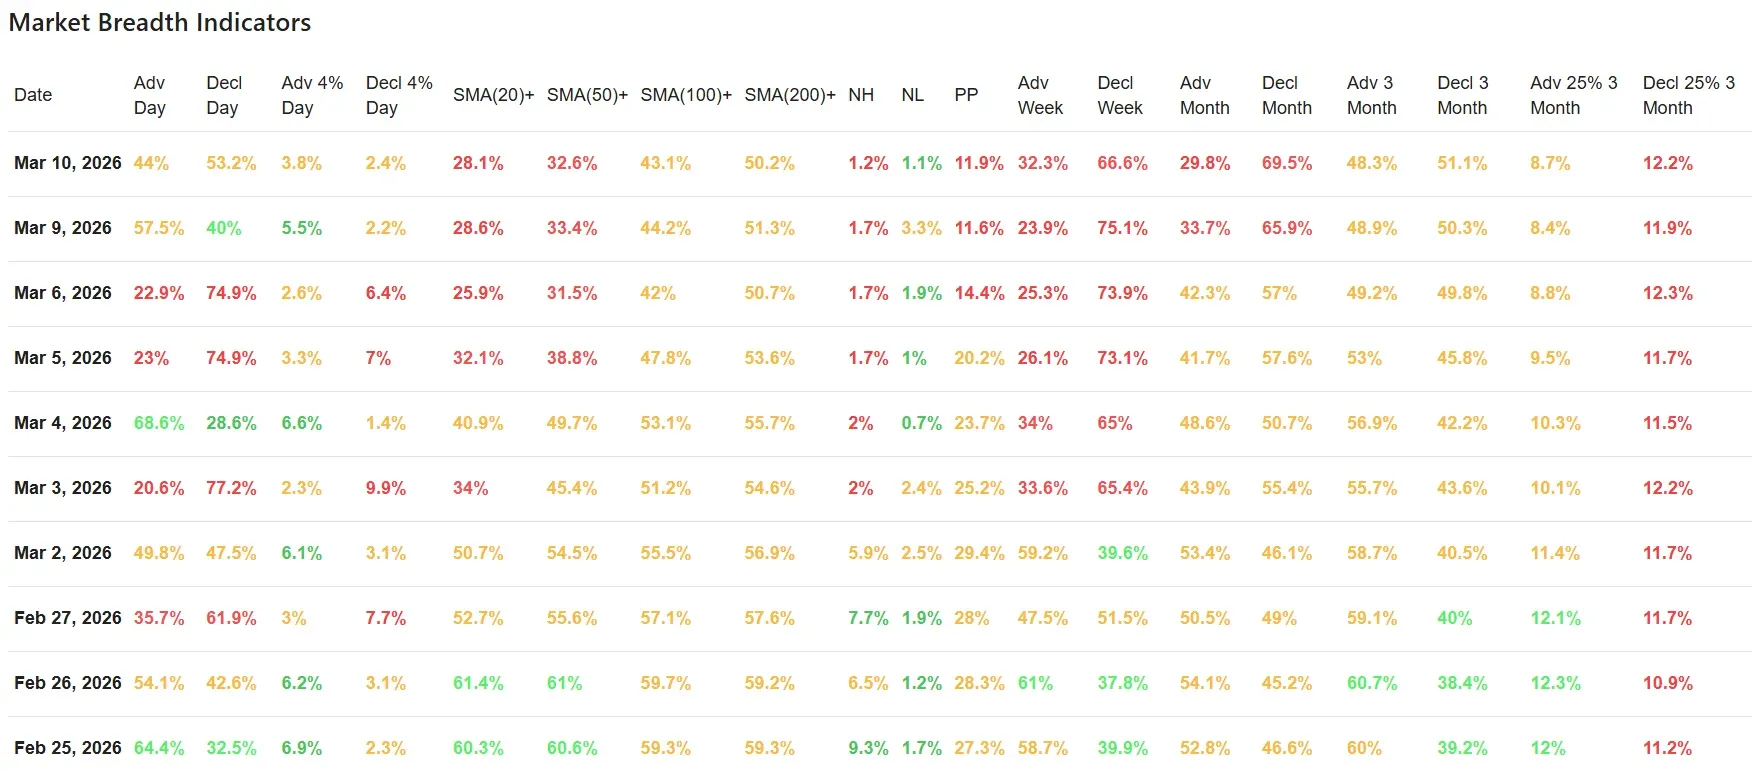
Monday’s breadth data hinted at a possible stabilization, but Tuesday’s numbers show that improvement was not strong enough to shift the overall tone. Daily advancing issues fell back to 44%, while declining issues rose to 53.2%. That is not an outright panic reading, but it is another reminder that sellers still have the upper hand.
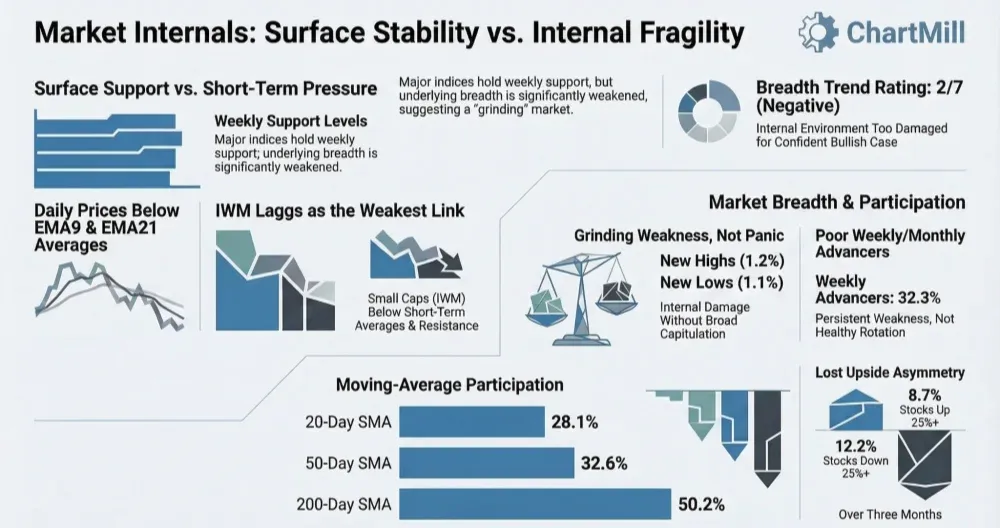
What stands out most is the continued weakness in the moving-average participation data.
Only 28.1% of stocks are above their 20-day SMA, 32.6% are above the 50-day SMA, and just 43.1% remain above the 100-day SMA. Even the 200-day figure, at 50.2%, is now barely holding above the halfway mark.
It tells us that the market has moved beyond a simple short-term wobble. Weakness is broad enough to damage the intermediate structure, while the longer-term backdrop is also beginning to lose some of its cushion.
This fits well with what we saw in the previous breadth update. Monday’s stronger daily breadth reading looked more like a temporary rebound inside a still-damaged internal environment than the start of a real repair process. Tuesday’s data confirms that view. The one-day bounce did not produce any meaningful follow-through in the broader list of stocks.
The weekly and monthly breadth data remain especially poor. Weekly advancers came in at just 32.3% versus 66.6% decliners. On a one-month basis, advancers were only 29.8%, while decliners climbed to 69.5%. Those are not the kinds of numbers you see in a healthy market rotation. They suggest that weakness is persistent and widespread, even if the major indexes themselves are not collapsing.
There are a few small signs that conditions are not yet extreme enough to call this a full-blown breadth washout. New highs and new lows were nearly balanced at 1.2% versus 1.1%. That tells us internal damage is real, but not accelerating into broad capitulation. Likewise, the 4% movers were modest on both sides, with 3.8% advancing more than 4% and 2.4% declining more than 4%.
In other words, this is more of a grinding, internally weak market than a market in outright panic.
That distinction matters. A panic phase often creates the kind of extreme oversold conditions that can fuel a stronger rebound. What we have now is less dramatic, but also less constructive: the indexes are still relatively elevated on the weekly charts, while breadth underneath remains soft. That combination often leads to choppy, frustrating price action rather than a clean directional move.
The three-month figures also show a market that has lost upside asymmetry. Advancers and decliners over the past three months are nearly balanced at 48.3% versus 51.1%, but the more telling metric is the 25% move data. Only 8.7% of stocks are up 25% or more over the last three months, while 12.2% are down 25% or more.
That is not what strong leadership looks like. Big upside winners are scarce, while larger downside damage is becoming more common.
What the Data Is Saying
The message from the internals remains fairly clear: headline index stability is masking weak participation.
SPY and QQQ are still near important levels on their weekly charts, and IWM is trying to defend long-term support, but the broader market is not yet confirming a durable recovery attempt.
That was also the key risk highlighted after Monday’s session: a better one-day reading was not enough on its own, because the short-term and medium-term participation data remained deeply damaged. Tuesday’s session reinforced that concern. Instead of follow-through, breadth slipped back into negative territory and the weak one-week and one-month trends stayed firmly in place.
From a sentiment perspective, this looks like a market that is still hesitant, selective, and unwilling to broaden out. There may be stock-specific opportunities, but the raw breadth numbers do not yet support a strong risk-on interpretation.
In that sense, the market continues to behave like a rallying index environment sitting on top of a much less convincing internal foundation.
Breadth Trend Rating
2/7 – Negative
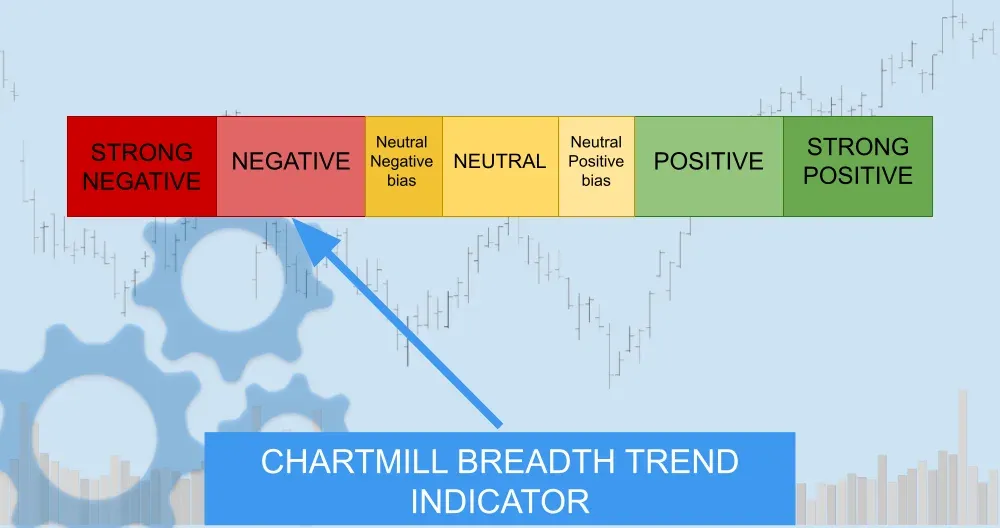
The overall breadth trend remains negative. There is not enough internal strength to support a durable bullish case at this stage, even though the longer-term weekly trends for the major index ETFs have not fully broken down.
Conclusion
Tuesday’s breadth data keeps the market in a fragile position. The major index ETFs are still holding key longer-term levels, but short-term trend damage remains visible on the daily charts, and the breadth metrics continue to deteriorate beneath the surface.
The biggest takeaway is that Monday’s improvement has not changed the broader picture. Internal participation is still too weak, too narrow, and too inconsistent to support a confident bullish stance. Until the percentages above key moving averages begin to improve and weekly breadth starts to recover, the path of least resistance remains one of caution.
In practical terms, this is still a market where the indexes may appear more stable than the average stock actually is. That gap between surface action and underlying breadth remains the defining feature of the current environment.
Kristoff - ChartMill
Next to read: Oracle Steals the Spotlight as Oil Drama and Mixed Earnings Shake Up Wall Street