Monday brought a modest recovery with IWM clearly outperforming, while SPY and QQQ stayed stuck in their broader consolidation zones. Under the hood, daily breadth flipped back toward balance, and weekly breadth improved, but the “core” participation metrics (stocks above key moving averages, new highs vs. new lows) still look more sideways than trending.
Index overview (SPY, QQQ, IWM)
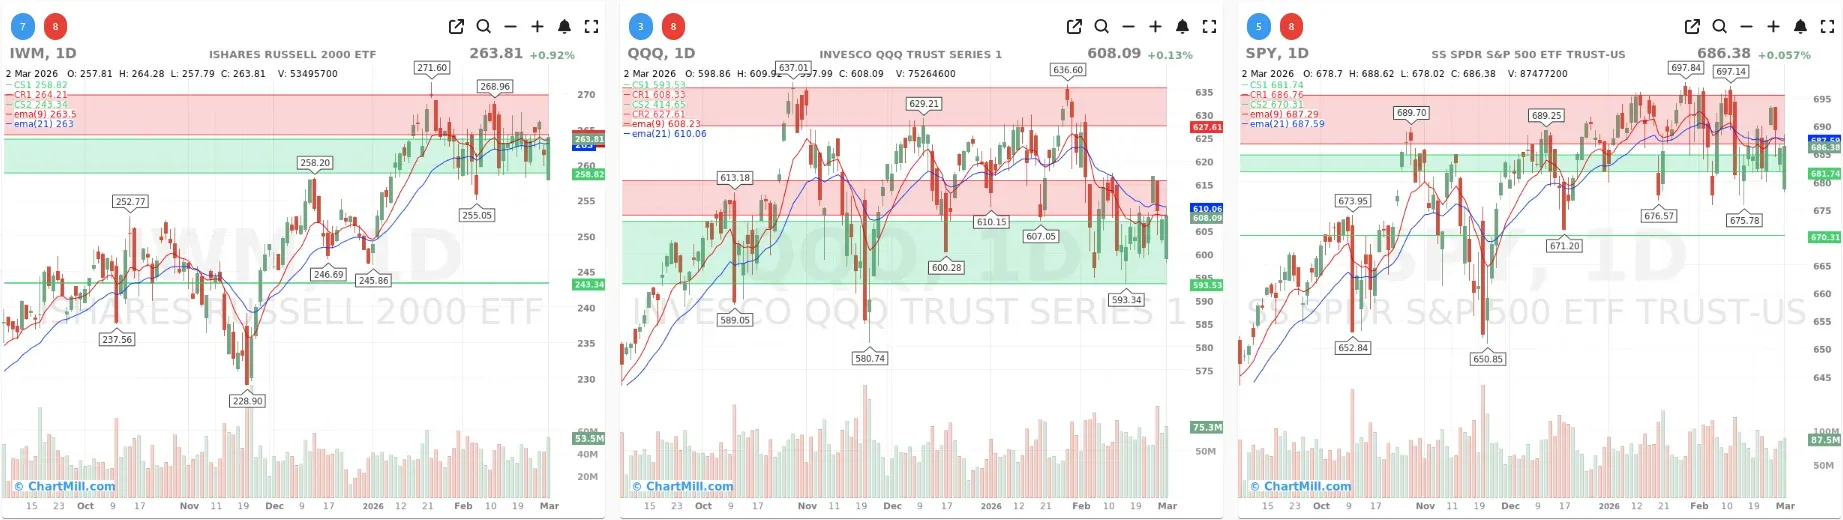
Short Term (Daily)
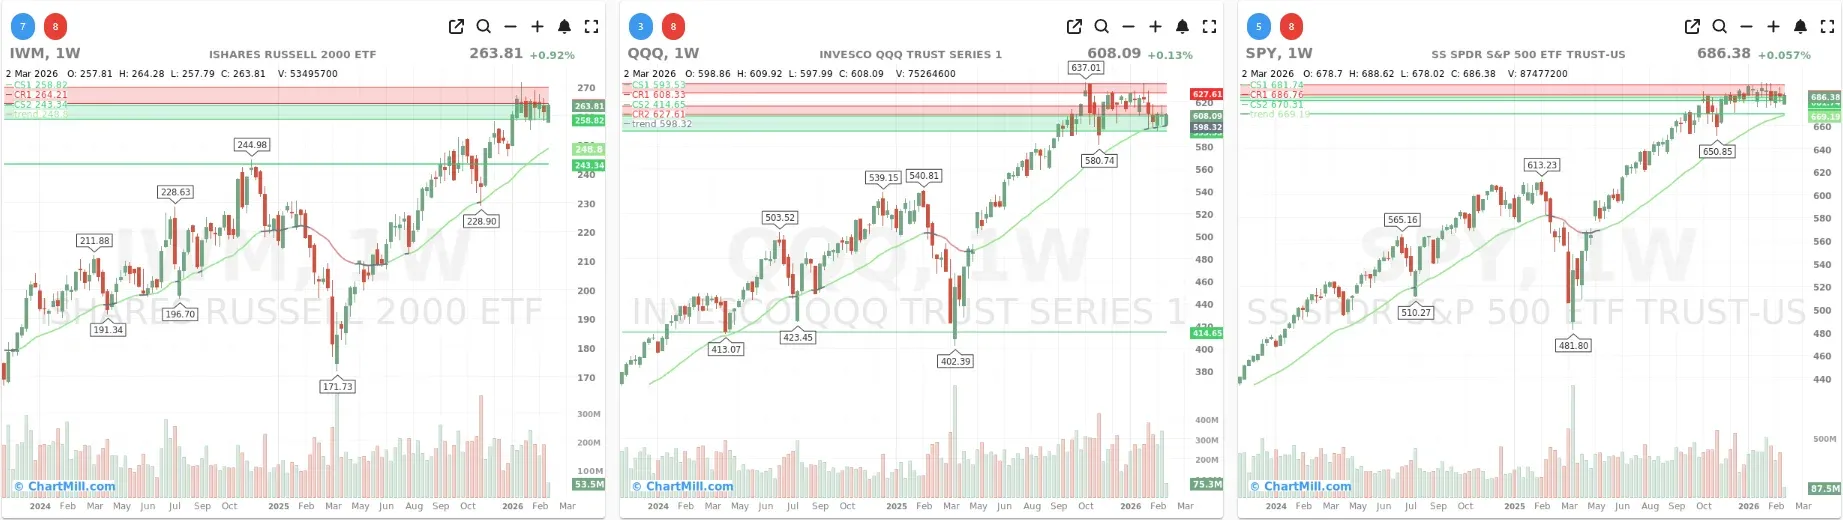
Long Term (Weekly)
SPY
Price action: Essentially flat on the day, continuing to chop sideways near the top of the range.
Daily (EMA9/EMA21): Price is hovering around the short-term averages, with no clean expansion move, more “grind” than trend.
Weekly (Trend Indicator / 30W EMA): The long-term trend still looks constructive, but the current tape reads as consolidation near highs, not acceleration.
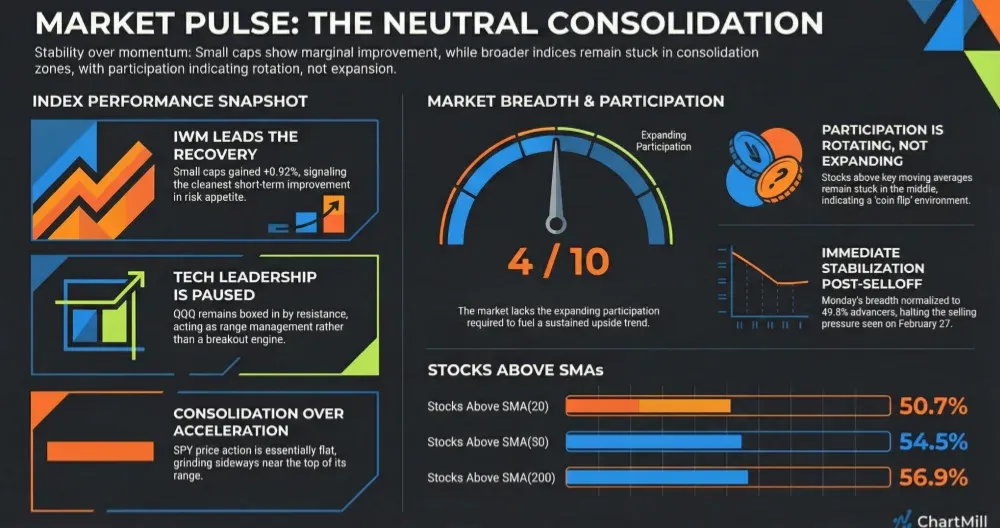
Interpretation: The market’s “core” is holding up, but it’s not pulling breadth higher with urgency—more stability than momentum.
QQQ
Price action: Slightly positive, but still boxed in by prior resistance (the red supply zone overhead).
Daily (EMA9/EMA21): Short-term trend remains fragile/neutral, bounces happen, but follow-through is limited.
Weekly: Still in a healthy longer-term structure, yet clearly digesting under the prior peak zone.
Interpretation: Tech is stabilizing, but it’s not acting like a leadership engine right now—more “range management” than breakout pressure.
IWM
Price action: Best of the three (+0.92%), pushing back up into the upper area of its recent range.
Daily (EMA9/EMA21): This is the cleanest short-term improvement: IWM is back above/through key short-term levels, showing better responsiveness from risk appetite.
Weekly: Long-term picture remains supportive, with price holding up well after the prior advance.
Interpretation: The day’s message was simple: risk appetite improved at the margin, and that showed up most in small caps.
Market breadth (10-day view)

1) Daily participation improved sharply (but not convincingly bullish)
-
Advancing vs. declining: 49.8% adv / 47.5% decl (back to balanced) vs 35.7% adv / 61.9% decl on Feb 27 (risk-off day).
-
Big movers: 6.1% up >4% vs 3.1% down >4% — a healthier skew than Friday (when downside outsized upside: 3.0% vs 7.7%).
Read-through: The selling pressure from Feb 27 didn’t continue. Monday looked like a reset/rebound day, not a breakdown.
2) “Stocks above moving averages” remains stuck in the middle
-
Above SMA(20): 50.7% (basically a coin flip)
-
Above SMA(50): 54.5%
-
Above SMA(100): 55.5%
-
Above SMA(200): 56.9%
Compared to Feb 27, these readings are not improving (they’re slightly lower), which matters: even when the tape bounces, the market is still telling us participation is not expanding, it’s rotating.
3) New highs cooled, new lows ticked up
-
New highs: 5.9% (down from 7.7% on Feb 27)
-
New lows: 2.5% (up from 1.9%)
Read-through: This is a classic consolidation signature: the market can bounce, but leadership is not broadening, and there’s still a non-trivial pocket of breakdowns.
4) Weekly breadth improved, monthly stays mildly positive
-
Advancing week: 59.2% vs 47.5% on Feb 27
-
Declining week: 39.6% vs 51.5%
Monthly and 3-month numbers remain moderately constructive:
-
Adv month: 53.4% (still >50)
-
Adv 3 months: 58.7%
Read-through: The bigger picture hasn’t rolled over, but the market is not in a clean breadth uptrend either. It’s holding a mild positive baseline while price digests.
What changed versus the previous breadth read (Feb 27)
-
Feb 27 looked like a risk-off push (decliners dominated and large down days were elevated).
-
Mar 2 shows immediate stabilization: daily breadth normalized and weekly breadth improved, with IWM acting as the tell.
However, the core participation gauges (above SMAs + NH/NL) did not confirm a new bullish leg, this still looks like a range environment where leadership rotates and breakouts need to prove themselves.
Breadth trend rating
Rating: 4 — Neutral
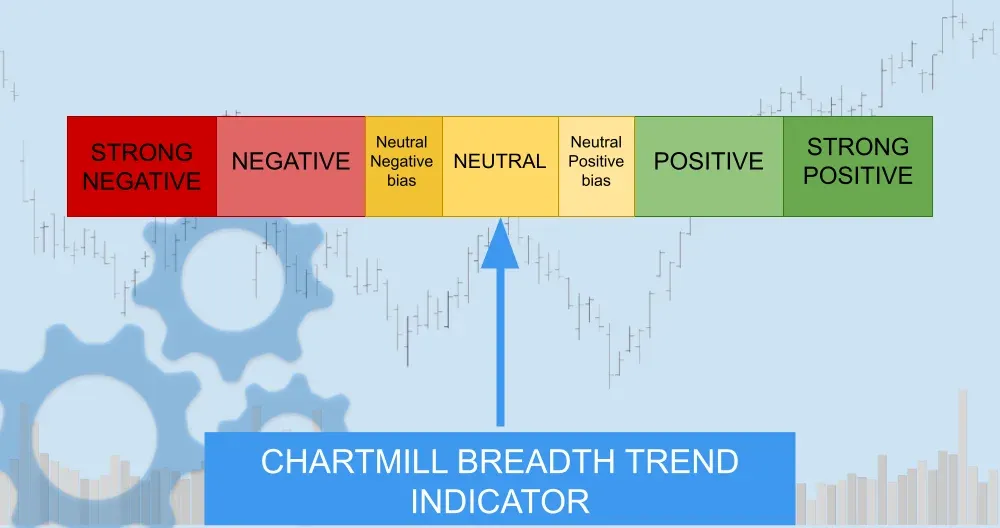
Why: The short-term damage from Feb 27 was not followed through, and weekly breadth improved, but the market still lacks the “breadth thrust” profile (expanding SMA participation + rising new highs with suppressed new lows) that typically fuels sustained upside trends. For now, this remains neutral consolidation with selective risk-on bursts (notably in small caps).
Kristoff - ChartMill
Next to read: Iran, Dip-Buyers & a Rare Buffett Stumble: Wall Street Shakes Off Its Worst Fears