Monday’s market breadth data improved dramatically after Friday’s weak close, with nearly 73% of stocks advancing on the day and downside pressure easing across several short-term metrics. Still, the bigger picture remains fragile: participation above key moving averages is low, weekly and monthly breadth are still heavily skewed to the downside, and all three major index ETFs remain below their short-term daily trend lines.
Index Overview (SPY, QQQ, IWM)
Short Term (Daily)
Long Term (Weekly)
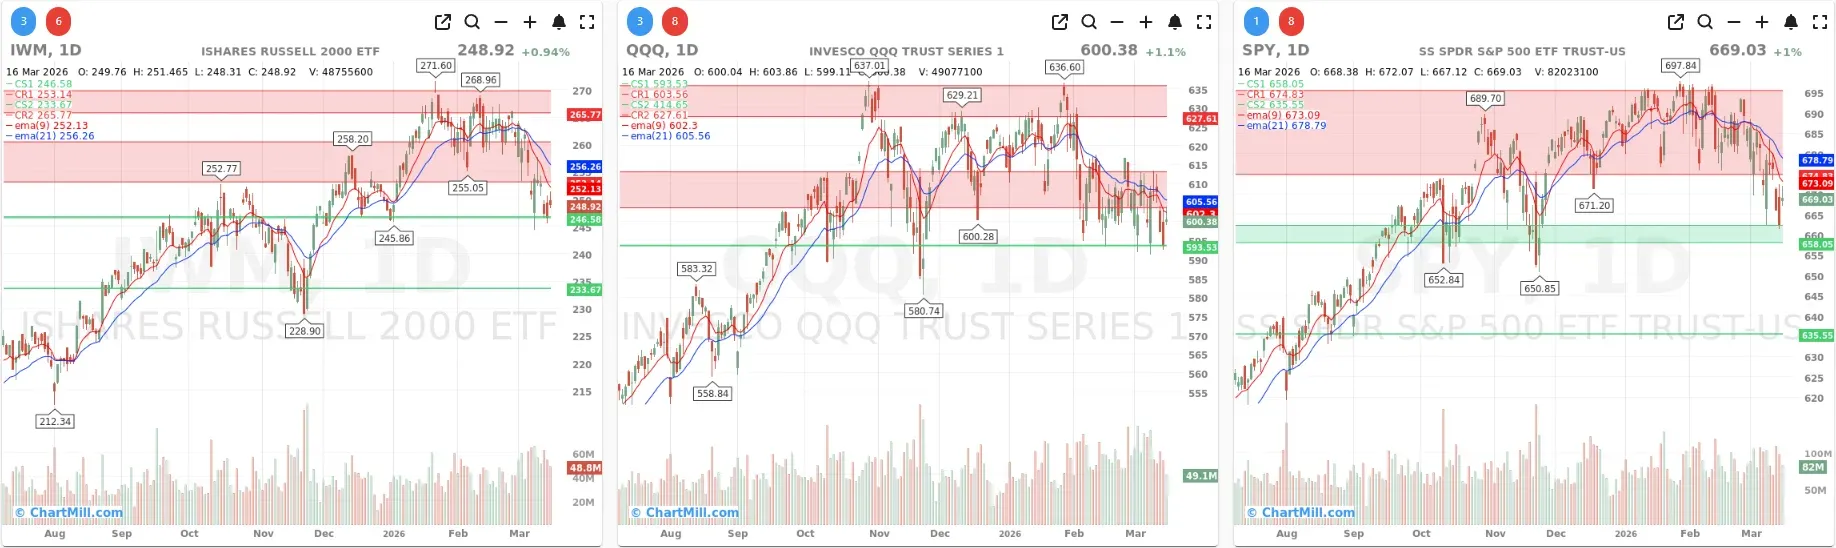
SPY bounced 1.0% and closed at $669.03. On the daily chart, that recovery pushed price back above the nearby green support zone around 658, but it still remains below both the 9-day EMA (673.09) and the 21-day EMA (678.79). That keeps the short-term trend under pressure despite the bounce. The index is trying to stabilize after a pullback, but it has not yet reclaimed short-term control.
On the weekly chart, the longer-term structure is still much healthier. SPY remains above its green 30-week trend line and above the longer-term support area. So while the daily chart shows corrective behavior, the weekly chart still points to a positive long-term trend that has not yet broken down.
QQQ also rebounded, gaining 1.1% to close at $600.38. On the daily chart, it is still below the 9-day EMA (602.30) and the 21-day EMA (605.56), which means the short-term trend remains weak even after Monday’s lift. The close near 600 is constructive because it keeps QQQ above its immediate support band, but buyers still need to regain the moving averages to improve the near-term picture.
On the weekly chart, QQQ continues to hold above its 30-week trend line. That keeps the longer-term uptrend intact, although momentum has clearly cooled. In other words, this still looks more like a pressured pullback within a broader uptrend than a confirmed long-term breakdown.
IWM was the weakest structurally coming into the session, but it also managed a rebound, closing up 0.4% at $248.92. On the daily chart, the situation remains fragile. Price is still below the 9-day EMA (252.13) and the 21-day EMA (256.26), and unlike SPY and QQQ, IWM continues to show less technical resilience. Monday’s bounce came near an important support area, so it matters, but it does not yet change the broader short-term weakness.
On the weekly chart, IWM is still just above its 30-week trend line, but only narrowly. That makes it the most vulnerable of the three major index ETFs. The long-term trend has not turned negative, but small caps are clearly not leading this market.
Breadth analysis: a strong one-day rebound
The biggest change in Monday’s report was the sharp improvement in daily breadth.
-
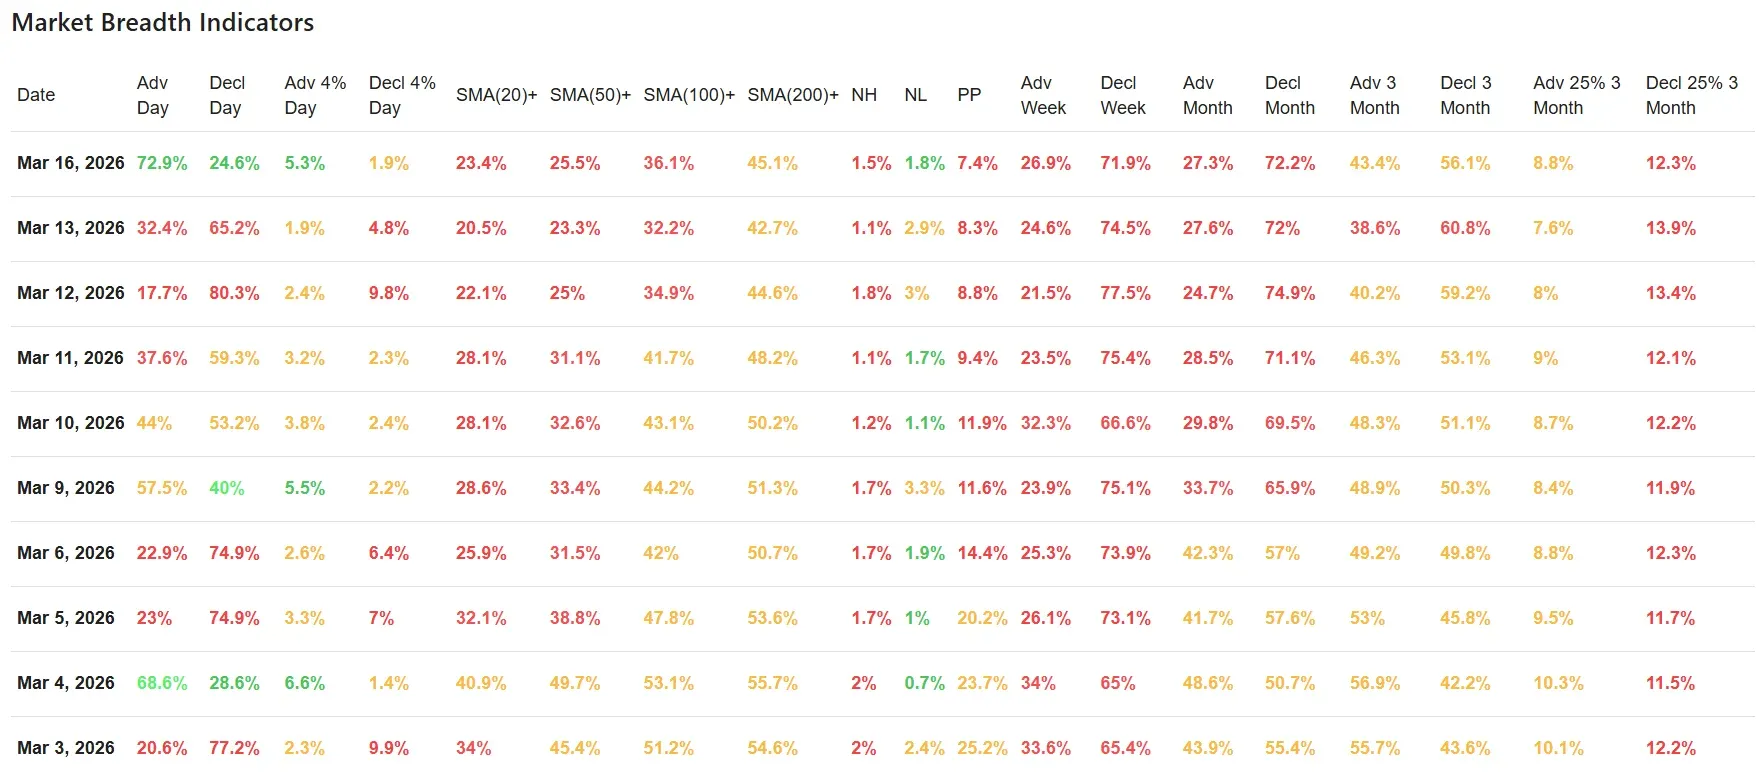
Advancing stocks jumped to 72.9%, up from 32.4% on Friday.
-
Declining stocks fell to 24.6%, down from 65.2%.
-
Stocks gaining more than 4% rose to 5.3%, while those losing more than 4% dropped to 1.9%.
That is a clear reversal in one-day participation. Friday’s data showed a market still leaning heavily toward sellers. Monday instead showed broad buying interest and a much better balance between winners and losers. This kind of one-day thrust often reflects a relief rally, short-covering, or a response to an oversold short-term condition.
Just as important, the new highs/new lows picture also improved modestly:
-
New highs: 1.5%
-
New lows: 1.8%
That is still not strong, but it is healthier than Friday’s 1.1% new highs versus 2.9% new lows. The market is not yet producing strong leadership, but the immediate deterioration in internal weakness did slow down.
Beneath the surface: trend participation is still weak
The rebound looks good on the surface, but the broader participation data still says this market has work to do.
On Monday:
-
23.4% of stocks were above their 20-day SMA
-
25.5% were above their 50-day SMA
-
36.1% were above their 100-day SMA
-
45.1% were above their 200-day SMA
These numbers did improve from Friday, but they remain weak in absolute terms. The most telling point is that fewer than half of stocks are above their 200-day moving average. That suggests the market’s internal structure has already taken meaningful damage, even if the major indexes themselves have not fully reflected that on the weekly charts.
This is exactly the kind of environment where index-level price action can look more stable than the broader stock universe underneath it. The rebound is real, but the participation base is still narrow compared with healthier market conditions.
Weekly and monthly breadth remain negative
This is where the caution remains most justified.
Weekly breadth
-
Advancing stocks (1 week): 26.9%
-
Declining stocks (1 week): 71.9%
That is still decisively negative. Even though Monday improved the daily picture, the one-week internal trend continues to show heavy downside dominance.
Monthly breadth
-
Advancing stocks (1 month): 27.3%
-
Declining stocks (1 month): 72.2%
This remains one of the clearest signs that the broader market is still under pressure. A single good day does not undo a month of weak participation. The same message shows up in the 3-month data as well:
-
Advancing stocks (3 months): 43.4%
-
Declining stocks (3 months): 56.1%
That improved slightly, but still points to a market where losers continue to outnumber winners over the intermediate term.
Compared with Friday: better breadth, same larger message
Relative to the previous breadth report, Monday delivered the kind of session the market needed. Friday’s article pointed to deteriorating participation, weak short-term structure, and limited internal support. Monday confirmed that the market was oversold enough to generate a strong rebound.
But what did not change is just as important:
-
the major ETFs are still below their short-term daily moving averages,
-
trend participation remains poor,
-
weekly and monthly breadth are still clearly negative,
-
and small caps remain the weakest link.
So the market did improve, but it did not yet repair the underlying technical damage. The best way to frame Monday is as a broad relief rebound inside a still-fragile market structure.
Human context
This kind of session often appears when bearish sentiment becomes stretched in the short run and buyers step in aggressively after several weak sessions. That can produce impressive one-day breadth numbers, but unless it is followed by continued improvement in participation and stronger closes back above key daily moving averages, it often remains just a rebound rather than the start of a durable internal reset.
Right now, the market still needs follow-through.
Conclusion
Monday’s breadth report was clearly better than Friday’s. The daily numbers were strong, downside pressure eased, and internal selling cooled meaningfully. That is a welcome change and a sign that the market still has responsive buyers.
The broader internal trend remains weak. Participation above key moving averages is still low, weekly and monthly breadth remain decisively negative, and the major index ETFs have not yet reclaimed their short-term daily trend structure.
The long-term weekly uptrends are still intact, especially for SPY and QQQ, but the shorter-term market environment remains fragile.
Breadth trend rating: 3/7 — neutral with a negative bias
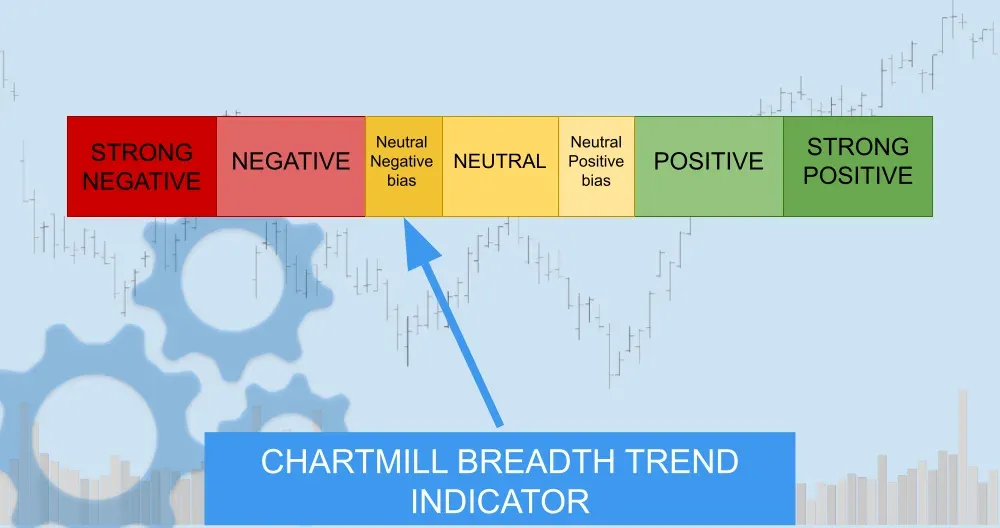
That rating reflects a meaningful one-day improvement, but not enough evidence yet to say the broader breadth trend has truly turned. Monday was encouraging. What matters next is whether the market can build on it.
ChartMill Market Desk
This daily update is prepared by ChartMill for informational purposes only and does not constitute investment advice. Always do your own due diligence before making investment decisions.
Next to read: