U.S. equities extended Monday’s rebound on Tuesday, with strong daily advancing breadth and modest improvement in several internal metrics. Still, the broader picture remains fragile: participation above key moving averages is low, weekly and monthly breadth remain decisively negative, and the rebound has not yet repaired the internal damage created earlier this month.
Index Overview (SPY, QQQ, IWM)
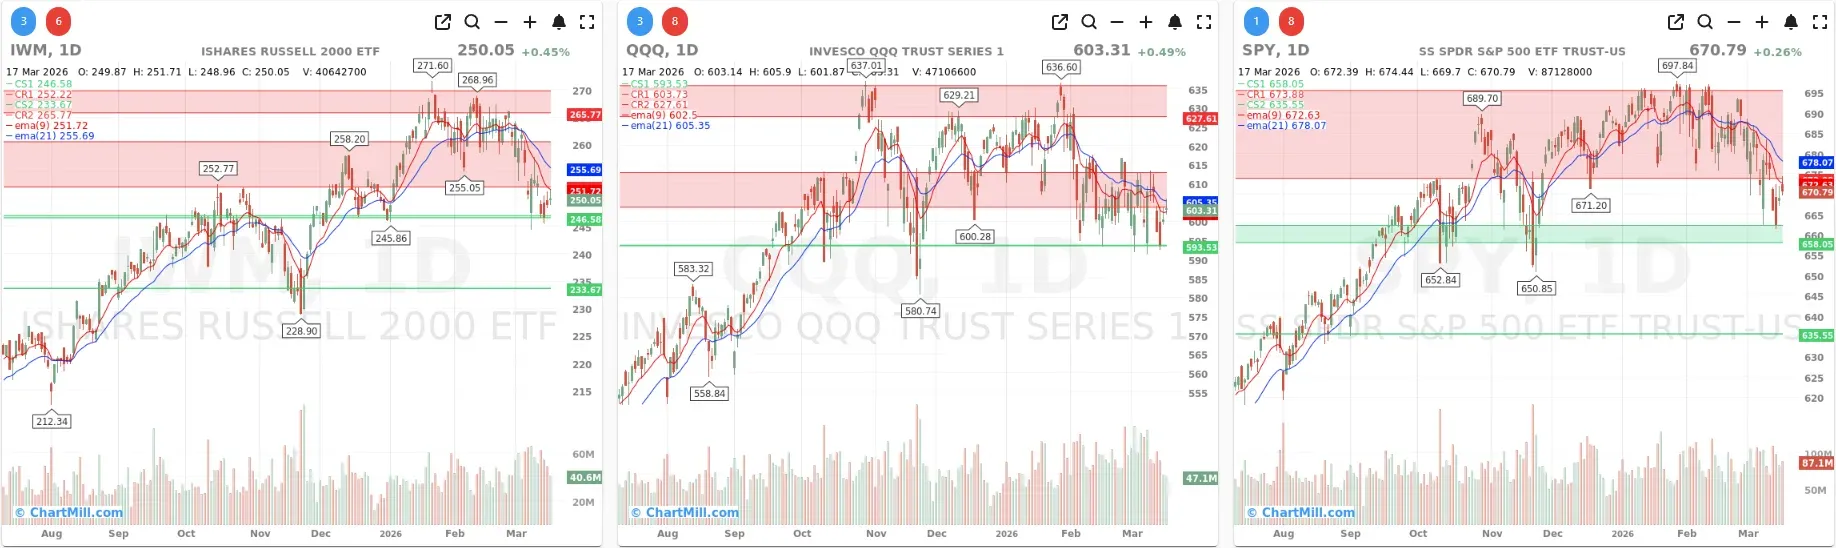
Short Term (Daily)
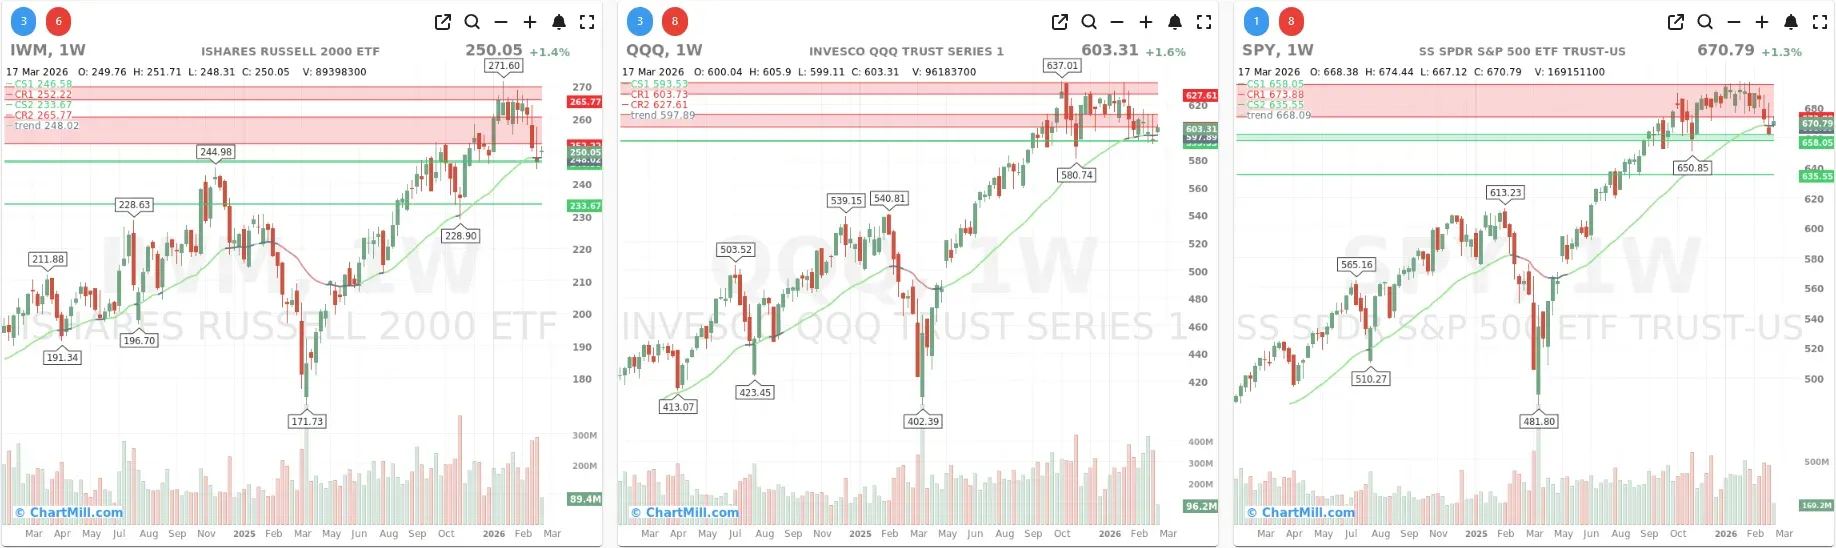
Long Term (Weekly)
Tuesday delivered a constructive follow-through session on the surface. SPY, QQQ and IWM all closed higher again, extending the bounce that started on Monday. That continuation matters, because after the weak breadth readings seen late last week, the market needed more than a one-day reaction to suggest that sellers were losing at least some short-term control.
SPY remains the steadiest of the three major ETFs. On the weekly chart, the long-term trend is still positive, price remains above the 30-week trend line, and the ETF is holding above the green support zone around the $658 area. At the same time, the daily chart still shows some short-term technical damage. SPY closed below both the 9-day and 21-day EMA, so while the index is bouncing, it has not yet fully regained short-term upside control.
QQQ also rebounded, and its position is slightly more constructive on the daily timeframe than SPY’s. Price managed to reclaim the 9-day EMA, but it still sits below the 21-day EMA and well below the overhead resistance zone in the $627 area. On the weekly chart, the longer-term uptrend is still intact, but the ETF is clearly in a corrective phase within that broader trend. In other words, the long-term structure has not broken, but momentum has cooled materially.
IWM remains the weakest of the three from a short-term technical perspective, even though it also bounced. The daily chart still shows price below both short-term averages, and unlike SPY and QQQ, the Russell 2000 has less room for error because its recent pullback was sharper and more disorderly. The weekly chart is still constructive enough to avoid a bearish long-term conclusion, but this remains the most fragile of the three major index ETFs.
So the broad index message is fairly clear: the market is trying to stabilize, but it is doing so from a position of internal weakness. SPY is acting like the most resilient index, QQQ is attempting to improve, and IWM still needs more proof.
Daily breadth: clearly better, and importantly, for a second day
The strongest part of Tuesday’s report is the daily breadth.
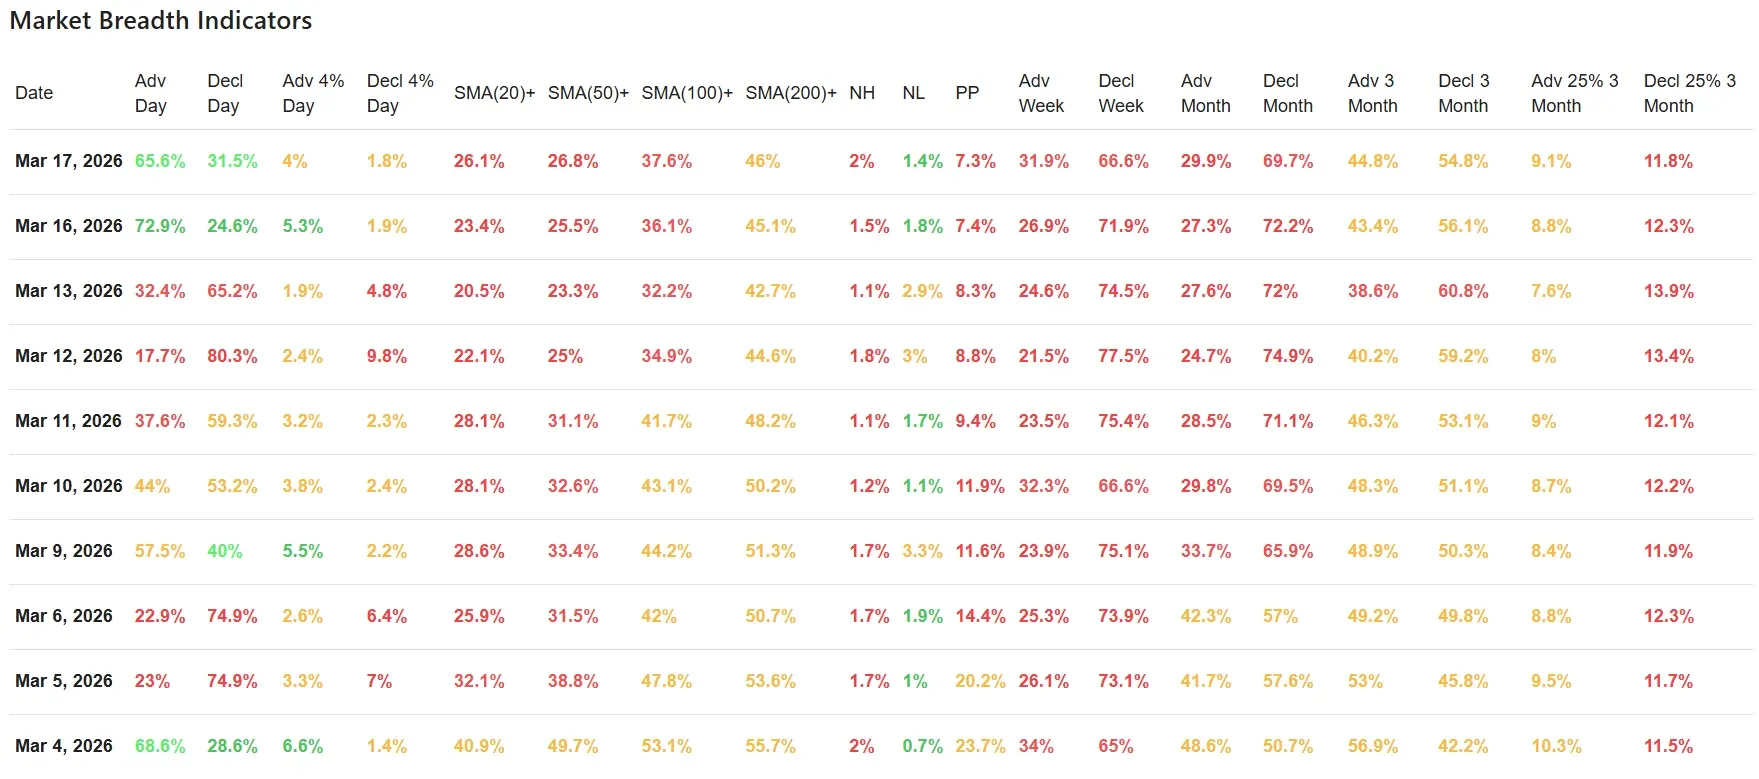
Advancers came in at 65.6%, versus 31.5% decliners, after Monday had already printed a strong 72.9% advancers versus 24.6% decliners. That gives the market two consecutive sessions of positive participation after the ugly washout readings from Thursday and Friday.
That is meaningful, because Monday’s rebound could still have been dismissed as a reflex bounce after oversold conditions. Tuesday makes that interpretation less convincing. A second strong breadth day suggests that buyers did not immediately disappear and that some short-term repair is underway.
At the same time, the character of the advance was solid rather than explosive. Stocks advancing by more than 4% came in at 4.0%, down from 5.3% on Monday, while stocks declining more than 4% held at a contained 1.8%. So the move was broad enough to be constructive, but it still lacked the kind of upside thrust that typically marks a major momentum reset.
That fits the price charts. The market is bouncing, but it is not yet surging through resistance.
Moving-average participation: improving, but still weak
This is where the rebound still runs into a reality check.
The percentage of stocks above their key moving averages improved again on Tuesday:
-
Above SMA(20): 26.1% vs 23.4% Monday
-
Above SMA(50): 26.8% vs 25.5%
-
Above SMA(100): 37.6% vs 36.1%
-
Above SMA(200): 46.0% vs 45.1%
So yes, internals are getting better. But the absolute levels still matter more than the day-to-day uptick.
Only about one quarter of stocks are back above their 20-day and 50-day averages. That is still a weak short- to medium-term participation profile. Even the longer-term reading is not impressive, with less than half of stocks above their 200-day average. That tells us the rebound is real, but the internal repair job is still in its early stages.
This is also where Tuesday largely confirms what Monday hinted at. Monday suggested the market may have reached a short-term washout point. Tuesday supports that view. But it also shows that a washout low and a healthy market are not the same thing. The market may be stabilizing, yet breadth has not recovered enough to call the structure strong again.
Highs, lows and participation pressure
New highs and new lows also moved in a better direction.
New highs rose to 2.0% from 1.5%, while new lows eased to 1.4% from 1.8%. That is constructive, especially after the more stressed readings seen last week. But once again, the message is modest improvement, not full recovery.
Pocket Pivot's (PP) reading slipped to 7.3% from 7.4%. That is still low, and low PP readings usually reflect a market where real upside sponsorship remains limited. So although the tape improved, it did not suddenly become aggressive.
In plain terms: fewer stocks are breaking down, but not many are truly breaking out either.
Weekly and monthly breadth: still the main warning sign
The bigger issue remains the higher-timeframe breadth data.
Weekly breadth improved, but it is still negative:
-
Advancing week: 31.9%
-
Declining week: 66.6%
That is a better reading than Monday’s 26.9% / 71.9%, but it is still clearly skewed toward weakness.
Monthly breadth remains even more problematic:
-
Advancing month: 29.9%
-
Declining month: 69.7%
And over the rolling three-month period, decliners still hold the advantage:
-
Advancing 3 month: 44.8%
-
Declining 3 month: 54.8%
Even the more selective 25%-plus three-month movers remain unfavorable:
-
Adv 25% 3 month: 9.1%
-
Decl 25% 3 month: 11.8%
Those numbers are a useful reminder that Tuesday’s strength has to be judged in context. The market is bouncing from a weak internal position, not launching from a position of strength. That does not invalidate the rebound, but it does limit how aggressively it should be interpreted.
10-day context: from washout to rebound, but not yet to recovery
Looking at the full 10-session sequence, the pattern is fairly clean.
March 4 was the strongest internal day in this data set. After that, breadth deteriorated steadily, with a clear loss of participation between March 5 and March 13. The weakest moments came on March 12 and March 13, when declining breadth dominated and upside participation dried up.
Monday, March 16, was the first real sign of stabilization. Tuesday, March 17, continued that process.
So the current pattern is best described as a rebound after a breadth washout. That is an improvement over last week’s deterioration, but it is not yet the same as a durable recovery. For that, the market would still need to show broader improvement in stocks reclaiming their 20-day and 50-day averages, along with continued reduction in negative weekly and monthly breadth.
Brief news context
Tuesday’s modest advance appears consistent with a market still focused on the Fed meeting and trying to look through rising oil-related inflation worries. Reuters reported that Wall Street closed higher as traders positioned ahead of the Federal Reserve decision, while airline and travel stocks helped support sentiment despite continued concern over energy prices and Middle East tensions.
That backdrop fits the breadth data reasonably well. The market improved, but not in a carefree or fully risk-on way. It behaved more like a market finding short-term support while still carrying macro caution.
Conclusion
Tuesday strengthened the case that last week’s internal weakness had become stretched enough to produce a tradable rebound. Two consecutive strong daily breadth sessions are not something to dismiss lightly.
Still, the bigger message remains mixed. The rebound has improved daily internals, but the market has not yet repaired the broader participation damage visible in moving-average breadth, weekly breadth and monthly breadth. The charts tell the same story: long-term trends are mostly intact, but short-term technical control has not yet fully returned.
For now, this looks like a market in stabilization mode rather than a market already back in full health.
Breadth trend rating
3/7 – Neutral with a negative bias
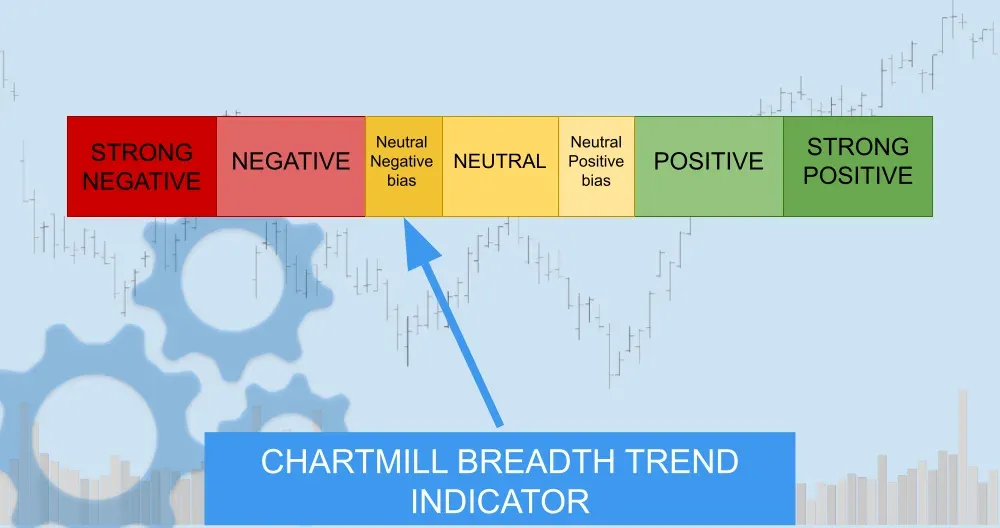
The short-term backdrop improved meaningfully over the last two sessions, but the higher-timeframe breadth structure remains weak enough to keep the overall rating below neutral.
ChartMill Market Desk
This daily update is prepared by ChartMill for informational purposes only and does not constitute investment advice. Always do your own due diligence before making investment decisions.
Next to read: Airlines Take Flight While Oil Burns: Markets Edge Higher Amid Middle East Tensions