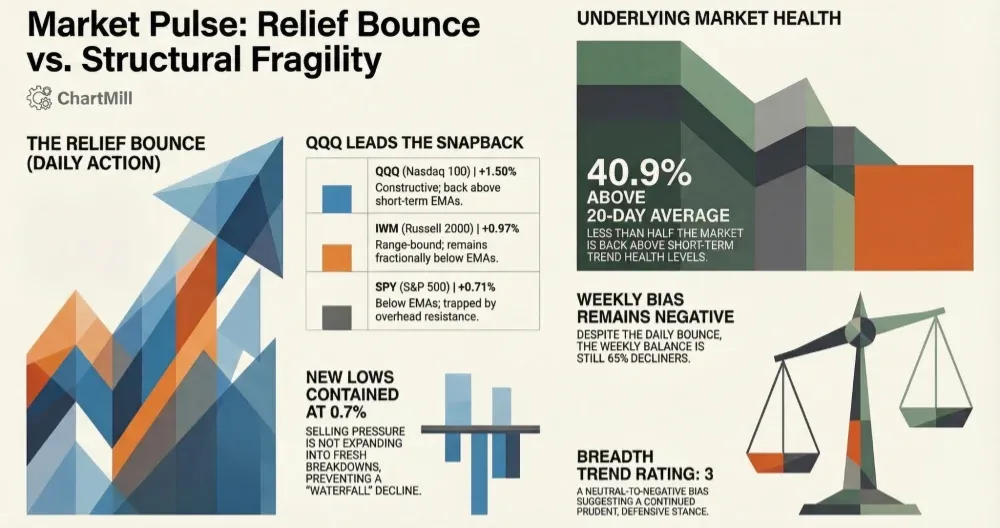
Yesterday delivered a clear relief bounce in participation versus Tuesday’s selloff, but the broader tape still looks fragile: short-term breadth is improving from weak levels, while the weekly backdrop remains skewed to decliners and the major ETFs are still stuck beneath overhead supply.
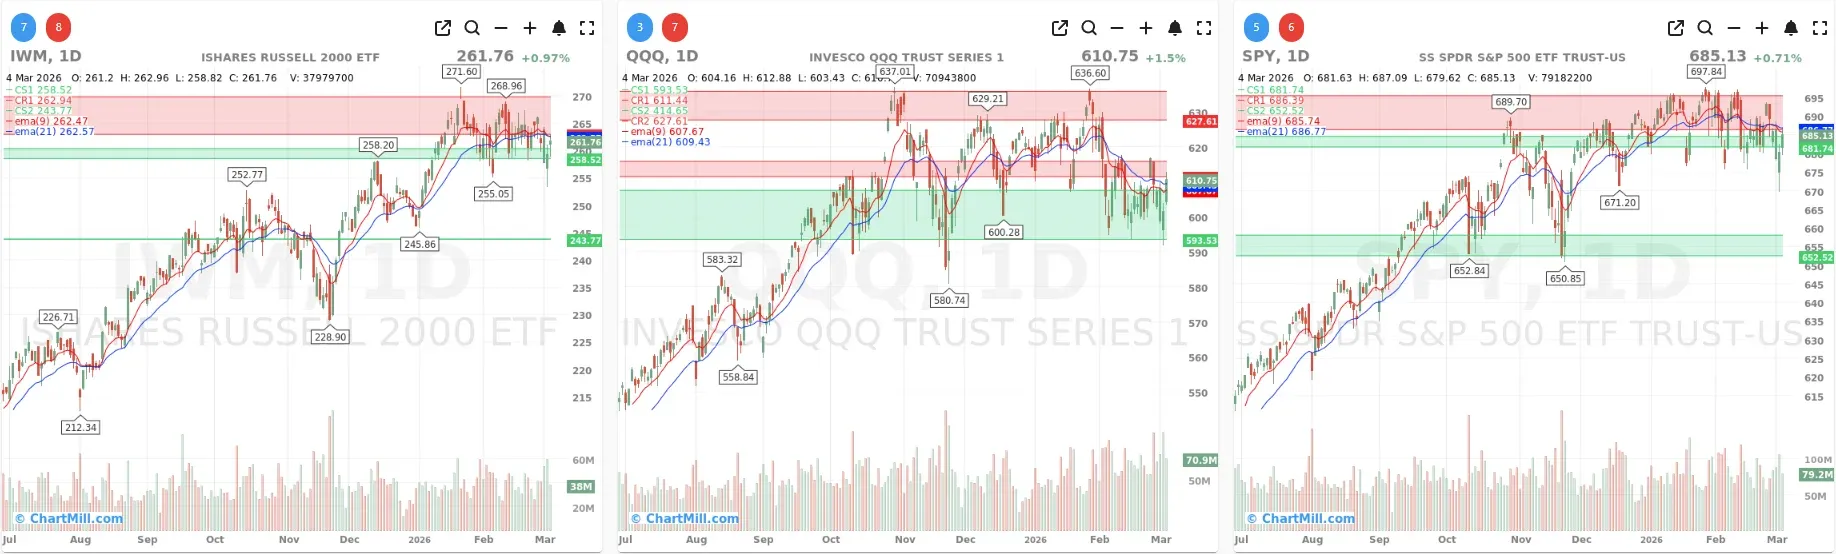
Index overview (SPY, QQQ, IWM)
Short Term (Daily)
Long Term (Weekly)

SPY
SPY closed higher (+0.71%), but price is still slightly below both EMA9 and EMA21, which fits the “bounce inside a range” narrative rather than a clean trend resumption. The chart also shows nearby overhead resistance in the upper zone (recent highs area), while support sits just below the current level. In other words: buyers showed up, but SPY didn’t reclaim short-term control yet.
QQQ
QQQ led on the day (+1.5%) and finished back above EMA9 and EMA21, which is the most constructive of the three on a short-term basis. Still, it remains well below the prior resistance band overhead, so this currently looks like a snapback within a larger consolidation rather than a confirmed breakout attempt.
IWM
IWM rose (+0.97%) but remains fractionally below EMA9/EMA21, keeping the short-term trend neutral-to-soft. Price action continues to look range-bound, with a clearly defined ceiling overhead and support not far below.
Weekly chart context (Trend Indicator / 30-week EMA)
On the weekly timeframe, all three ETFs still sit in structurally better shape than the daily action suggests (the longer-term trend framework remains supportive), but the key message is: price is pressing into resistance zones, not breaking through them. That helps explain why daily bounces have been happening, yet follow-through has been inconsistent.
Breadth dashboard (what changed vs. Tuesday)

Tuesday (Mar 3) was a broad downside day (20.6% advancers / 77.2% decliners). Wednesday flipped that sharply:
1) Participation improved materially
- Advancers Day: 68.6% vs Decliners Day: 28.6%
That’s a meaningful rotation back to green and a clear “breath of air” after the prior day’s pressure.
2) But it wasn’t an upside “thrust” day
- Adv 4% Day: 6.6% vs Decl 4% Day: 1.4%
So yes, good rebound, but not a widespread explosive move across the list. This matters because the strongest breadth turns usually come with a bigger pickup in large winners.
3) Short-term trend health is still weak
- SMA(20)+: 40.9%
Less than half the market is back above the 20-day average. That’s consistent with a market that can bounce, but is still not broadly re-accelerating.
4) Medium-term measures are mixed-to-okay
-
SMA(50)+: 49.7% (borderline)
-
SMA(100)+: 53.1%, SMA(200)+: 55.7% (still “more good than bad”)
This supports the idea that the market isn’t in structural collapse, it’s more a damaged short-term tape sitting on a still-acceptable longer-term base.
5) New lows contracted (good sign)
-
New Highs: 2.0% (still low)
-
New Lows: 0.7% (notably low)
This is one of the better takeaways: selling pressure isn’t expanding into fresh breakdowns right now, which often helps keep pullbacks from turning into waterfalls.
6) The weekly breadth picture is still negative
- Adv Week: 34% vs Decl Week: 65%
Even with today’s rebound, the last week’s balance is still clearly tilted toward decliners—so the market hasn’t “healed,” it has merely reacted.
What this means (connecting to the prior day)
This is the classic sequence we often see in choppy conditions:
-
Day 1: breadth rolls over hard (Tuesday’s 77% decliners)
-
Day 2: reflex rebound (today’s 69% advancers)
But: key repair metrics (SMA20+, weekly adv/decl balance, ETF reclaiming short EMAs) haven’t fully reset.
So today is constructive as a counterpunch, but the data still argues for caution: we’re seeing bounces, not broad-based trend repair.
Breadth trend rating (1–7)
Rating: 3 — Neutral (negative bias)
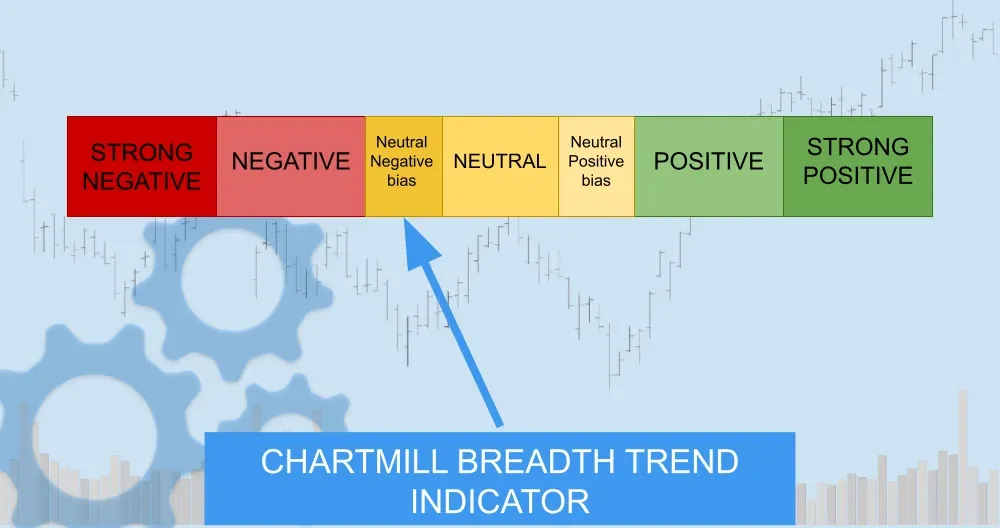
The day-to-day improvement is real, and new lows are contained, but the short-term internals are still weak and the weekly adv/decl balance remains decisively negative. Until we see SMA(20)+ push back toward/above 50% and the major ETFs more consistently reclaim their short EMAs (especially SPY/IWM), the prudent stance stays slightly defensive.
Kristoff - ChartMill
Next to read: Tech Chips Lead Wall Street Rebound as Broadcom Crushes Estimates