Thursday’s session brought another clear deterioration in U.S. market breadth, with already weak internals from Wednesday slipping further. The major indexes are now pressing into important support zones, while participation remains far too narrow to support a durable rebound. Short-term conditions are clearly under pressure, and even the longer-term backdrop is starting to lose stability.
Index Overview (SPY, QQQ, IWM)
Short Term (Daily)
Long Term (Weekly)

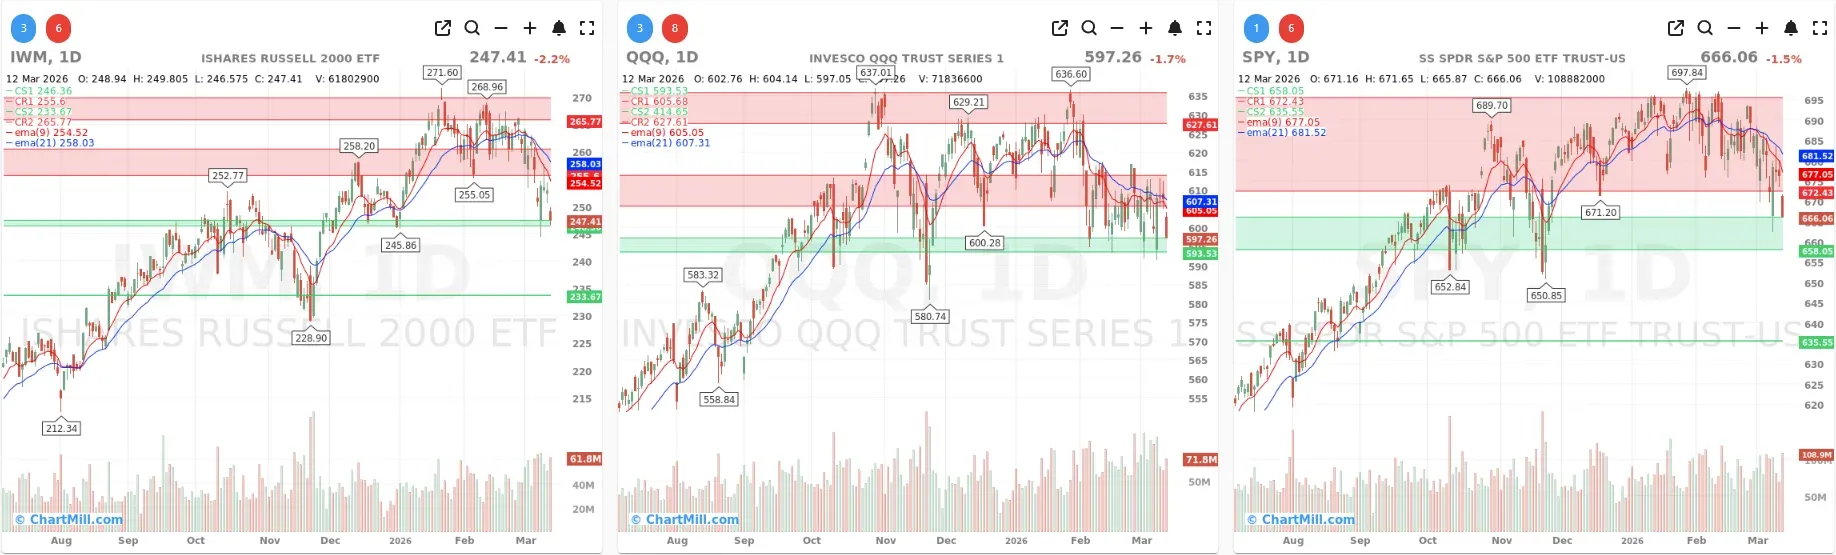
Thursday was another weak session across the major index ETFs, and the technical picture continues to deteriorate.
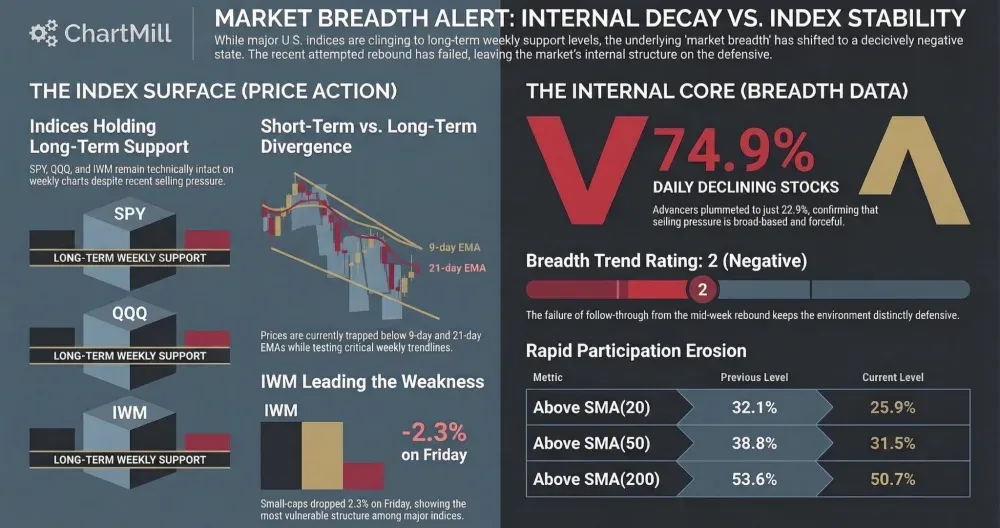
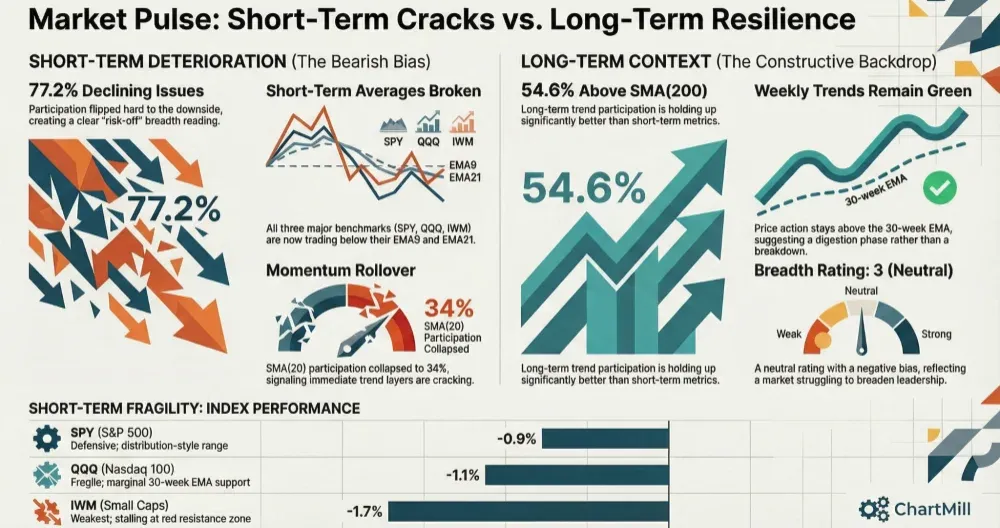
SPY lost 1.5% and closed at 666.06.
On the daily chart, price remains below both the 9-day EMA and the 21-day EMA, confirming that short-term momentum is still negative.
More importantly, SPY is now trading inside an important support area around the mid-660s. That zone is holding for now, but the index is no longer showing the kind of price behavior you want to see in a healthy market. On the weekly chart, SPY also slipped marginally below its 30-week trend line, which is a notable warning sign.
The long-term uptrend is not decisively broken yet, but it is clearly under pressure.
QQQ declined 1.7% to 597.26 and also remains below its daily EMA9 and EMA21.
That keeps the short-term trend negative. The index is now sitting right on top of an important support band near 593-597. On the weekly chart, QQQ is still the strongest of the three major ETFs, but even here the margin of safety is shrinking.
Price is essentially sitting on its trend line rather than clearly above it. That is a very different picture from a few weeks ago, when tech was still acting like the market’s relative strength leader.
IWM was again the weakest structurally. It lost 2.2% to close at 247.41.
The daily chart shows a failed rebound attempt and continued trading below both moving averages. Small caps remain under clear pressure and are now back near key support around the mid-240s.
On the weekly chart, IWM also slipped slightly below its long-term trend indicator. That does not automatically confirm a full trend reversal, but it does underline how fragile the broader market has become beneath the surface.
Taken together, the index message is straightforward: all three major ETFs remain in short-term downtrends, and the weekly charts are no longer offering the same level of long-term comfort.
QQQ still looks relatively better than SPY and IWM, but leadership is narrowing and even the strongest area of the market is no longer acting with conviction.
Breadth analysis: another step down
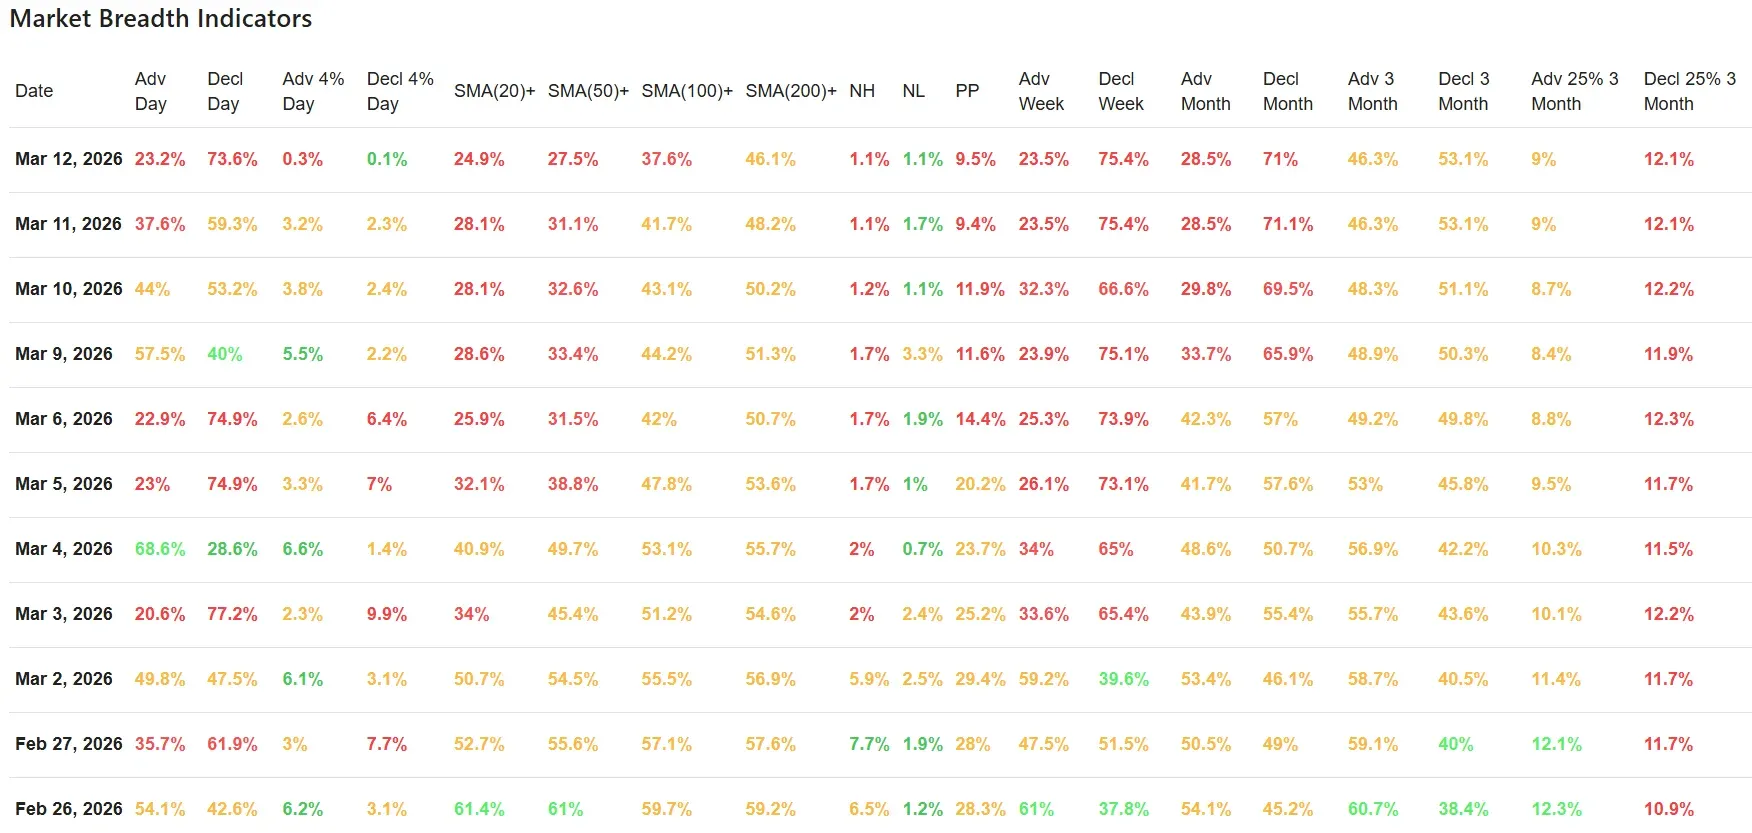
The breadth data for March 12 confirms that Wednesday’s weak reading was not a one-day anomaly. It actually got worse.
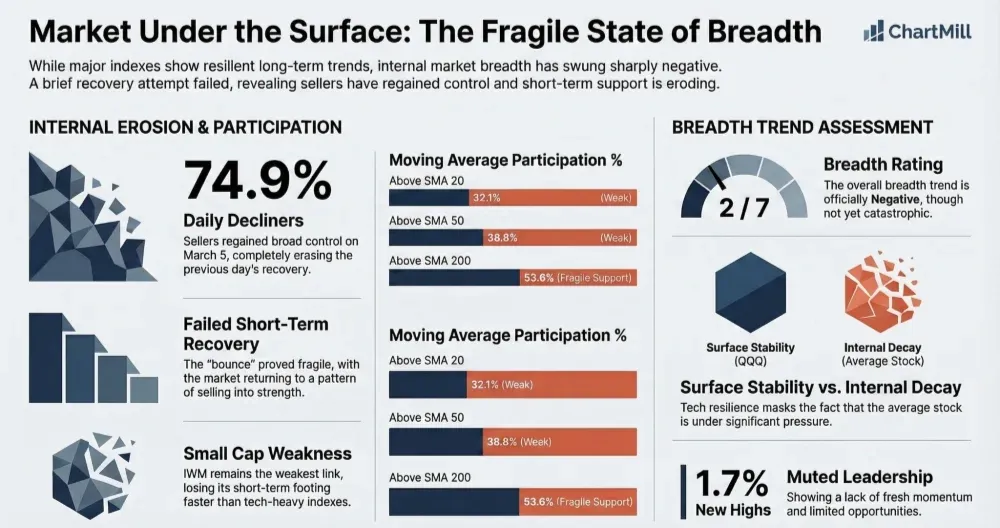
Only 23.2% of stocks advanced, while 73.6% declined. That is a very poor daily breadth reading and a clear step down from Wednesday’s already weak 37.6% advancers and 59.3% decliners. In other words, yesterday’s weakness broadened rather than stabilized.
The most striking part of the report is how little upside participation remains. Just 0.3% of stocks gained more than 4% on the day.
That tells us this was not a classic panic washout or a capitulation-style session. Instead, it looks more like a grinding, broad-based deterioration with very little upside energy. That is often a frustrating environment for active traders because it offers neither healthy leadership nor a true cleansing reset.
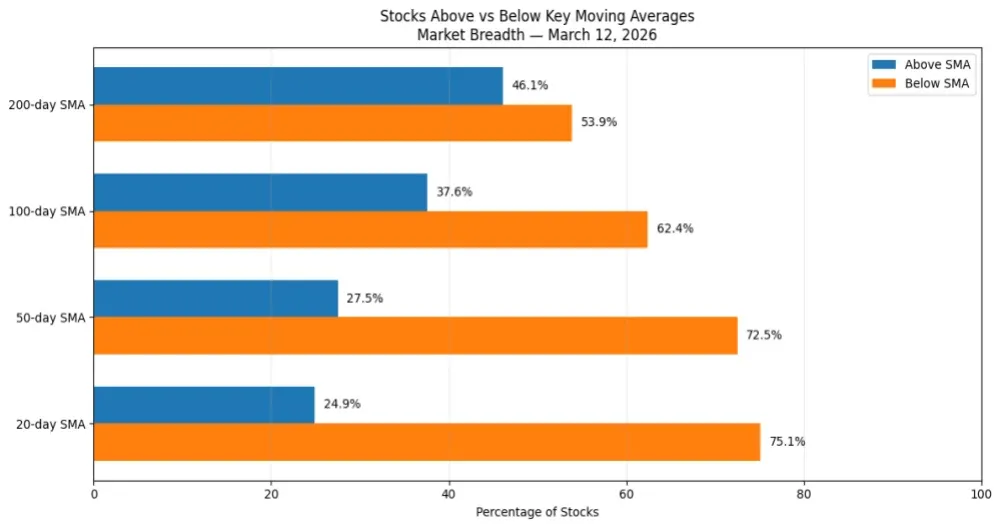
Participation versus key moving averages also weakened again:
-
24.9% of stocks are above their 20-day SMA
-
27.5% are above their 50-day SMA
-
37.6% are above their 100-day SMA
-
46.1% are above their 200-day SMA
Those numbers were already weak on Wednesday, and they all moved lower again on Thursday. The message is clear: short-term damage is continuing to spread, and the deterioration is gradually working its way up the trend ladder. The 200-day figure is still holding above 40%, which suggests the market is not yet in a full long-term collapse phase, but the direction is clearly unfavorable.
New highs and new lows came in at 1.1% and 1.1% respectively. On the surface, that looks balanced, but it is not a bullish sign in this context. In a healthy market, you want to see expanding new highs.
Instead, we are seeing very little leadership at all. The market is not producing broad downside extremes, but it is also failing to generate meaningful upside momentum. That is usually a sign of a market lacking sponsorship.
The broader time-based breadth data remains weak as well:
-
Advancing week: 23.5%
-
Declining week: 75.4%
-
Advancing month: 28.5%
-
Declining month: 71.0%
-
Advancing 3 months: 46.3%
-
Declining 3 months: 53.1%
These numbers reinforce the same conclusion seen in prior sessions: this is not just a bad day, and not just a bad couple of days. The market has been losing internal strength over multiple timeframes. The 3-month data is not catastrophic, but it is no longer supportive either. The shorter-term windows are decisively negative, and that matters most when assessing current trading conditions.
Another weak point is the lack of strong winners over a longer horizon. Only 9.0% of stocks are up at least 25% over the last three months, while 12.1% are down at least 25%. That spread remains unfavorable and confirms the absence of broad leadership. Healthy bull phases tend to produce a meaningful group of strong winners. Right now, that group is too small.
Comparison With the Previous Trading Day
Compared with Wednesday, Thursday looks like a continuation of the same bearish message, only more emphatic.
Yesterday’s analysis already pointed to poor participation, fragile index structure, and a market that was struggling to build any credible rebound. Thursday confirmed that view. Instead of seeing stabilization after a weak close, breadth deteriorated further, advancers collapsed, and the percentages above key moving averages moved lower again.
That is the most important takeaway from today’s report: the market did not merely stay weak, it became weaker beneath the surface.
The one thing that did not change dramatically is the longer-term backdrop. The 3-month figures are still weak rather than broken, and the percentages above the 200-day moving average, while deteriorating, have not yet fully collapsed.
That prevents the reading from shifting into the most extreme bearish category for now. But unless buyers quickly regain control, that longer-term cushion could continue to erode in the days ahead.
Final Conclusion
Market breadth weakened again on Thursday, and the internal picture is now clearly worse than it was one day earlier. The major indexes are testing important support zones, but the breadth data offers very little evidence that a durable rebound is ready to emerge from current levels.
The biggest concern is not just that the indexes are falling, but that participation remains extremely poor across daily, weekly, and monthly timeframes. Very few stocks are showing real upside power, and the proportion of stocks trading above key moving averages keeps shrinking. That is not the kind of backdrop that supports aggressive long exposure.
At the same time, this still does not look like a full-blown long-term collapse. Some longer-term breadth metrics are weak but not yet fully washed out, and that leaves room for a tradable rebound if support holds. But based on the current data, the market remains in a defensive state, and the burden of proof stays firmly with the bulls.
Breadth Trend Rating
2/7 – Negative
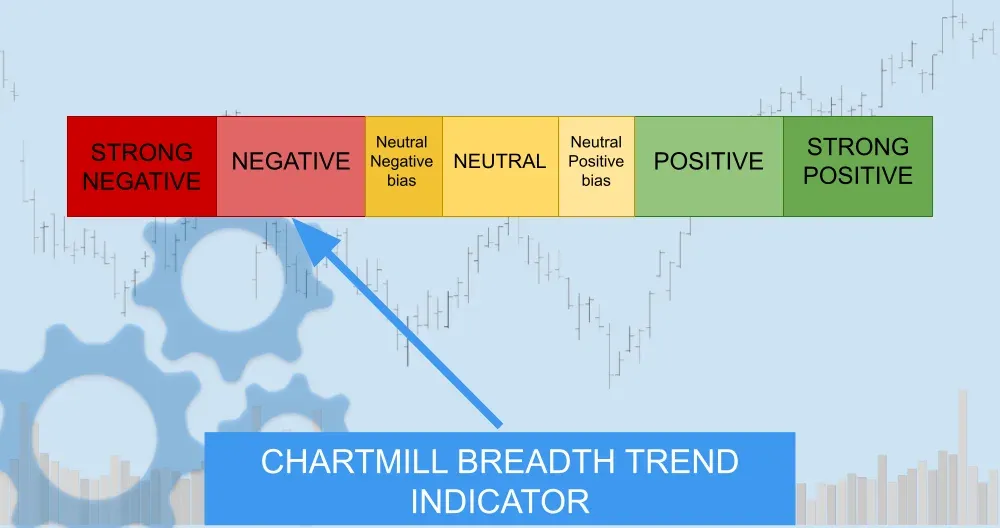
This remains a negative breadth environment, and Thursday’s data justifies keeping that rating firmly in place. In fact, the internals were worse than Wednesday’s.
The reason this is not downgraded to 1/7 (very negative) is that the longer-term breadth backdrop, while deteriorating, has not yet fully broken down, and the market is still sitting near support rather than in outright freefall.
But unless breadth improves soon, that distinction may not hold much longer.
Kristoff - ChartMill
Next to read: Oil Shock, Private Credit Cracks & Adobe's Bittersweet Beat