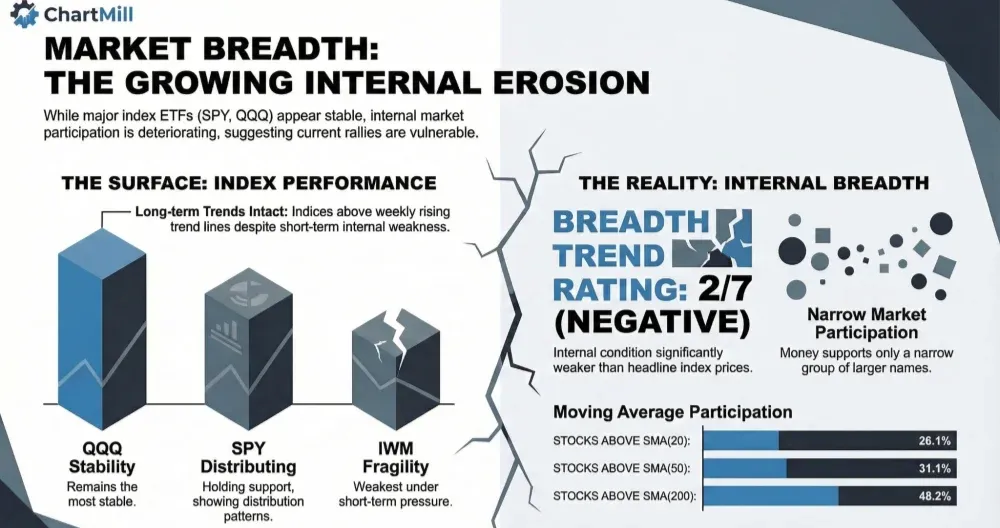
Broad market participation weakened again on Wednesday, even though the major index ETFs did not break down in dramatic fashion. The message from the internals remains cautious: the market is still holding important support on the surface, but beneath that surface, fewer stocks are participating and the short-term breadth trend continues to erode.
Index Overview (SPY, QQQ, IWM)
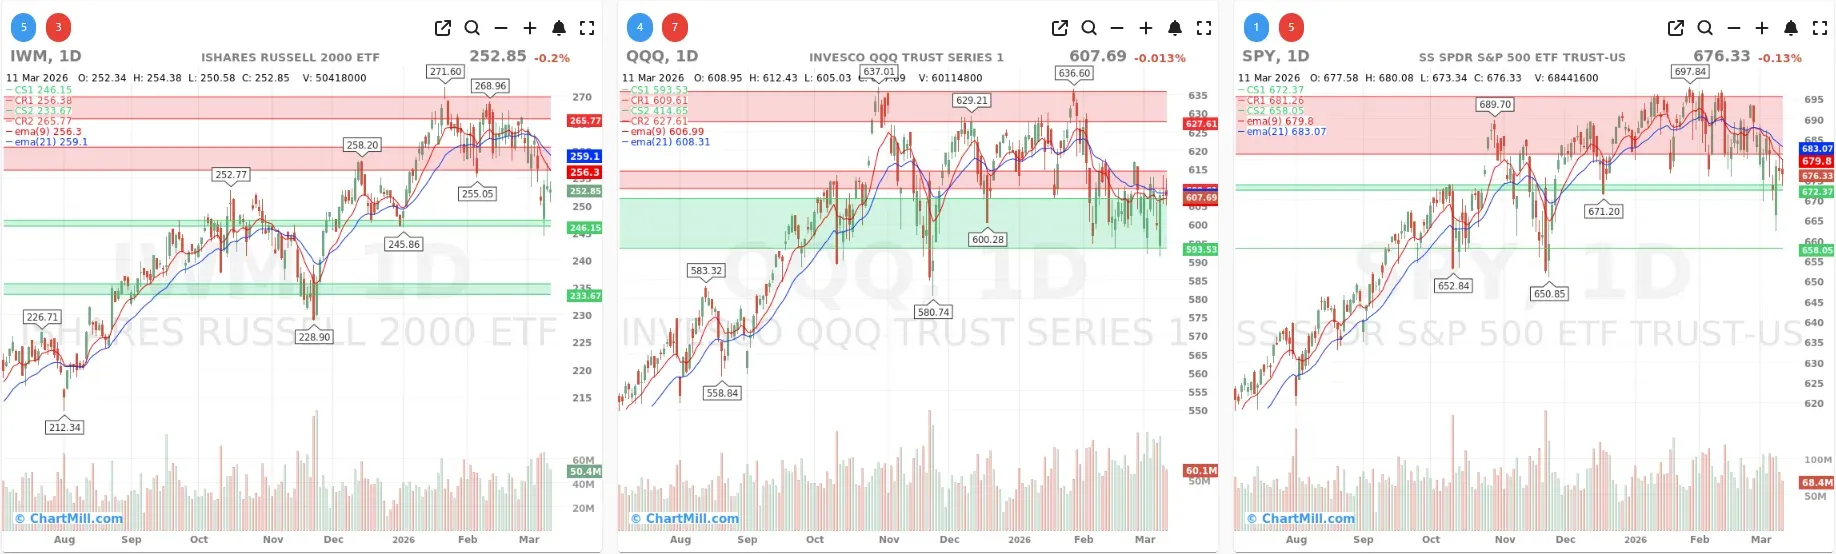
Short Term (Daily)
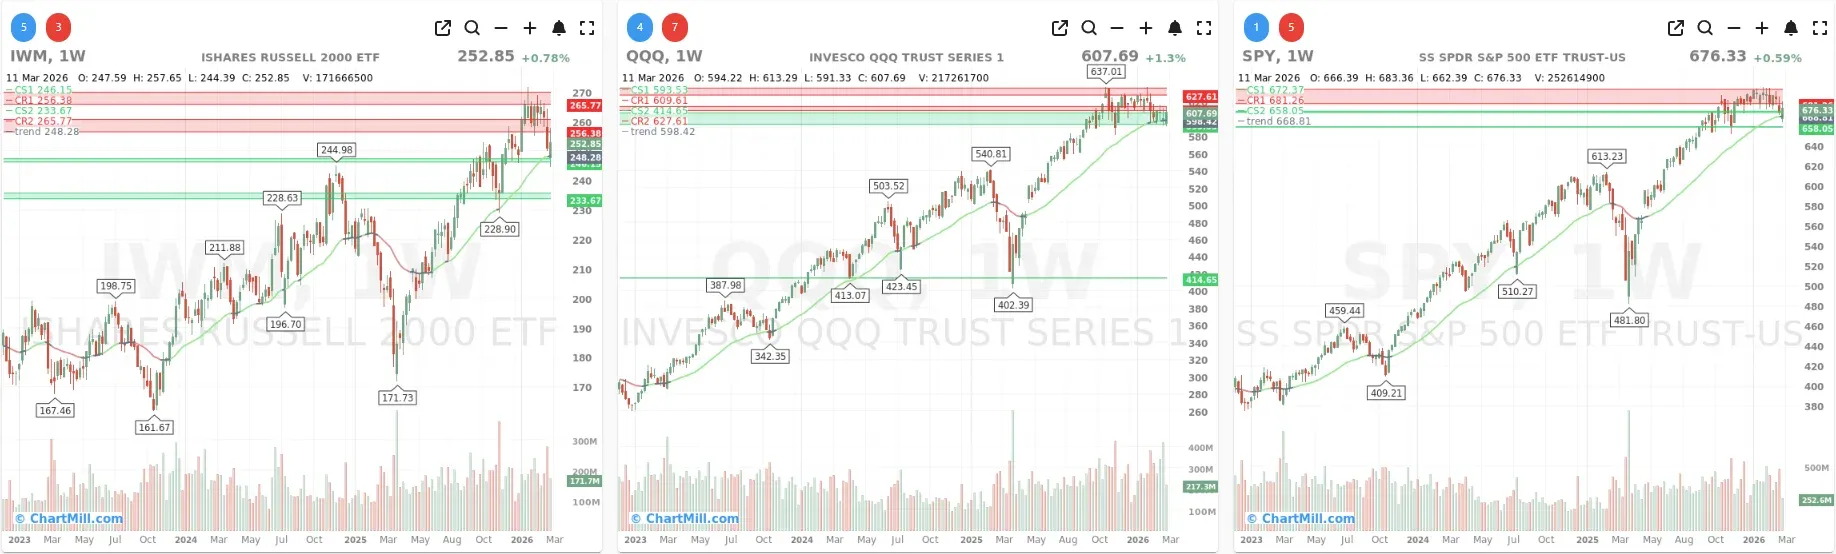
Long Term (Weekly)
The major index ETFs finished the day without a major technical collapse, but the underlying tone remained soft.
SPY closed at 676.33, down fractionally on the day and now sitting below both its 9-day EMA (679.8) and 21-day EMA (683.1).
Price is still holding near an important support area around the low 670s, but the recent pattern remains one of distribution rather than renewed upside momentum. On the weekly chart, SPY is still above its rising long-term trend line, so the bigger trend has not broken, but the short-term structure clearly lost strength.
QQQ held up better relative to the other two, closing at 607.69.
That leaves it roughly around its short-term moving averages, with the 9-day EMA near 607.0 and the 21-day EMA near 608.3.
In other words, QQQ is not showing decisive strength, but it is also not breaking down aggressively. On the weekly chart, it remains above the rising 30-week trend line, which keeps the long-term trend constructive. Among the three, QQQ still looks the most stable.
IWM remains the weakest of the group from a short-term perspective.
It closed at 252.85, still below both the 9-day EMA (256.3) and 21-day EMA (259.1).
Small caps tried to stabilize, but they continue to struggle below overhead resistance and remain more vulnerable than large-cap tech and the S&P 500. The weekly chart still shows IWM above its long-term trend line, but price is now clearly pressing against a more fragile short-term structure.
So the index picture is still one of short-term pressure inside longer-term uptrends. That matters, because it helps explain why breadth can look considerably weaker than the headline ETFs suggest.
Breadth analysis: another step down

Wednesday’s internal data confirms the caution that was already visible in Tuesday’s report.
Daily breadth weakened from 44.0% advancers vs. 53.2% decliners on March 10 to 37.6% advancers vs. 59.3% decliners on March 11. That is not an outright washout, but it is a clear deterioration. More importantly, it came after Tuesday had already warned that the rebound effort lacked healthy participation. Wednesday’s numbers now strengthen that message rather than contradict it.
The most telling part of the table remains the moving-average participation data:
-
SMA(20)+: 28.1%
-
SMA(50)+: 31.1%
-
SMA(100)+: 41.7%
-
SMA(200)+: 48.2%
These figures continue to point to a market where participation is weak across multiple timeframes. The short-term numbers are especially poor. Less than one-third of stocks are above their 20-day and 50-day moving averages, which means the average stock is still under pressure even while the major ETFs remain relatively close to support.
That is an important continuation from the previous session. Tuesday already showed that breadth was not improving enough to support a durable short-term recovery. Wednesday did not produce a reversal in that condition. Instead, the deterioration broadened further, especially in the shorter-term participation data.
No panic, but also no real repair
One nuance is worth emphasizing: the market is weak, but it is not yet showing full capitulation.
Only 3.2% of stocks gained more than 4% on the day, while 2.3% lost more than 4%. That is not healthy, but it also does not reflect indiscriminate panic selling. Likewise, new highs (1.1%) remain low, but new lows (1.7%) are not exploding higher. This tells us the market is still in a grinding deterioration phase rather than a waterfall decline.
That distinction matters. The current tape looks more like a market that is losing internal sponsorship than one undergoing a final washout. In practical terms, that often means rallies remain vulnerable because there is not enough broad buying power to sustain them, but it also means sentiment may not yet be stretched enough for a strong reflex rebound.
Medium-term breadth also keeps leaning the wrong way
The weakness is not limited to the daily numbers.
Weekly breadth worsened sharply to 23.5% advancers vs. 75.4% decliners, compared with 32.3% vs. 66.6% the day before. That is a notable slide and shows that this is not just a one-day wobble.
Monthly breadth remains weak as well:
-
Adv Month: 28.5%
-
Decl Month: 71.1%
Even the 3-month figures, while less extreme, are still unimpressive:
-
Adv 3 Month: 46.3%
-
Decl 3 Month: 53.1%
And only 9.0% of stocks are up at least 25% over the past three months, versus 12.1% that are down at least 25%. That is another sign that leadership is thin and the damage underneath the surface is broader than the index charts alone would suggest.
This is one of the clearest continuations from the prior day’s analysis: Tuesday suggested that the market was not seeing enough internal improvement to shift the tone. Wednesday confirms that the broader trend in participation is still deteriorating, not stabilizing.
Human context: what the market is saying
The market currently looks like a tape where investors are still willing to support a relatively narrow group of larger names, but are not yet willing to re-embrace the broader equity universe. That usually reflects a more defensive mindset: money is not leaving equities entirely, but it is becoming more selective.
This kind of environment often creates a confusing visual contrast. The index charts can appear “not too bad,” especially on weekly timeframes, while traders working with individual stocks experience a much weaker reality. That is exactly what the current breadth data is showing.
Unless participation improves meaningfully, any short-term bounce in the major ETFs is likely to remain suspect. The market does not need all breadth metrics to turn strong at once, but it does need at least some evidence that more stocks are starting to reclaim their short-term moving averages and that advancing volume is broadening. Wednesday did not provide that evidence.
Conclusion
The overall message remains clearly negative. While the major index ETFs are still holding above their long-term weekly trend measures and have not yet broken down in dramatic fashion, the underlying breadth data weakened further on Wednesday. That is the key point.
Compared with the previous session, the internals did not stabilize. They deteriorated again. Daily participation weakened, weekly breadth turned even more negative, monthly breadth also slipped further, and the percentage of stocks trading above key moving averages remained extremely poor. In other words, the market’s internal condition worsened even if the headline indexes masked part of that weakness.
That keeps the main theme unchanged: the indexes are holding up better than the average stock, but the broader market underneath continues to erode. Until participation improves meaningfully and more stocks begin to reclaim important short-term trend levels, the burden of proof remains on the bulls.
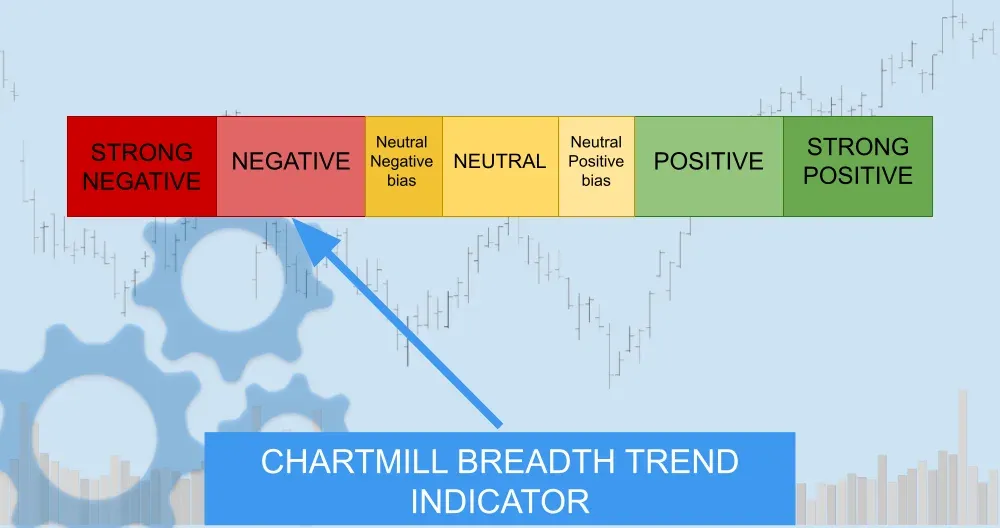
Breadth trend rating: 2/7 — negative
Kristoff - ChartMill
Next to read: Oil, Algorithms, and a $553 Billion Backlog: What Really Moved Markets on Wednesday