
(All data & visualisations by ChartMill.com)
Daily Market Trend Analysis – September 03, 2025 (After Market Close)
All Indexes in sideways range for now
Short Term Trend

- Short-Term Trend: CHANGE - Positive (from Neutral)
- Next Support at $640 - $630
- Next Resistance at $650
- Volume: At Average (50)
- Pattern: Up Day - Gap Up
- Short-Term Trend: Neutral (no change)
- Next Support at $560
- Next Resistance at $583
- Volume: Slightly Above Average (50)
- Pattern: Up Day - Gap Up - Doji Candle
- Short-Term Trend: Positive (no change)
- Next Support at $225 - $230
- Next Resistance at $237
- Volume: At Average (50)
- Pattern: Up Day - Doji Candle
Long Term Trend
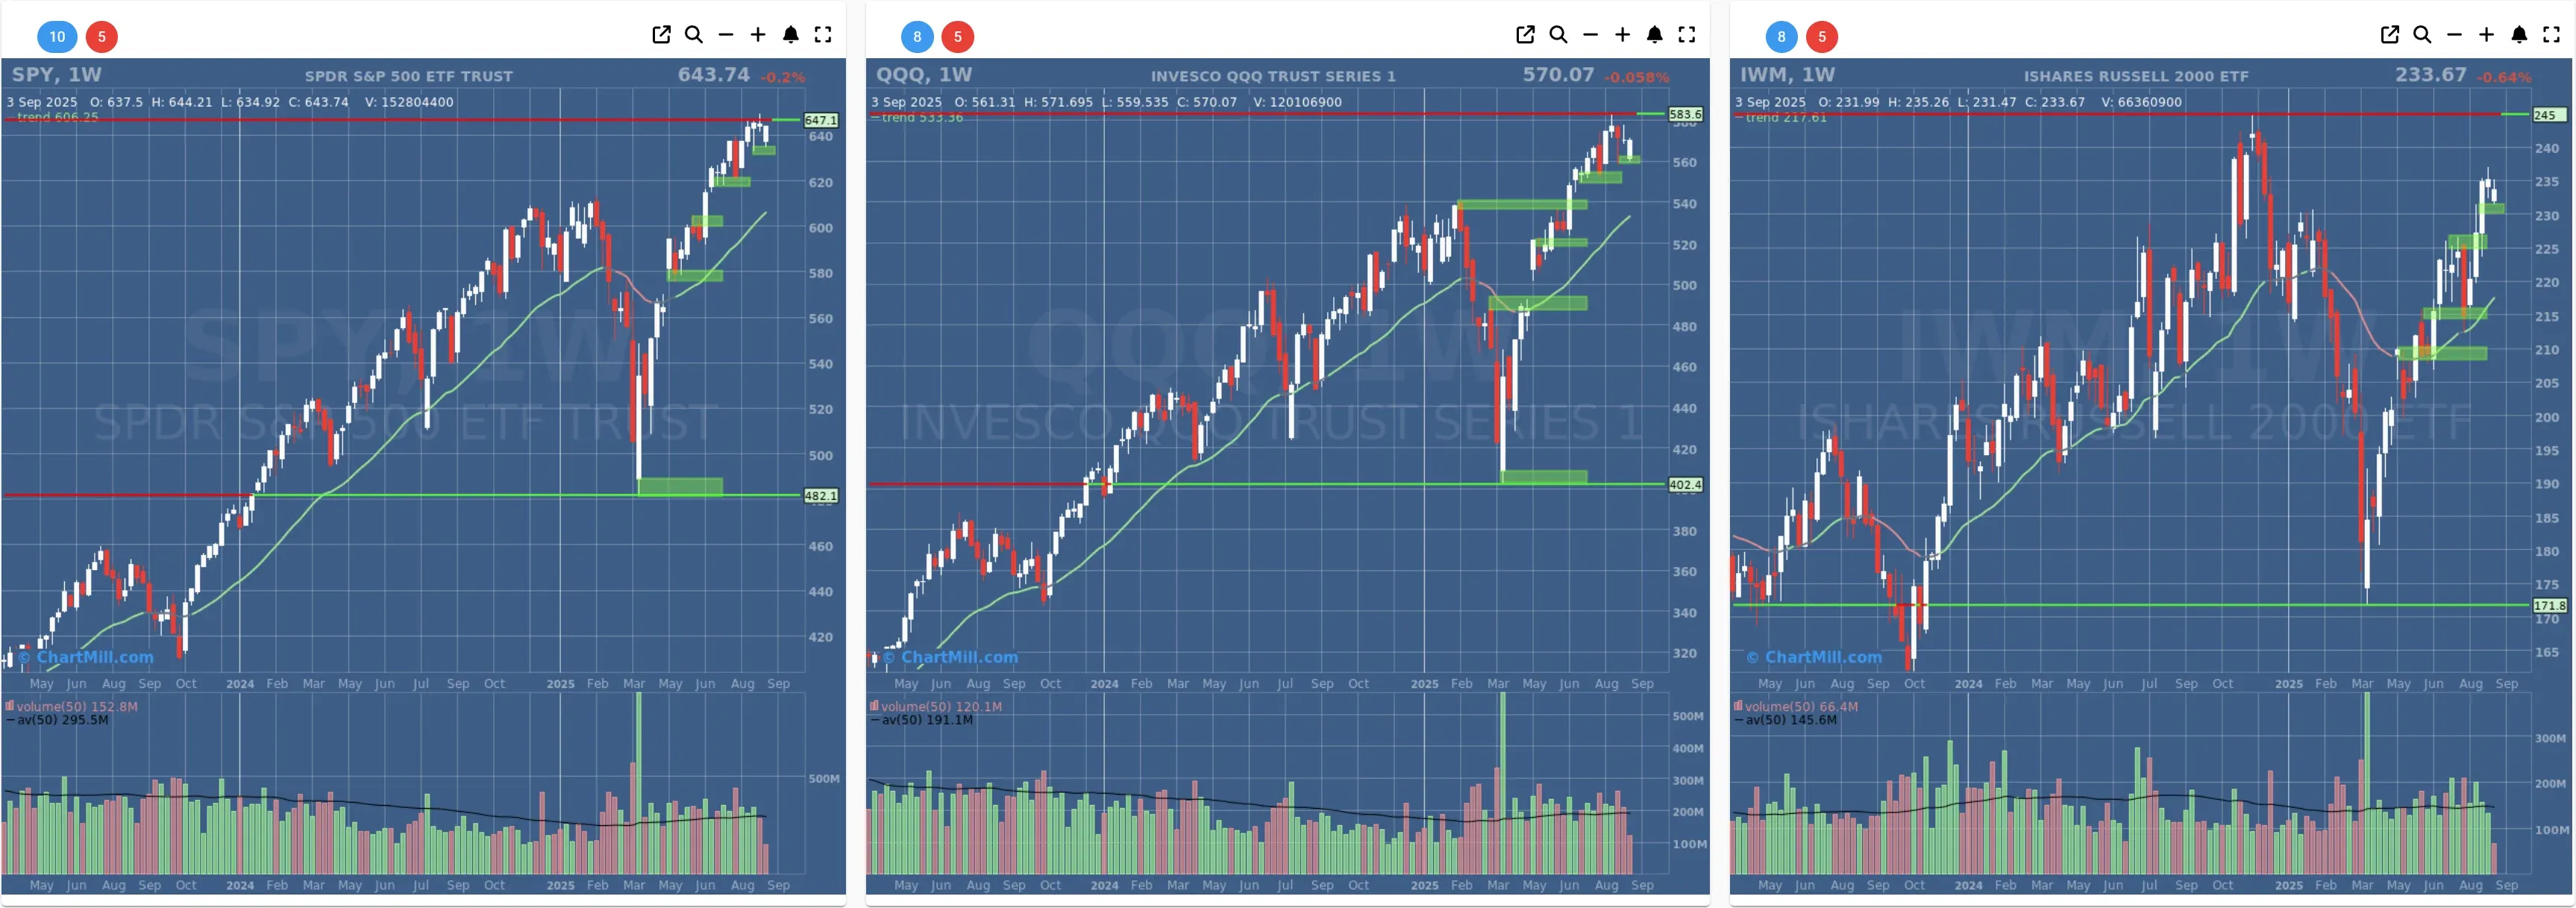
- Long-Term Trend: Positive (no change)
- Long-Term Trend: Positive (no change)
- Long-Term Trend: Positive (from neutral)
Daily Market Breadth Analysis – September 03, 2025 (After Market Close)
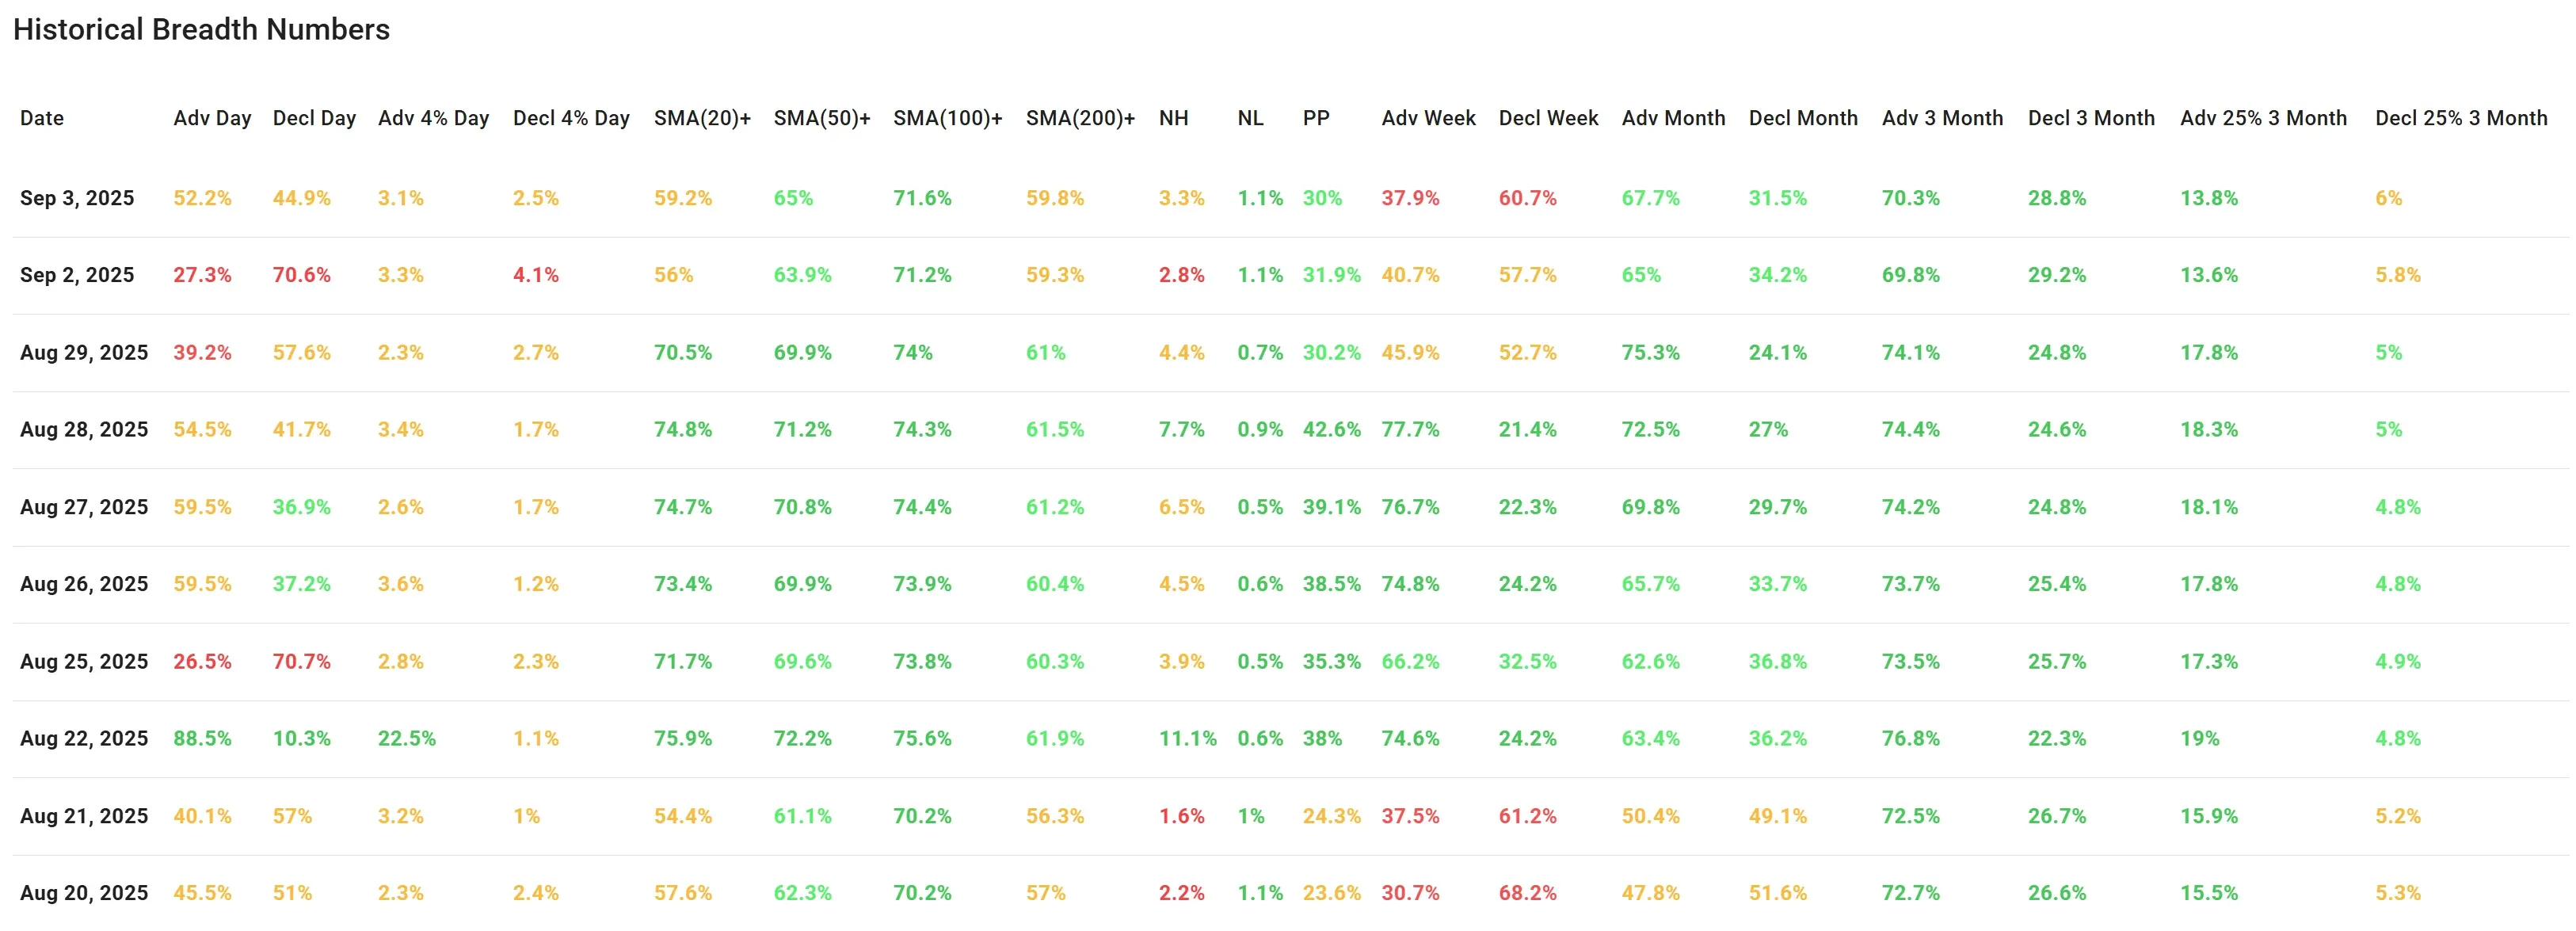
After a sharp decline in participation at the start of the week, market breadth metrics showed some recovery on September 3. However, the rebound lacked conviction, and many short-term indicators still signal a fragile underlying trend. Broader metrics remain stable, but caution is warranted.
Following the breadth deterioration on September 2, the latest data for September 3 shows a partial recovery, albeit with limited strength. Let's break it down.
Daily Metrics
Advancing stocks outpaced decliners with 52.2% vs. 44.9%, reversing the imbalance seen the day before (27.3% vs. 70.6%).
However, strong advancing days (Adv 4% Day) remained modest at 3.1%, and strong decliners (Decl 4% Day) were still at 2.5%. These muted extremes suggest a rebound lacking strong conviction.
The percentage of stocks above key SMAs barely moved:
-
SMA(20): 59.2% (up from 56%)
-
SMA(50): 65% (up slightly)
-
SMA(100): 71.6% (flat)
-
SMA(200): 59.8% (also flat)
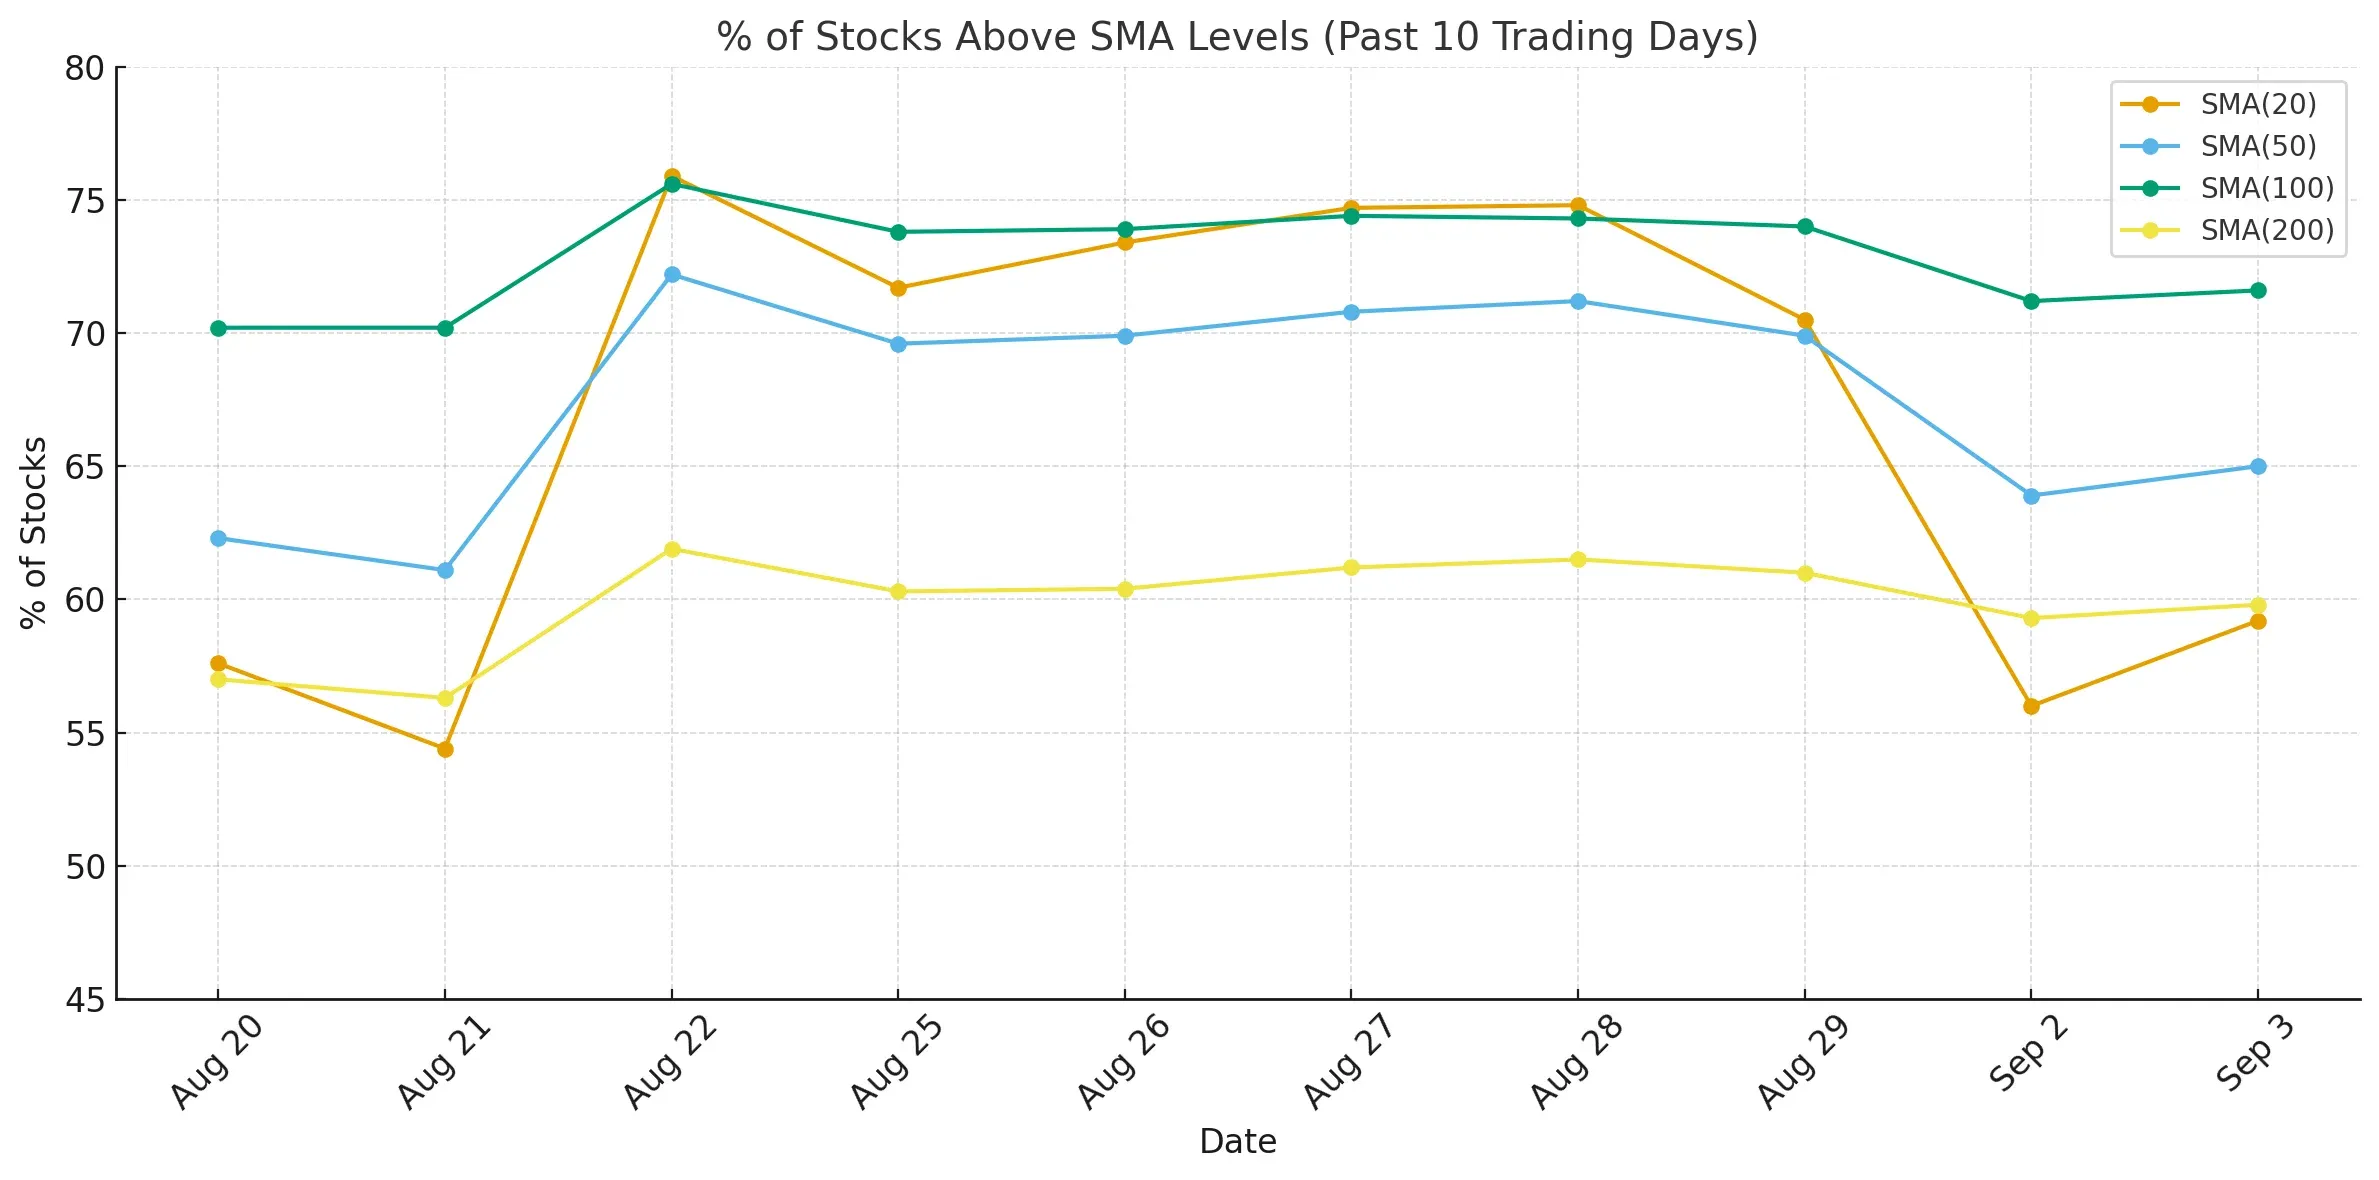
This suggests consolidation rather than momentum.
New Highs / New Lows
-
New Highs (NH): 3.3% (slightly up from 2.8%)
-
New Lows (NL): 1.1% (unchanged)
The NH/NL spread improved slightly but remains far from bullish territory.
Weekly Advances/Declines:
-
Adv Week: 37.9%
-
Decl Week: 60.7%
This confirms that, over the past week, breadth still favors decliners.
Medium- to Long-Term Breadth
The broader trend continues to stabilize:
-
Adv Month: 67.7% (slightly up from 65%)
-
Decl Month: 31.5% (down from 34.2%)
-
Adv 3 Month: 70.3%
-
Decl 3 Month: 28.8%
-
Adv 25% 3 Month: 13.8%
-
Decl 25% 3 Month: 6%
These numbers support a longer-term uptrend, though the most aggressive performers (top 25%) remain a relatively small group.
Comparison to Previous Analysis (Sept 2, 2025)
In the previous article, breadth was rated as negative, following a sharp drop in daily participation and a broad-based decline in short-term metrics. The current data shows a rebound, but the limited strength in advancing 4% days, static SMA readings, and weak weekly breadth suggest this is more a pause or bounce than a convincing turn.
Importantly, this recovery doesn’t fully offset the recent weakness, and short-term breadth remains under pressure, though broader metrics (monthly and 3-month) are still in decent shape.
Breadth Trend Rating: 3 – Neutral
While the broader trend metrics remain intact, the short-term weakness and modest rebound imply a neutral stance is most appropriate. This could evolve quickly in either direction depending on follow-through in the coming days.

Kristoff - ChartMill
Next to read: Market Monitor News, September 04 BMO