

Index overview (SPY, QQQ, IWM)
Short Term (Daily)
Long Term (Weekly)
SPY
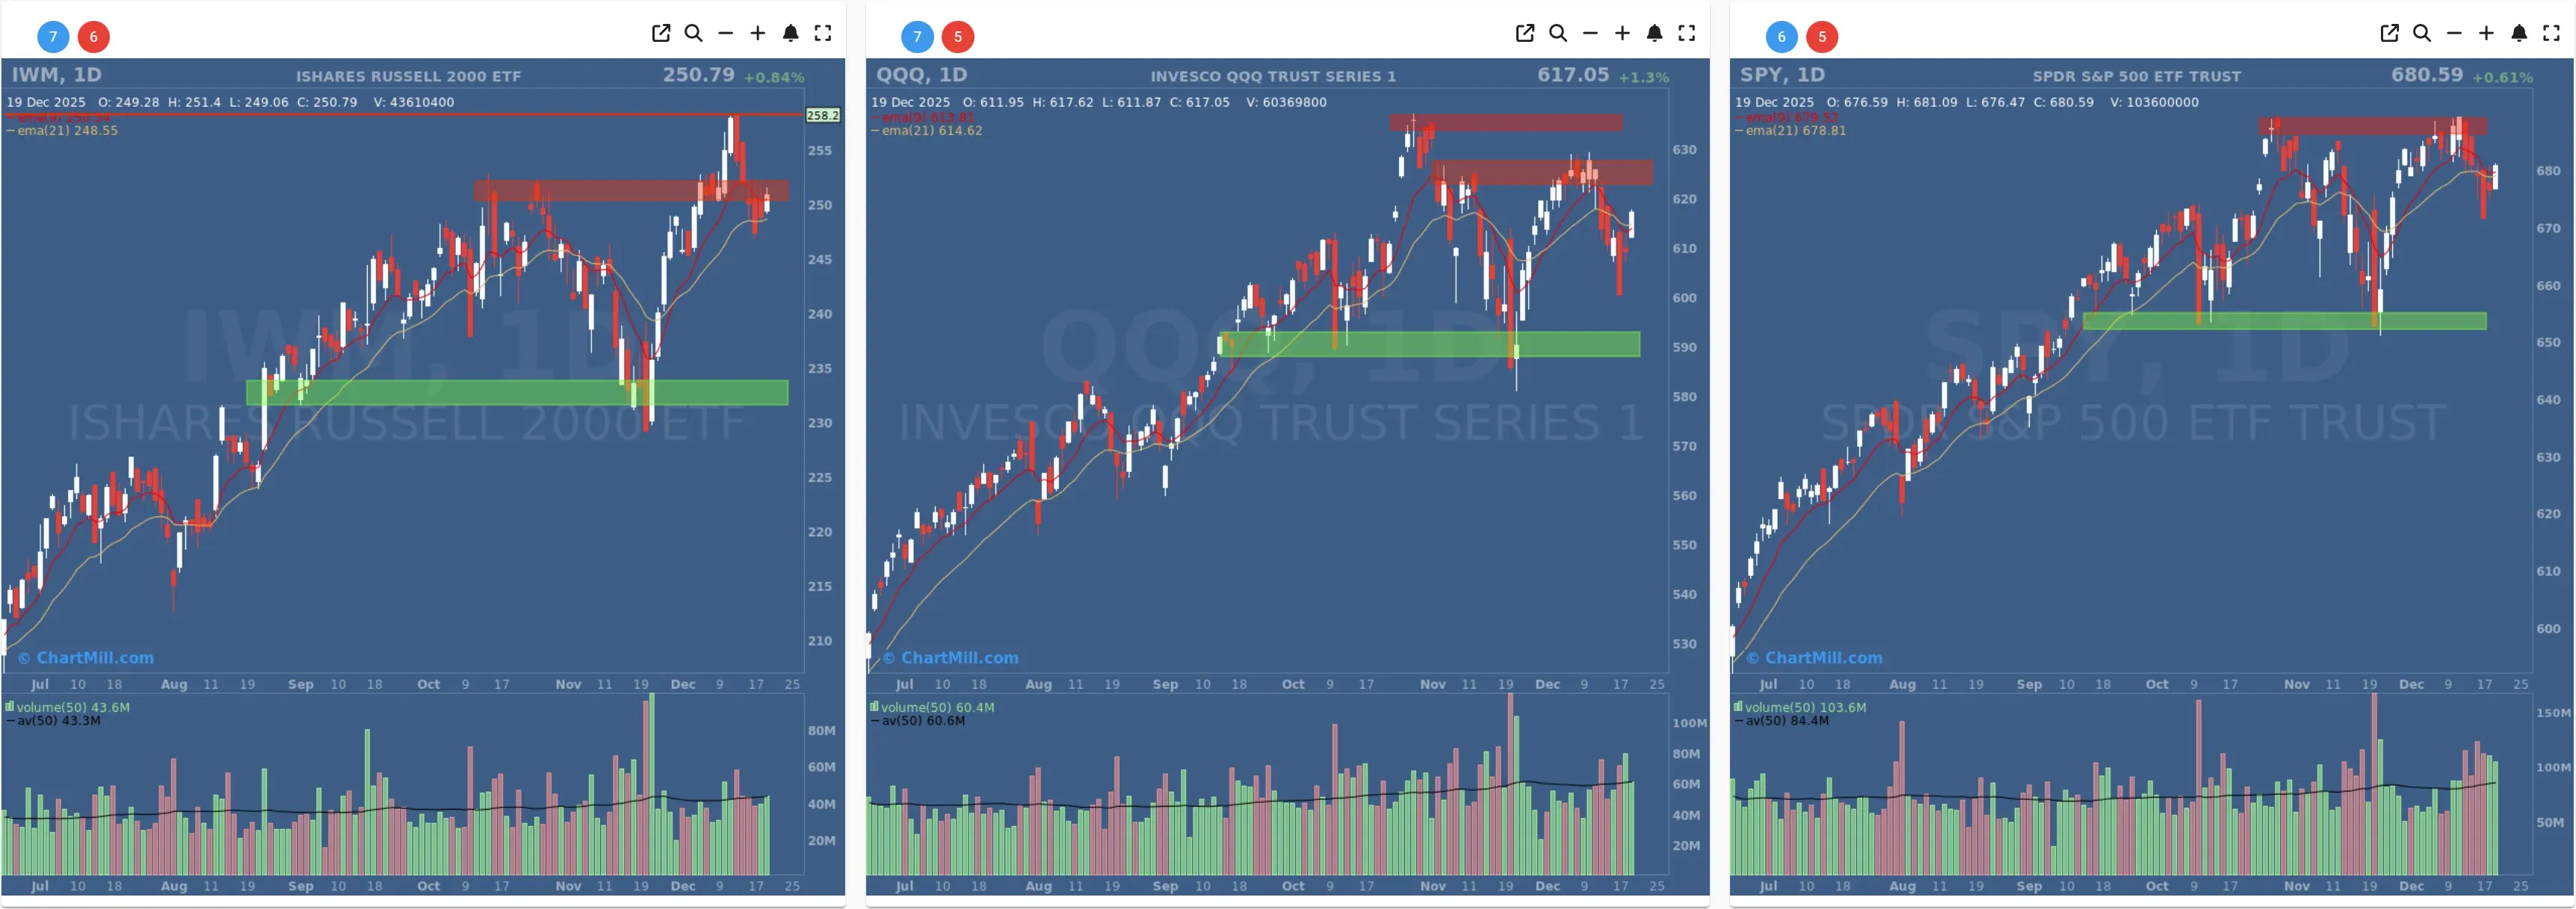
Daily: SPY closed 680.59 (+0.61%), regaining the the EMA9 & EMA21. Price is still pressing into overhead supply (recent highs / marked resistance zone), which explains the “two steps forward, one step back” feel: buyers are present, but they’re working through prior distribution.
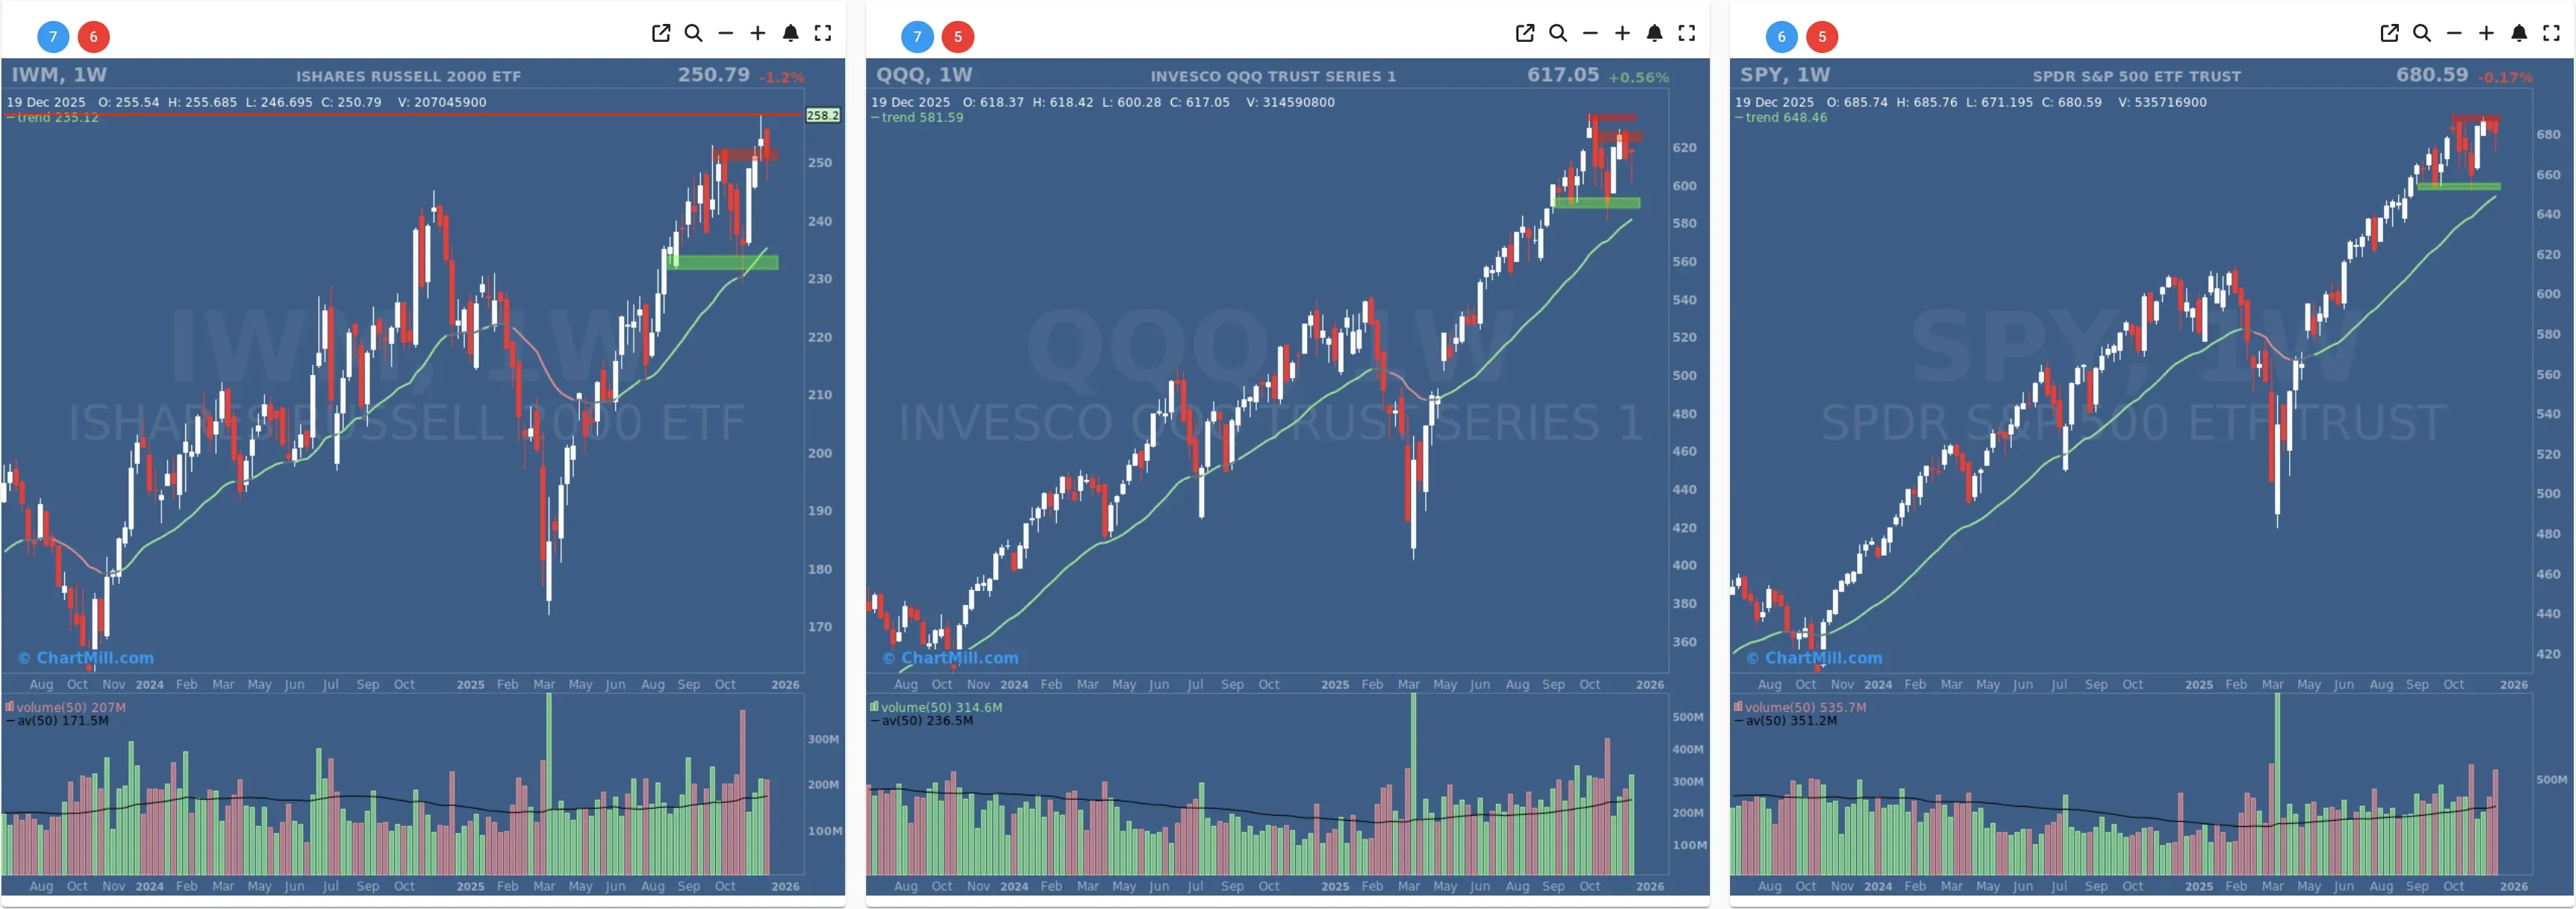
Weekly: Long-term trend remains positive (price well above the rising 30-week trend line). The weekly candle is relatively tight (-0.17% on the week), consistent with consolidation near highs rather than a breakdown.
Takeaway: SPY is acting like a market that’s trying to resume the uptrend, but it’s doing it under a low ceiling. Breakout attempts likely need stronger participation underneath.
QQQ
Daily: QQQ closed 617.05 (+1.3%), reclaiming ground above the EMA9 & EMA21. This is an important continuation from Thursday: buyers defended the dip and pushed back into the lower resistance area.
Context vs. yesterday: You noted the EMA9 crossing below EMA21 on QQQ in the prior update. Friday’s bounce helps, but one strong day doesn’t automatically “undo” that bearish momentum signal, this often requires a few sessions of follow-through (or at least a clean hold above the short-term averages).
Weekly: Still constructive (+0.56% on the week), and the longer-term trend stays positive with price above the 30-week trend line.
Takeaway: QQQ is repairing, but it’s still in the zone where failed rallies can happen quickly. Follow-through is the key word.
IWM
**Daily:**IWM closed 250.79 (+0.84%), holding above the EMA21 and regaining the EMA9 after a sharp pop and pullback. It’s still digesting near an overhead resistance band (marked in red), suggesting small caps are “okay,” but not yet powering higher cleanly.
Weekly: Despite a strong longer-term structure, IWM finished the week down (-1.2%), indicating more chop and mean-reversion than trend acceleration right now.
Takeaway: IWM is participating again, but it’s the least clean of the three on a short-term basis, more “range” than “run.”
Breadth dashboard (what changed vs. Thursday)
Daily breadth stayed positive, but slightly less powerful
-
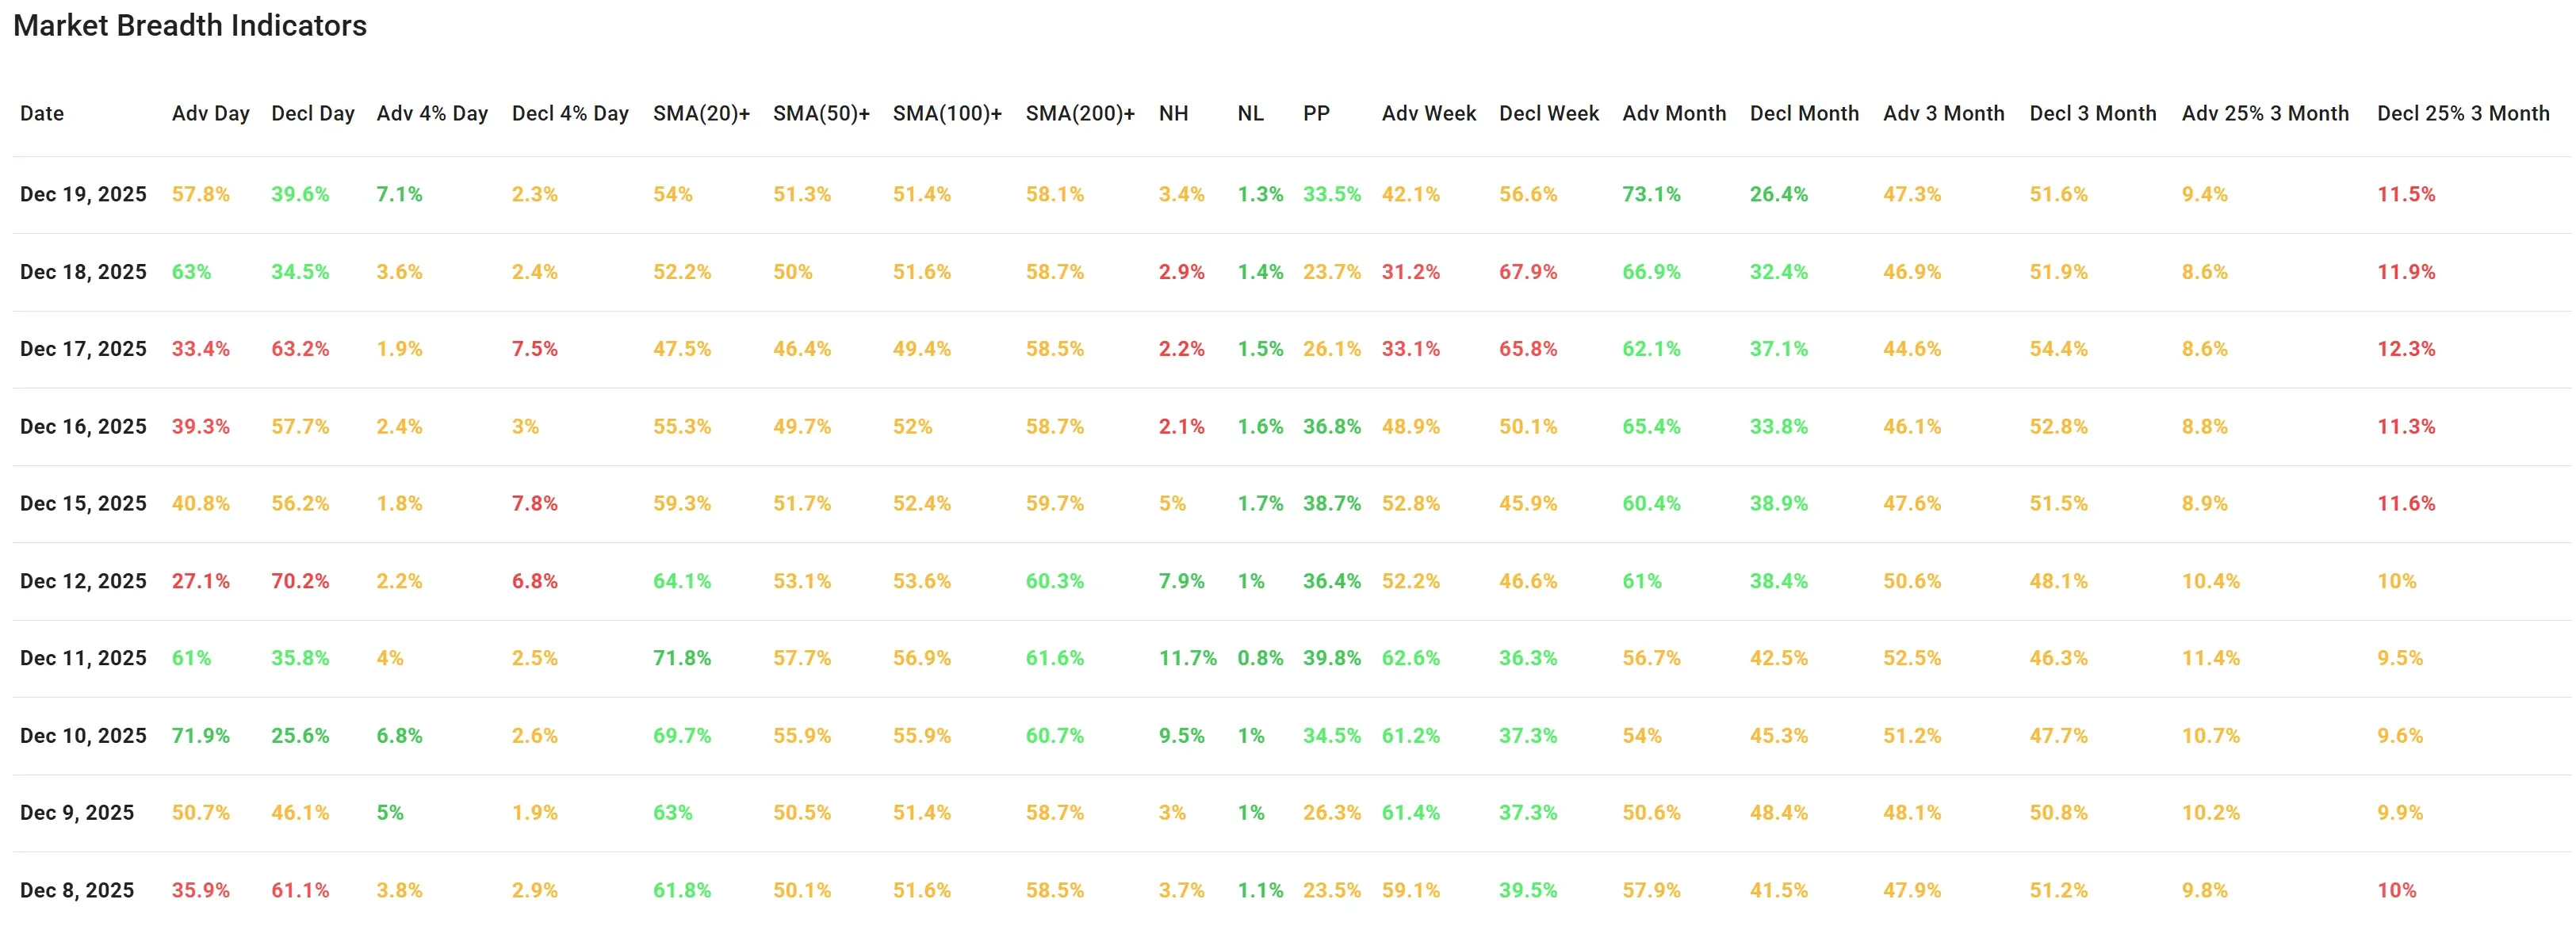
Advancers: 57.8% (down from 63%)
-
Decliners: 39.6% (up from 34.5%)
So, Friday was still a net positive day, just not as strong as Thursday’s thrust.
Big-move breadth improved (a healthy sign)
-
Advancing >4%: 7.1% (up from 3.6%)
-
Declining >4%: 2.3% (slightly down from 2.4%)
This is subtle but important: the rebound isn’t only “less bad,” it showed more upside power (more meaningful winners) while deep downside remained contained.
Participation above moving averages ticked higher
-
Above SMA20: 54% (from 52.2%)
-
Above SMA50: 51.3% (from 50%)
-
Above SMA100: 51.4% (slightly down from 51.6%)
-
Above SMA200: 58.1% (slightly down from 58.7%)
Interpretation: short-term participation improved, but the market still sits around the “coin-flip zone” (low-50s). That’s consistent with the index charts: uptrend intact, but overhead resistance is slowing momentum.
New highs continued to beat new lows
-
New highs: 3.4% (from 2.9%)
-
New lows: 1.3% (from 1.4%)
The highs/lows spread stayed constructive, which supports the idea that this is repair, not broad deterioration.
Weekly breadth is still the “problem child”
-
Adv Week: 42.1% (from 31.2%)
-
Decl Week: 56.6% (from 67.9%)
This is improving quickly (good!), but decliners still lead on the week. In other words: the market is fixing the damage, but hasn’t fully reversed it yet.
Monthly breadth looks strong; 3-month still mixed
-
Adv Month: 73.1% (from 66.9%)
-
Decl Month: 26.4% (from 32.4%)
That’s a strong tailwind, on a one-month basis, this remains an offensive market.
-
Adv 3 Month: 47.3% (from 46.9%)
-
Decl 3 Month: 51.6% (from 51.9%)
The 3-month window still leans slightly negative: not “bearish,” but it does warn that the market has been more rotational and selective than universally strong.
What to watch next
Follow-through days: You want to see SMA20+ and SMA50+ push into the high-50s/60s, not stall in the low-50s.
Weekly breadth flip: A meaningful improvement would be Adv Week overtaking Decl Week, that would confirm the bounce is becoming a broader trend again.
Indices vs. resistance: SPY/QQQ are close enough to overhead supply that a “good breadth day” matters more than usual. If indices break out while breadth stays stuck ~50%, it increases the risk of a narrow breakout.
Breadth trend rating
Neutral, positive bias.

The market continues to repair: daily participation is positive, big winners expanded, and highs beat lows. But weekly breadth is still behind and the 3-month picture remains slightly negative, so this is improving, not yet fully healthy.
Kristoff
Next to read: TikTok’s Oracle Lifeline Rekindles the AI Bid — Nike and Lamb Weston Get Steamrolled