

Index overview (SPY, QQQ, IWM)
Short Term (Daily)
Long Term (Weekly)

SPY
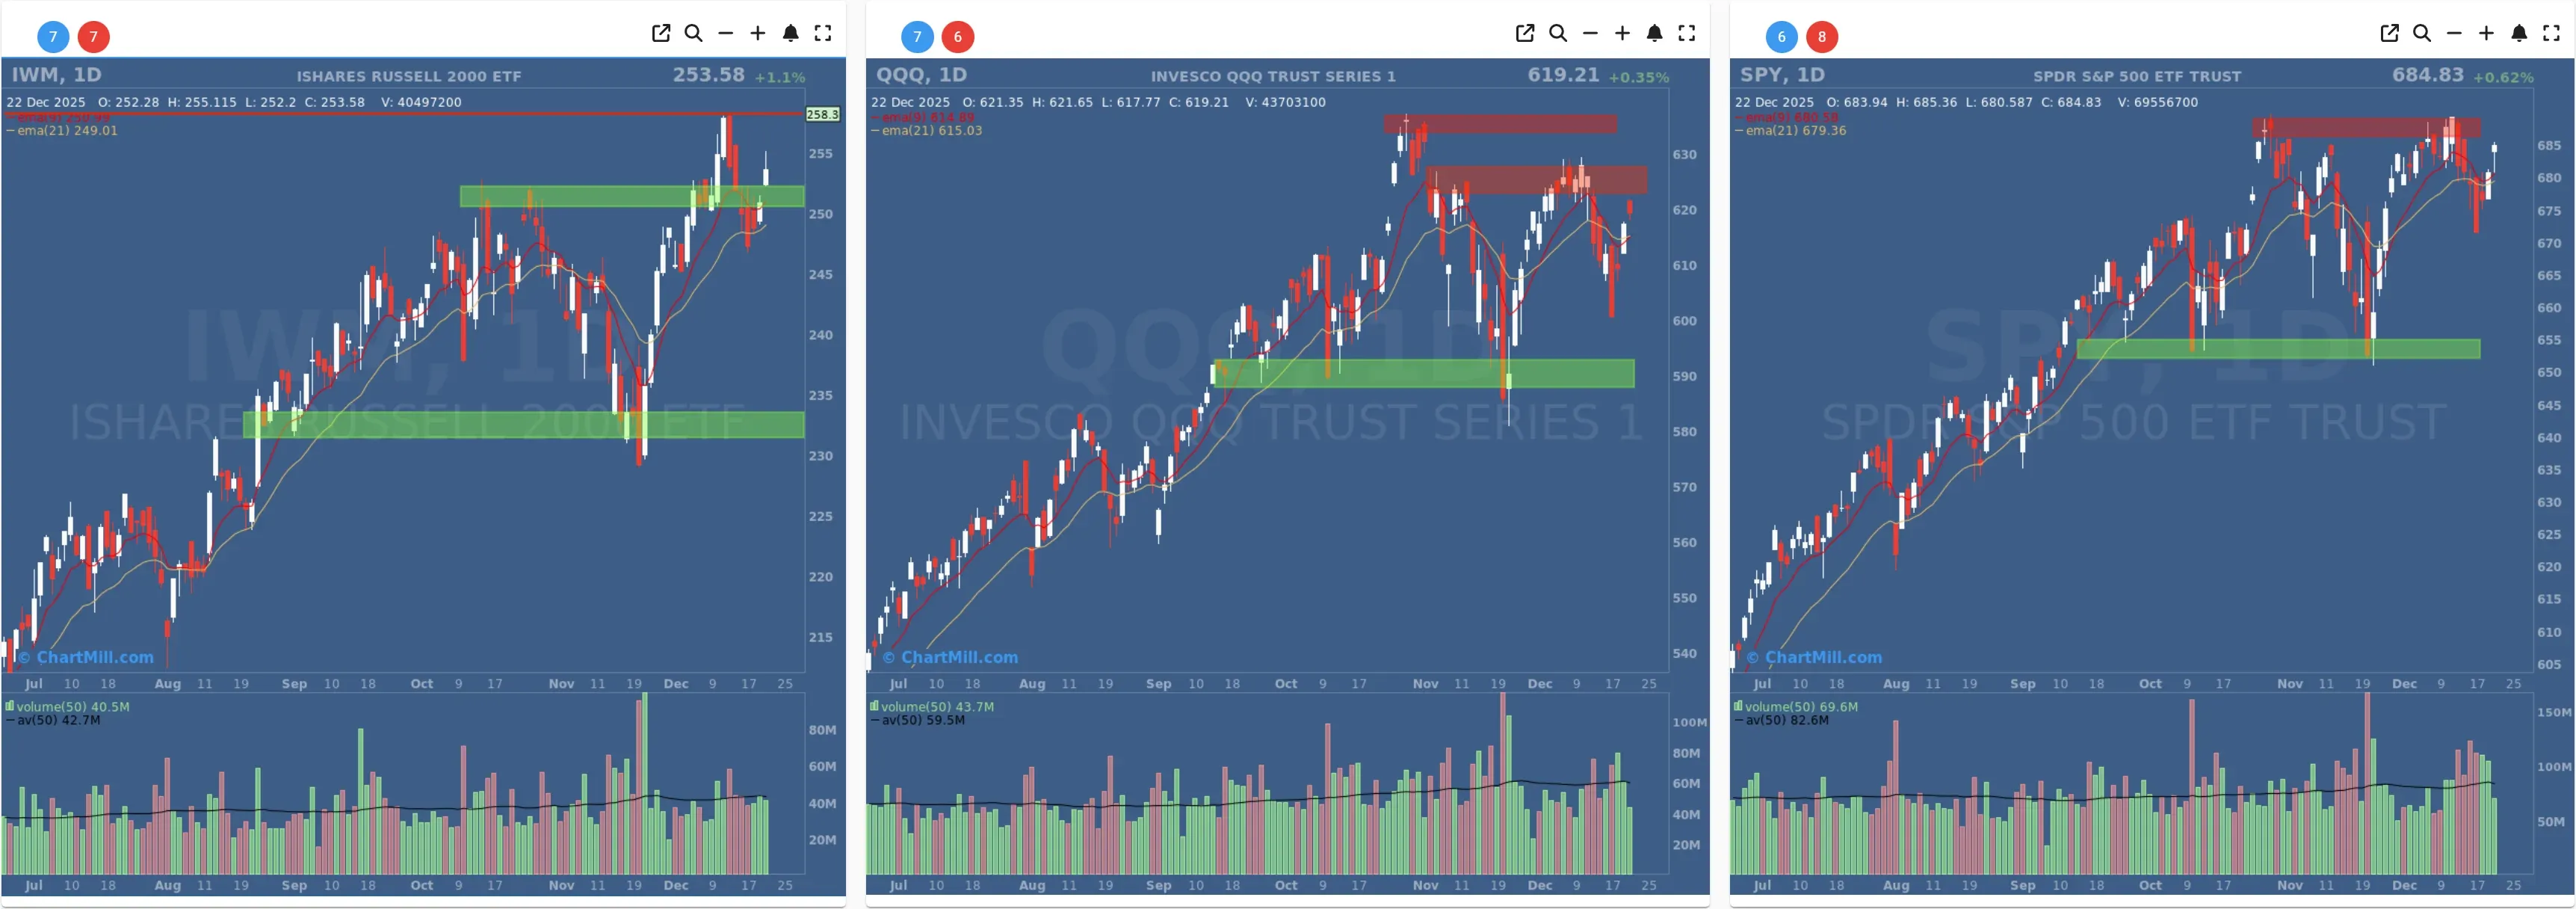
Daily: SPY continues to act constructively, holding above both EMA9 and EMA21 and pressing into a well-defined overhead resistance zone. The pullbacks have been contained, and the trend structure remains intact.
Weekly: The long-term picture is still positive (ChartMill Trend Indicator / rising 30-week EMA). SPY is behaving like a market that wants to grind higher, but is doing so while repeatedly “checking” supply near the highs.
Takeaway: Still the steadiest of the three, trend is up, but upside progress is currently incremental.
QQQ
Daily: QQQ is still range-bound near the highs, but importantly remains capped by overhead resistance. Also worth noting (as observed in the prior update): the EMA9 has been below the EMA21, reinforcing that momentum is more fragile here than in SPY. Price is holding up, but the tape is choppier and more selective.
Weekly: Long-term trend remains positive, yet the recent hesitation near resistance stands out—this is where you’d ideally want to see clean continuation, not repeated stalling.
Takeaway: Tech remains the “watch item.” It’s not breaking down, but it’s also not leading with authority right now.
IWM
Daily: IWM put in a stronger day and continues to trade above rising EMA9/EMA21, pushing back toward the upper end of its range near prior highs/resistance.
Weekly: The long-term trend is positive, and small caps are acting like they want to participate again after earlier shakiness.
Takeaway: Small caps improved and helped the breadth picture, constructive if this follow-through persists.
Market breadth indicators (Dec 22 vs Dec 19)
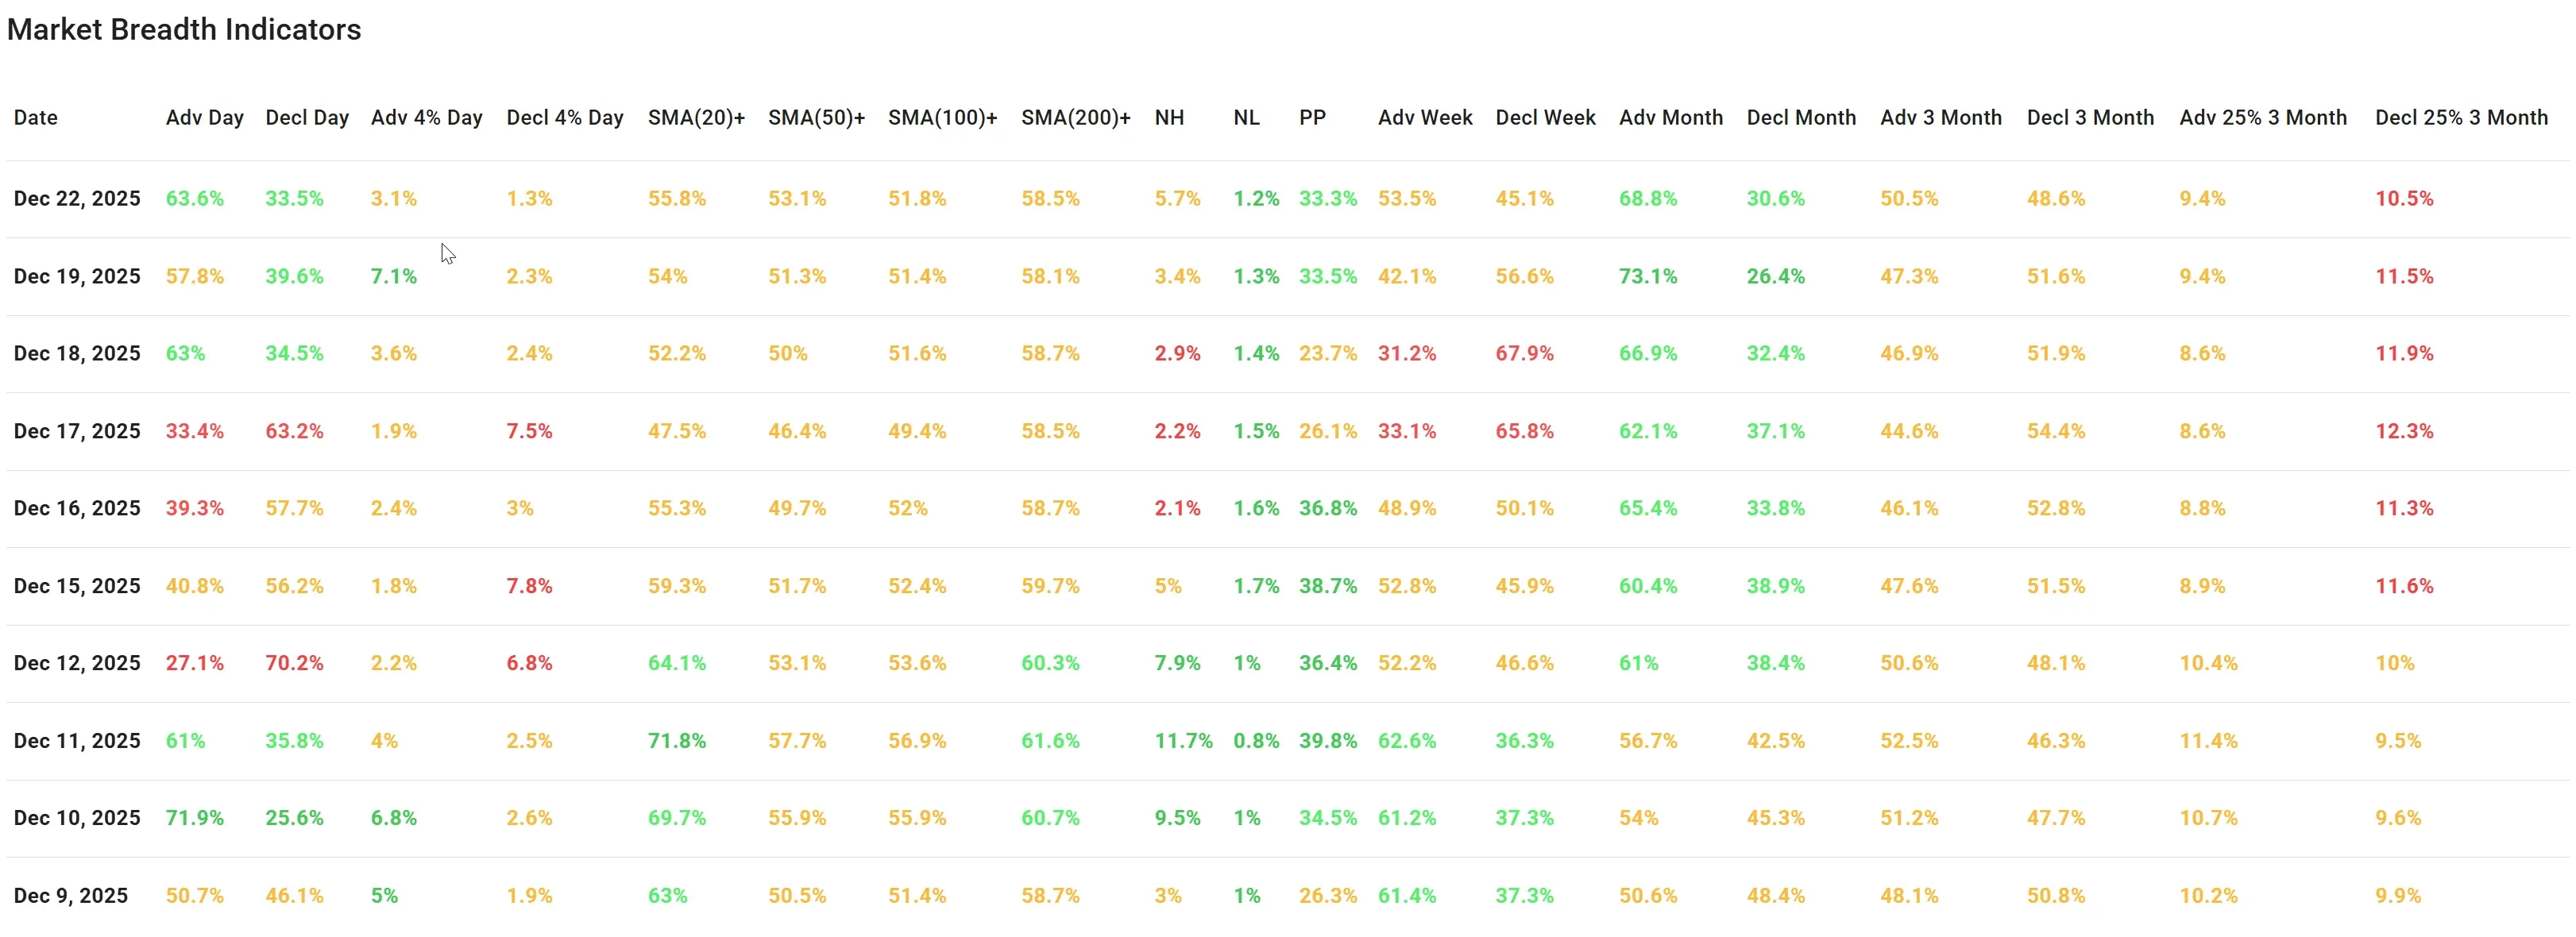
Daily breadth improved meaningfully
-
Advancers: 63.6% (up from 57.8%)
-
Decliners: 33.5% (down from 39.6%)
That’s a clean improvement versus Friday, more stocks moving forward, fewer moving backward.
Also notable: big movers cooled off versus Friday:
-
Adv +4%: 3.1% (down from 7.1%)
-
Decl -4%: 1.3% (down from 2.3%)
This suggests a more orderly up-day (less “panic snapback” and more steady accumulation).
Participation remains supportive, but not powerful
-
Above SMA(20): 55.8% (up from 54.0%)
-
Above SMA(50): 53.1% (up from 51.3%)
-
Above SMA(100): 51.8% (slightly up from 51.4%)
-
Above SMA(200): 58.5% (up from 58.1%)
The market is still more healthy than not (most metrics stay above 50%), but it’s not screaming “broad momentum surge.” This aligns well with what we see on the index charts: uptrends, but with resistance overhead and selective leadership.
New highs/new lows: improving, but not a breakout wave
-
New Highs: 5.7% (up from 3.4%)
-
New Lows: 1.2% (slightly down from 1.3%)
This is a constructive shift - more stocks are stretching to fresh highs while new lows remain contained - but it’s still not the type of “new-high expansion” that usually accompanies a major breakout phase.
Weekly breadth flipped back to the good side
This is the biggest change versus the prior update:
-
Adv Week: 53.5% (up sharply from 42.1%)
-
Decl Week: 45.1% (down from 56.6%)
Friday’s weekly stats leaned negative; Monday repaired that damage quickly. If this holds, it reduces the odds that last week’s weakness morphs into a bigger rollover.
Medium-term trend still mixed—but improving
-
Adv Month: 68.8% (still strong, though down from 73.1%)
-
Decl Month: 30.6% (up from 26.4%)
Monthly breadth remains firmly constructive, even if it’s slightly less one-sided than Friday.
-
Adv 3 Month: 50.5% (up from 47.3%)
-
Decl 3 Month: 48.6% (down from 51.6%)
This basically moved from “slightly negative” back toward neutral.
And the bigger swings over 3 months:
-
Adv +25% (3M): 9.4% (unchanged)
-
Decl -25% (3M): 10.5% (improved from 11.5%)
We still have more big decliners than big advancers, which is one reason this isn’t a “very positive” breadth regime, but that downside pressure is easing.
Bottom line
Monday delivered a clear short-term breadth rebound, and importantly, the weekly breadth picture repaired itself after Friday’s weaker tilt. Participation above key moving averages remains modestly positive (low-to-mid 50s), matching what the index charts show: uptrends under resistance, with QQQ lagging and IWM improving.
This is a market that’s repairing and stabilizing, not one that’s already in a broad-based acceleration phase.
Breadth trend rating
neutral, positive bias

Breadth is improving and the longer-term trend backdrop is still supportive, but leadership is not fully synchronized (QQQ still the “messy” one) and the intermediate thrust metrics aren’t yet strong enough for a higher reading.
Kristoff
Next to read: Alphabet’s Power Grab Keeps the Santa Rally Plugged In