

(All data & visualisations by ChartMill.com)
Daily Market Trend Analysis – September 02, 2025 (After Market Close)
Gap down moves with negative closing, despite the late recovery movement for the three US index ETFs
Short Term Trend
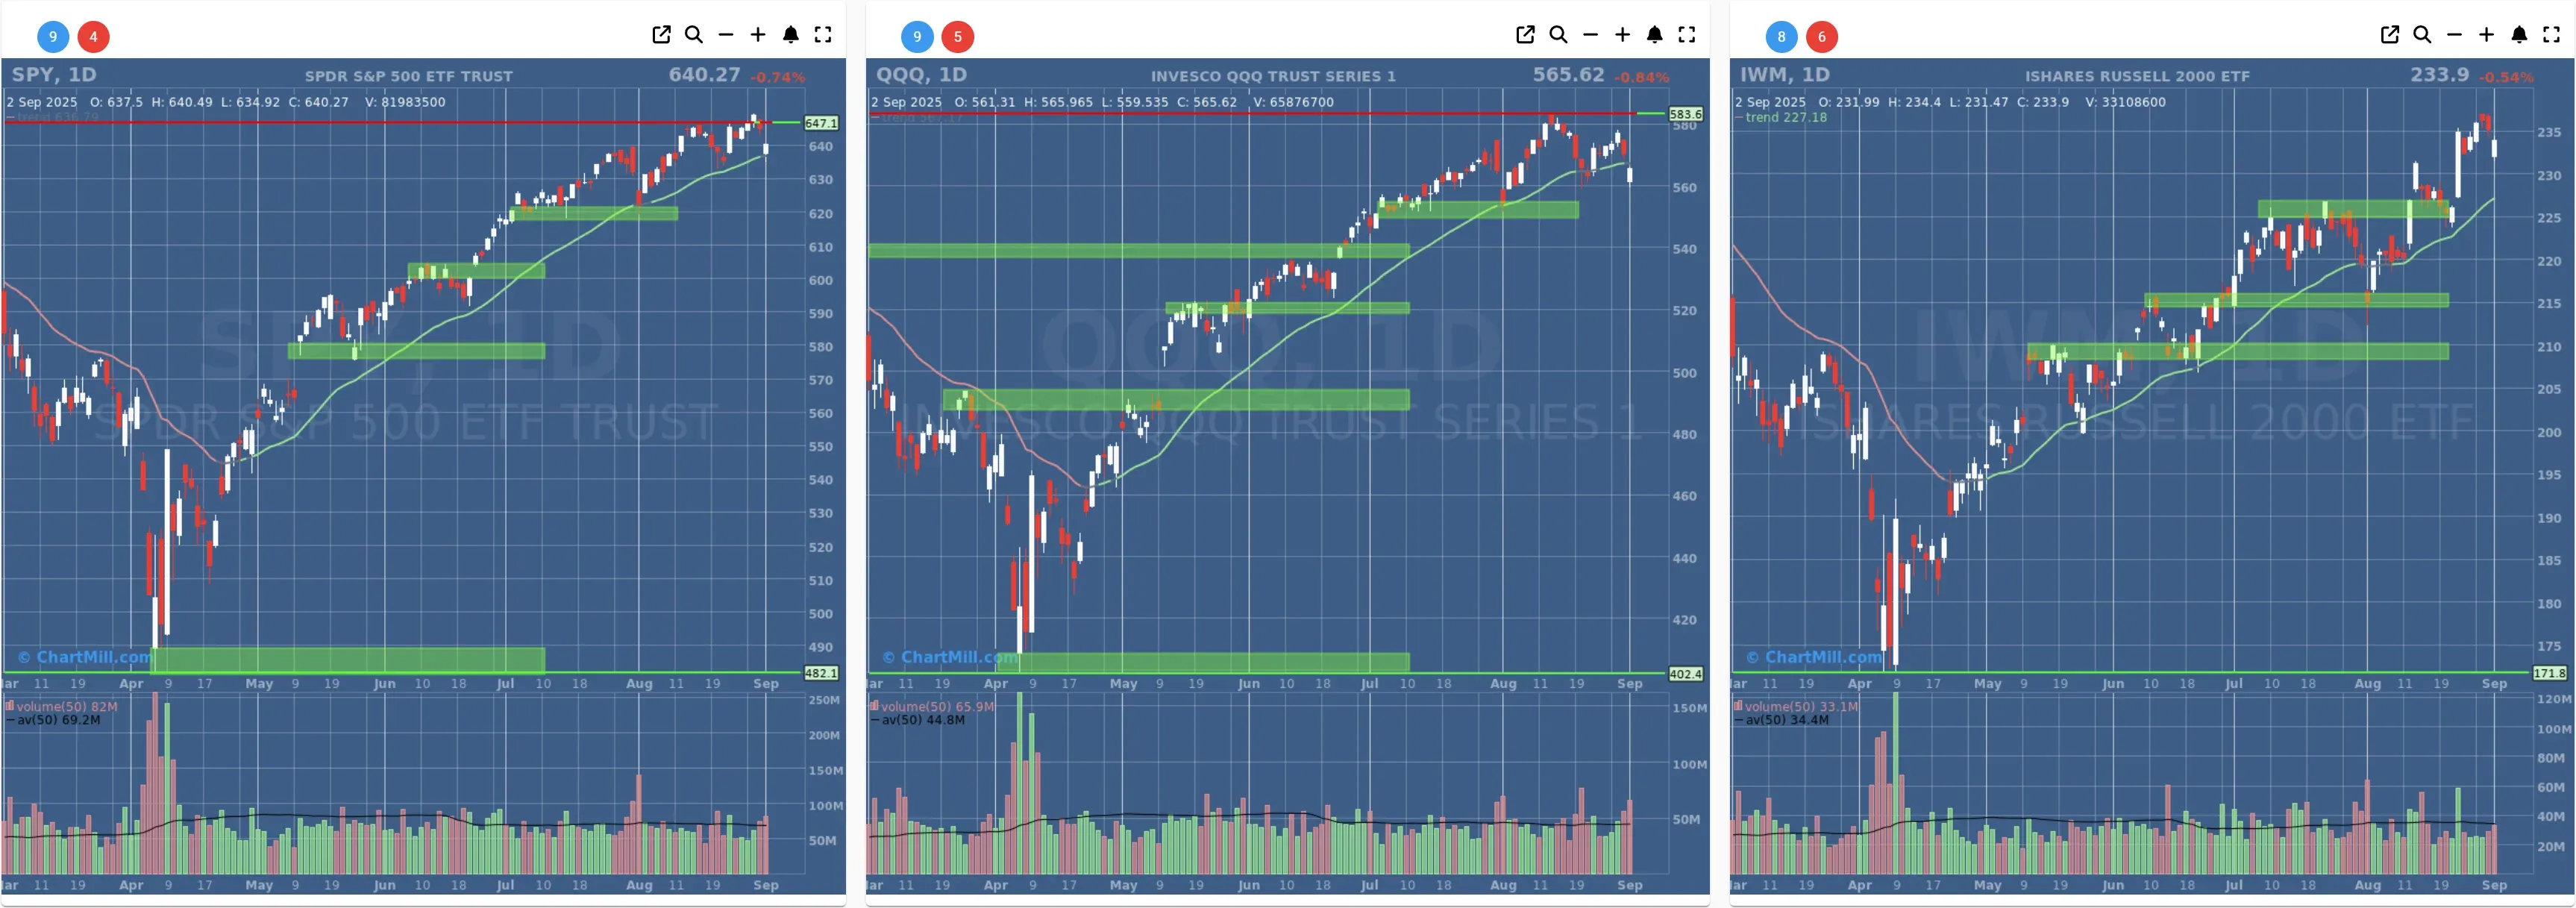
- Short-Term Trend: CHANGE - Neutral (from Positive)
- Next Support at $640 - $620
- Next Resistance at $650
- Volume: Slightly Above Average (50)
- Pattern: Down Day - Gap Down
- Short-Term Trend: CHANGE - Neutral (from Positive)
- Next Support at $560
- Next Resistance at $583
- Volume: Well Above Average (50)
- Pattern: Down Day - Gap Down
- Short-Term Trend: Positive (no change)
- Next Support at $225 - $230
- Next Resistance at $237
- Volume: At Average (50)
- Pattern: Down Day - Gap Down
Long Term Trend

- Long-Term Trend: Positive (no change)
- Long-Term Trend: Positive (no change)
- Long-Term Trend: Positive (from neutral)
Daily Market Breadth Analysis – September 02, 2025 (After Market Close)
After a brief recovery late last week, advancing stocks lost ground again on Tuesday, pushing breadth indicators back into weaker territory.
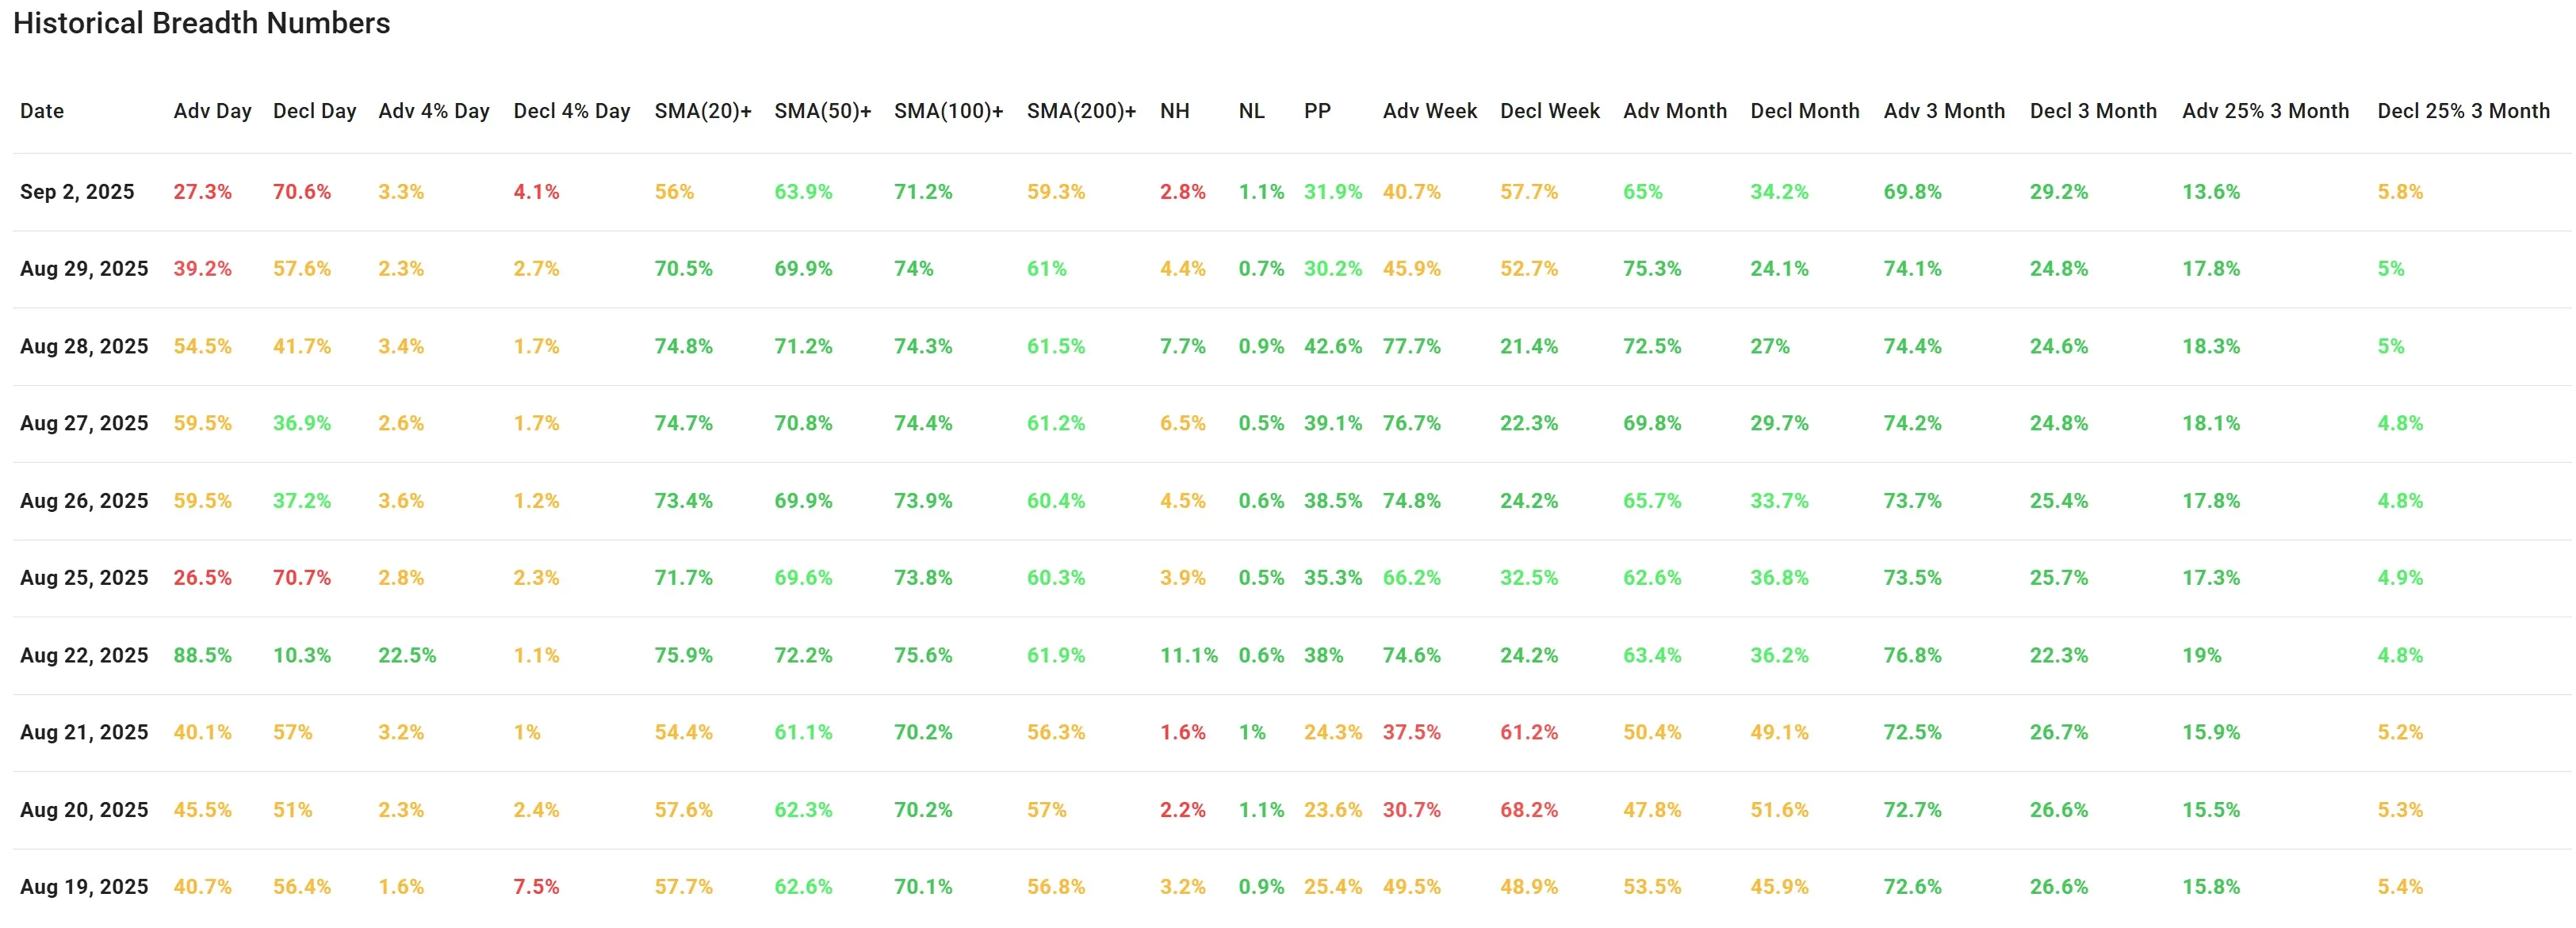
Market breadth slipped notably on September 2, 2025, with just 27.3% of stocks advancing against 70.6% declining.
This marks a sharp deterioration from Friday’s more balanced session (39.2% advancers), and resembles the weak structure seen on August 25. The number of new highs fell to 2.8%, while new lows stayed modest at 1.1%, suggesting limited leadership at the top.
Short-term momentum clearly faltered: only 56% of stocks remain above their 20-day SMA, down sharply from nearly 75% just a week ago.
While the 50-, 100-, and 200-day readings (63.9%, 71.2%, and 59.3% respectively) still show longer-term support, the steady erosion at the shorter time frames hints at increasing fragility.
Forward-looking indicators turned less favorable as well. The weekly advance/decline balance slipped to 40.7% vs. 57.7% decliners, a noticeable reversal compared to last week’s strong weekly breadth.
Monthly and 3-month measures still lean constructive, but they are gradually softening, particularly on the monthly side where advancing breadth fell back to 65% from over 75% at the end of August.
Compared with the previous breadth update, the data confirm that Friday’s bounce was only temporary. Weakness has reasserted itself, especially at the short-term level, with fewer stocks managing to hold above their faster-moving averages.
The underlying trend is therefore tilting back toward the negative side.
Current breadth trend rating: 2 (negative).

Kristoff - ChartMill
Next to read: Market Monitor News, September 03 BMO