
Major index ETFs are still pressing into overhead resistance with intact uptrends, but today’s session showed a clear participation hiccup: decliners outweighed advancers and new highs cooled meaningfully. Weekly/monthly breadth remains supportive, yet the short-term tape is starting to look more selective.
Index overview (SPY, QQQ, IWM)
Short Term (Daily)
Long Term (Weekly)

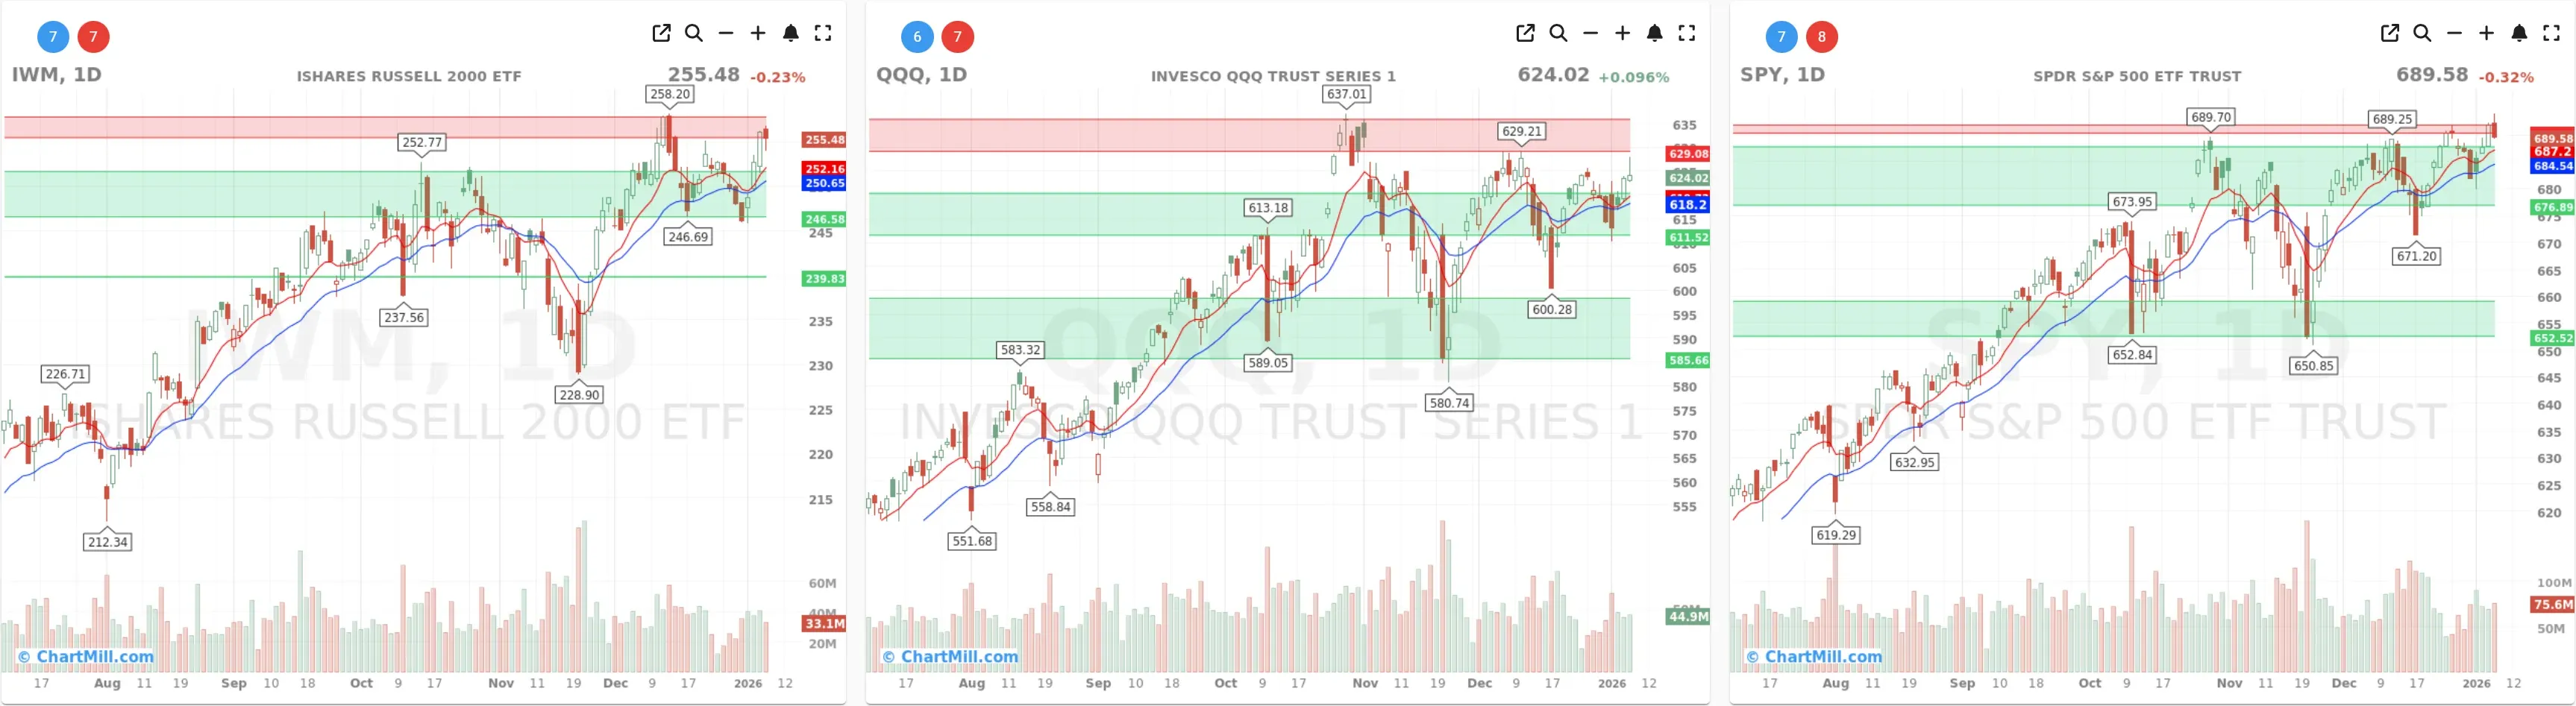
SPY
Weekly trend: Still firmly positive and grinding higher into the upper resistance zone.
Daily action: Slightly lower on the day, but price is still holding near the 689–690 area, i.e. right under/into resistance.
Takeaway: Trend remains up, but the market is trying to push through a ceiling—this often coincides with more “mixed” breadth.
QQQ
Weekly trend: Uptrend intact, but QQQ is also pressing into resistance (recent prior high area).
Daily action: Essentially flat-to-slightly up, holding above the short-term EMA structure.
Takeaway: QQQ stability helped keep the broader tape from looking worse, but today’s breadth suggests leadership is carrying more weight than the average stock.
IWM
Weekly trend: Constructive and still rising, now fully in the upper resistance band.
Daily action: Mild pullback while still holding the short-term trend support.
Takeaway: Small caps remain in good shape structurally, but they didn’t contribute to breadth today.
Breadth dashboard (latest: Wed Jan 7, after close)
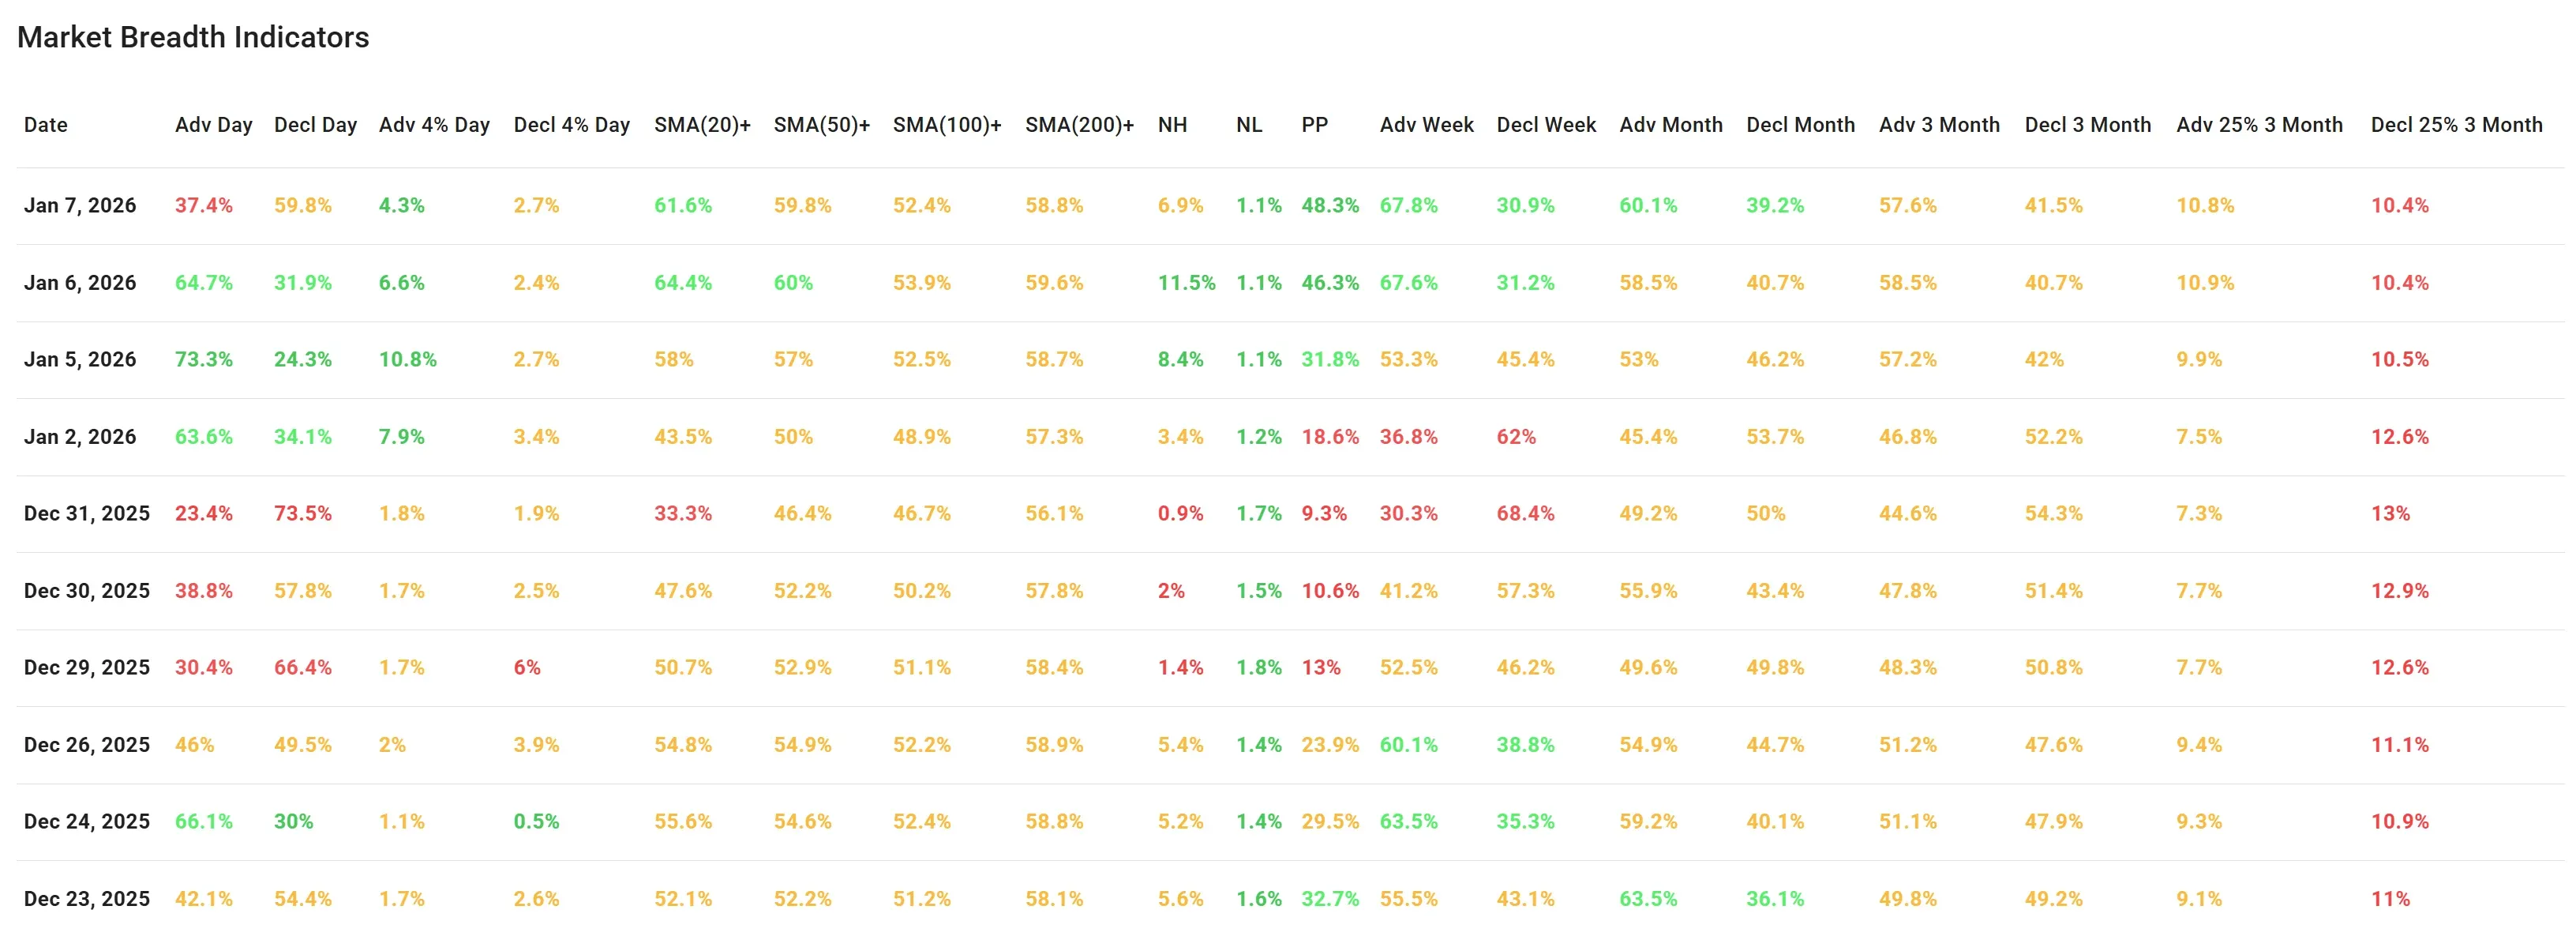
Daily breadth: a sharp stumble versus yesterday
-
Advancers vs decliners: 37.4% adv vs 59.8% decl (a major reversal from Jan 6’s strong advancer day).
-
Big movers (±4%): 4.3% adv vs 2.7% decl → still more upside movers than downside movers, but less punch than yesterday.
-
New Highs / New Lows: NH 6.9% (down from 11.5%), NL 1.1% (stable/low).
Interpretation: fewer breakouts, but importantly no surge in breakdowns.
What changed vs Jan 6?
Yesterday looked like broad follow-through. Today looks like rotation/profit-taking while indexes stayed near highs, classic “index strength, average stock softer” behavior.
Trend health: still more green than red
% above key averages:
-
SMA(20)+: 61.6%
-
SMA(50)+: 59.8%
-
SMA(100)+: 52.4%
-
SMA(200)+: 58.8%
This is still a constructive backdrop: a majority of stocks remain above short- and medium-term trend gauges, and the long-term baseline (SMA200+) is holding near ~59%.
Multi-day participation: weekly/monthly remain supportive
-
Weekly: Adv Week 67.8% vs Decl Week 30.9% → strong.
-
Monthly: Adv Month 60.1% vs Decl Month 39.2% → improving.
-
3-Month: Adv 3M 57.6% vs Decl 3M 41.5% → still positive, slightly less than yesterday.
-
Deep drawdowns (25% over 3M): Adv 10.8% vs Decl 10.4% → still elevated on the “damage” side, but not worsening.
Bottom line: Today’s weakness is not (yet) showing up as accelerating longer-term deterioration. It’s more consistent with a short-term pause while the market tests resistance.
What I’m watching next
If breadth re-accelerates: you’d want to see advancers back above ~55–60% and new highs rebound, confirming the breakout attempts in SPY/QQQ/IWM.
If this turns into distribution: watch for NL to lift from the current ~1% area and for SMA(20)+ / SMA(50)+ to start rolling over (that’s when “selective” becomes “broadly risk-off”).
Breadth trend rating:
Rating: Neutral, with a positive bias.

The market’s structure remains constructive (most stocks still above key moving averages; strong weekly and monthly participation), but today’s daily breadth reversal and the drop in new highs are a reminder that we’re pushing into resistance and the rally is becoming more selective.
Kristoff
Next to read: Alphabet Steals Apple’s Crown as Yields Ease and Politics Hits Defense