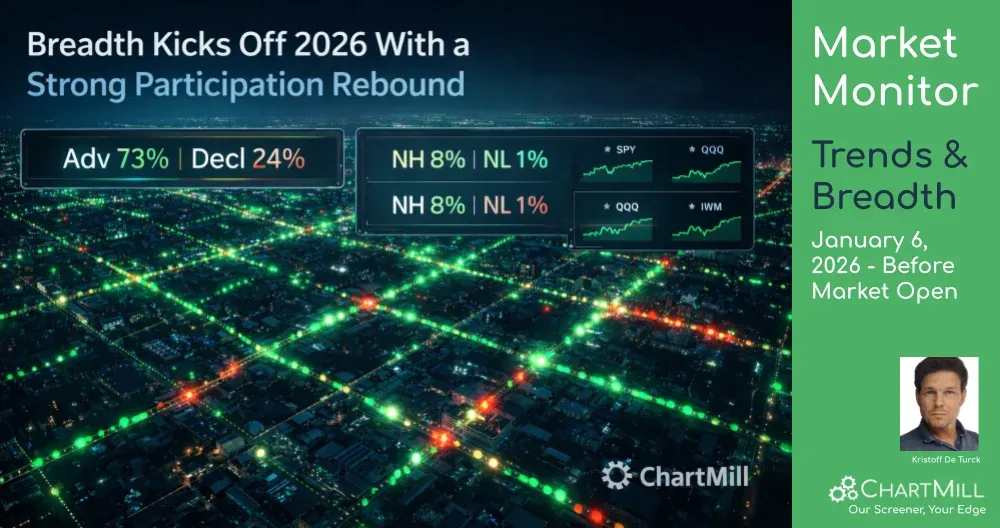
U.S. indexes ended Monday higher and remain structurally bullish on the weekly timeframe, while breadth improved sharply versus Friday. The key change is participation: more stocks advanced, more pushed above short-term trend measures, and new highs expanded meaningfully, a constructive start to the new week, with the usual caveat that indexes are still pressing into nearby resistance zones.
Index overview (SPY, QQQ, IWM)
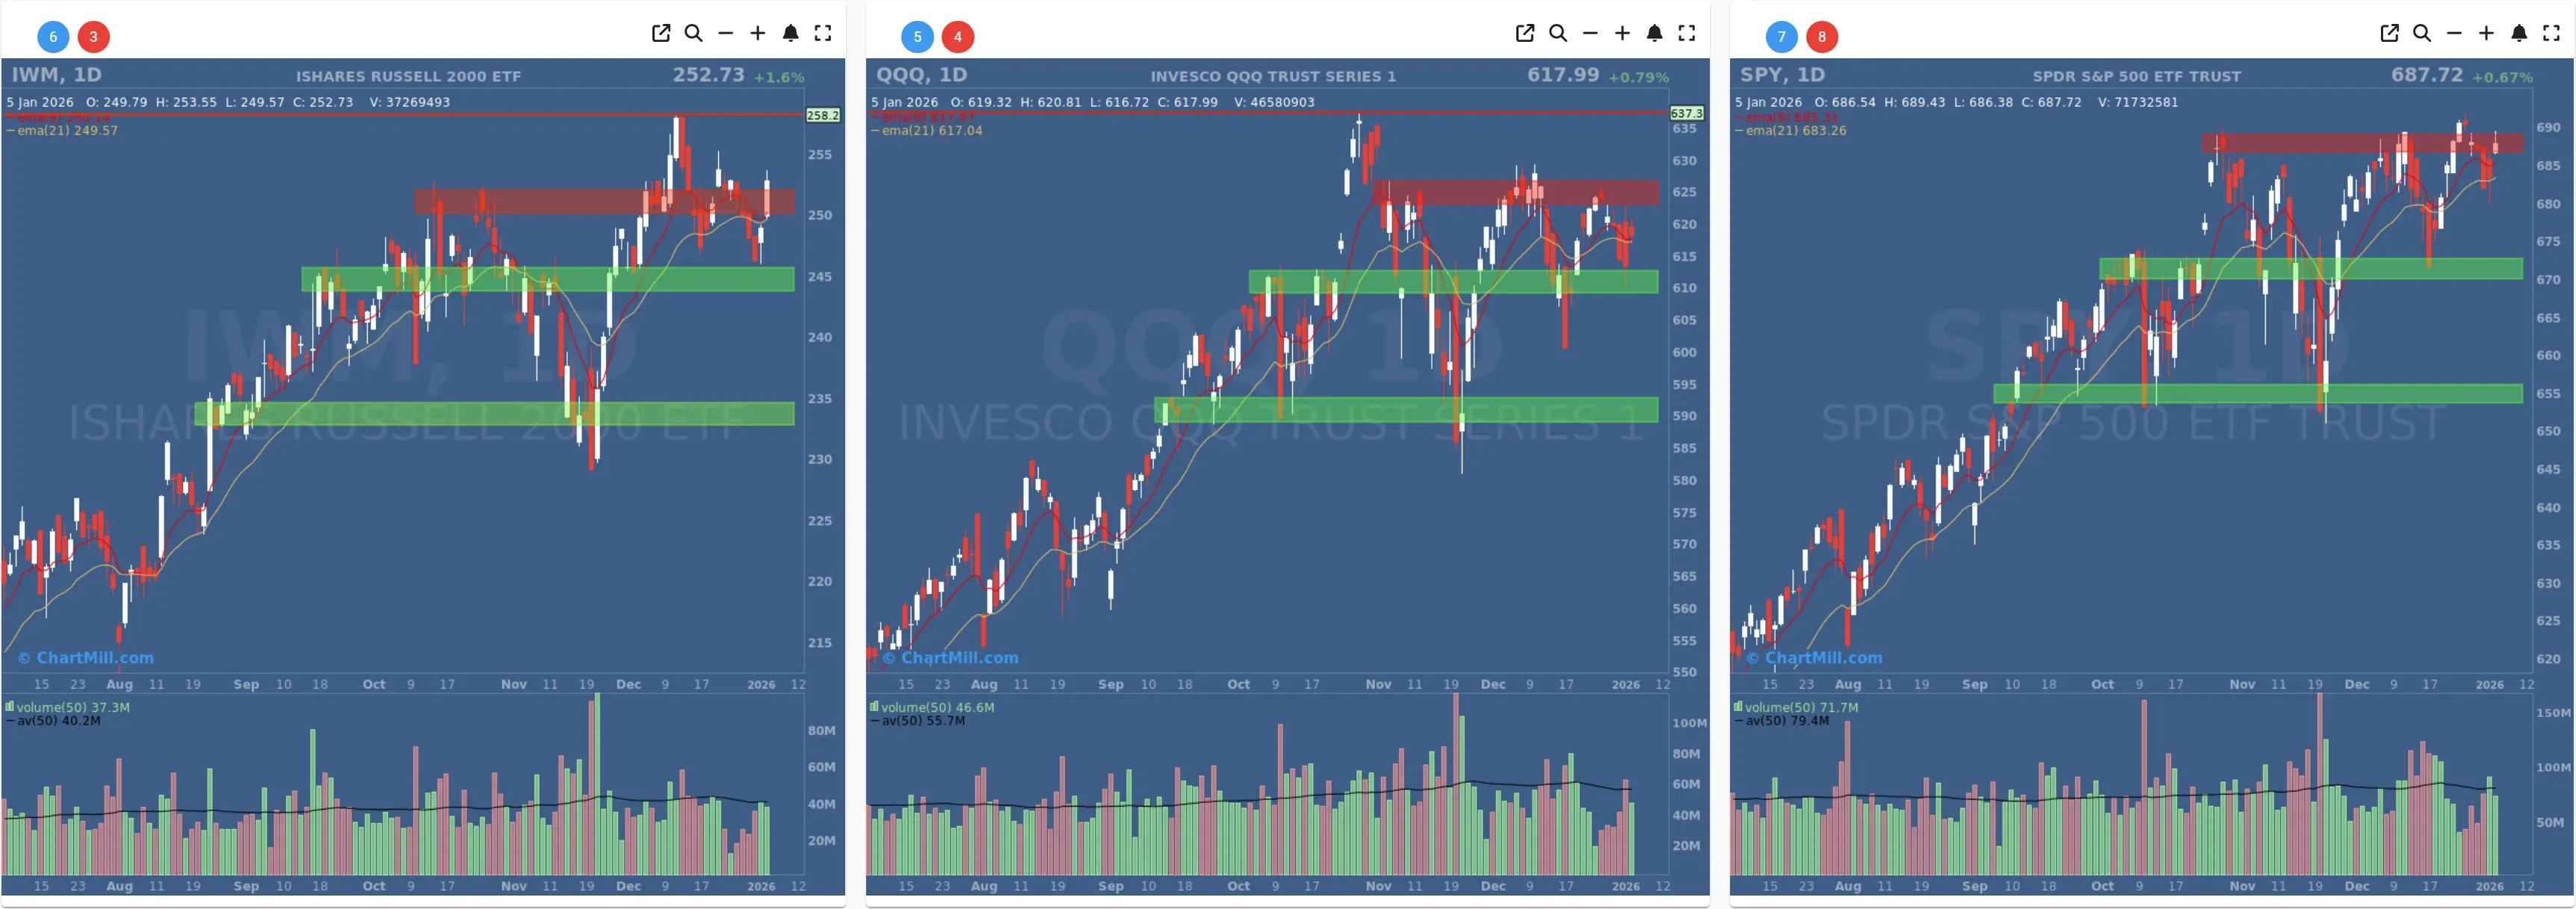
Short Term (Daily)
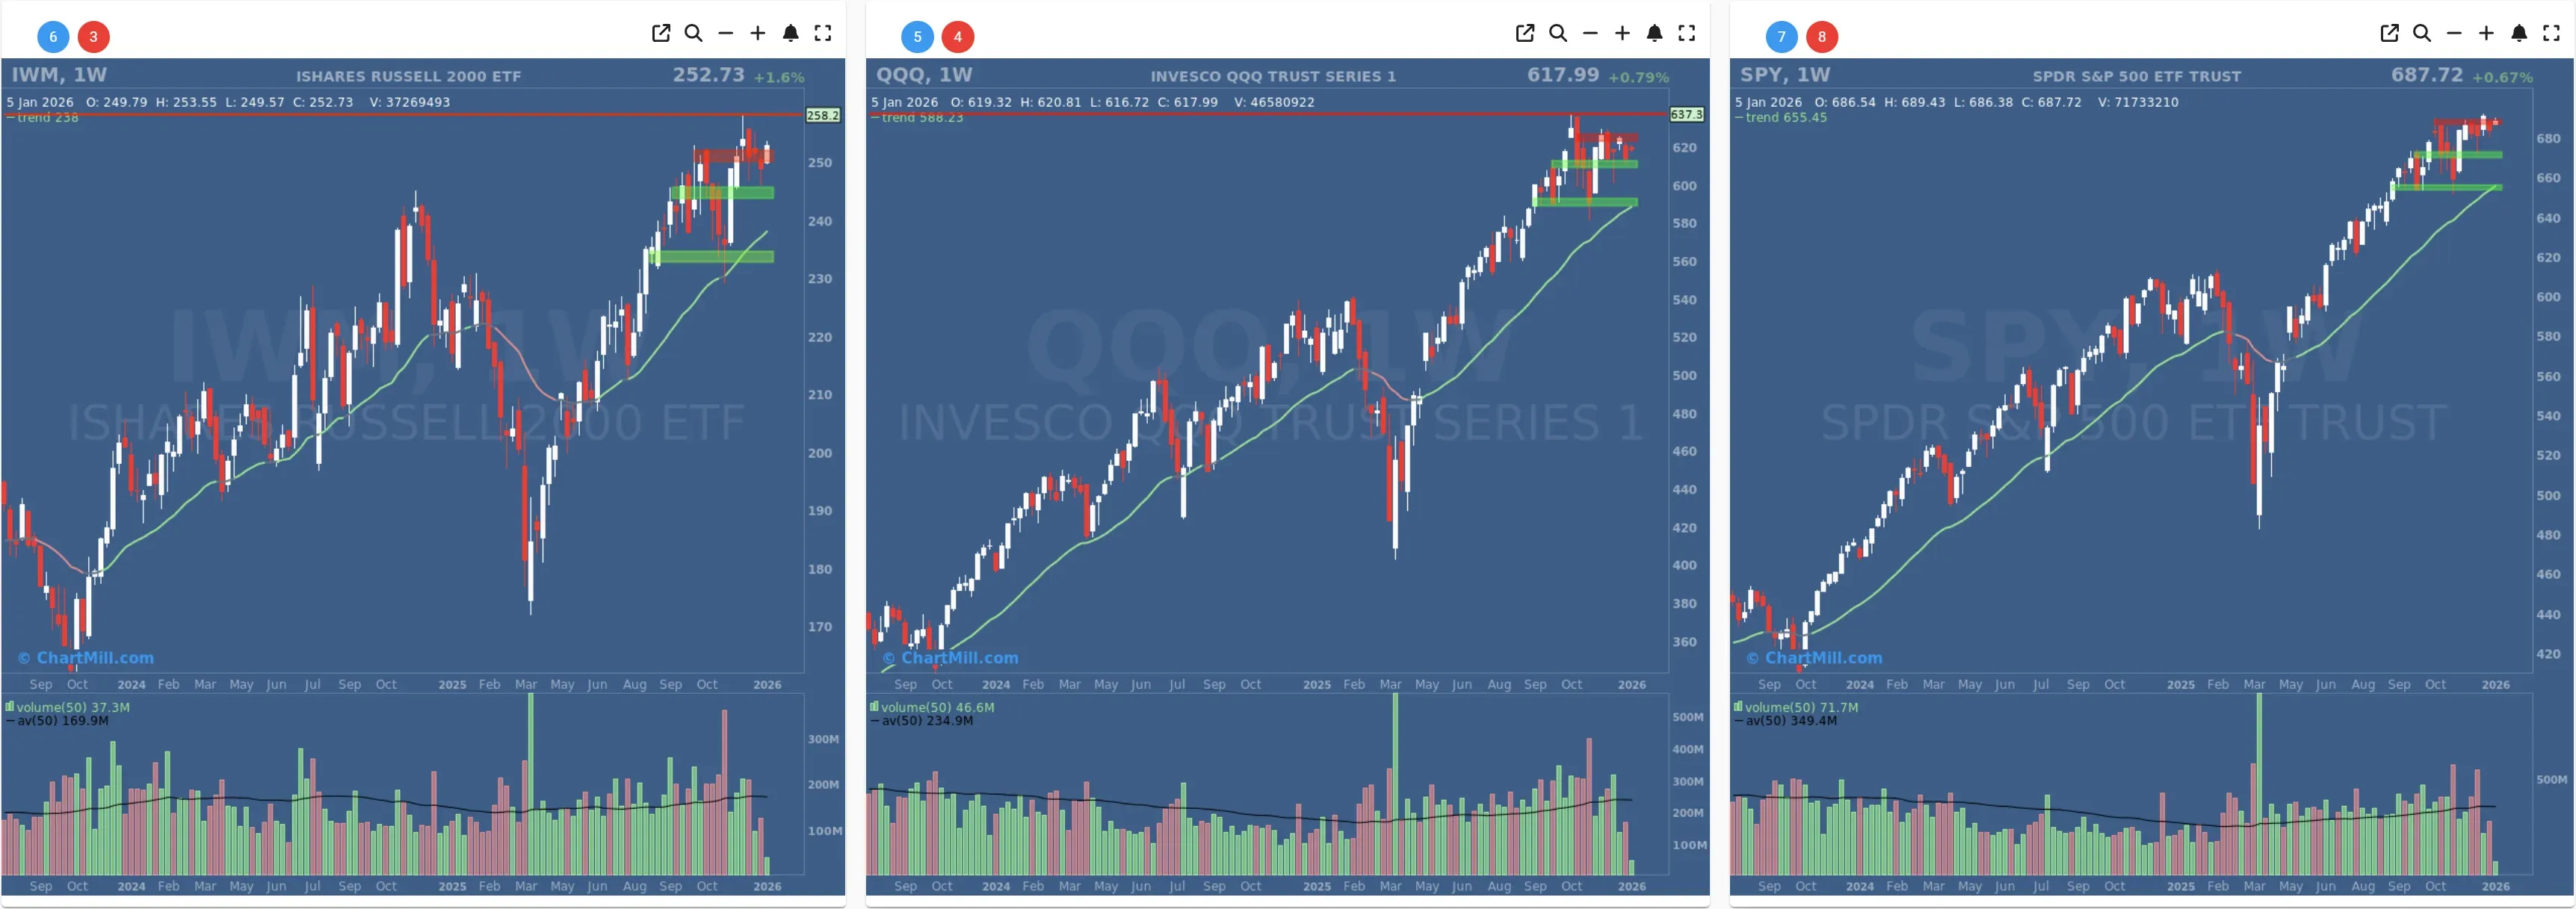
Long Term (Weekly)
SPY
Daily: Price continues to respect its rising EMA structure and is pressing into the upper supply band around the 685–690 area. The green support zone near ~670 remains the level that keeps this pullback/rebound sequence constructive. As long as price holds above the EMA21 and that support shelf, this looks like consolidation near highs rather than distribution.
Weekly: The ChartMill Trend Indicator (30-week EMA) is rising (green/positive trend) and price is well above it. The market remains in a long-term uptrend, but the chart also shows “late-stage” behavior: strong trend, yet increasingly dependent on defending pullbacks quickly.
QQQ
Daily: QQQ bounced and closed higher, but it’s still working through a choppy zone with overhead supply near ~620–625+. The ~610 support area is the key “line in the sand.” The EMA zone is tight here, which usually means the next directional push matters more than the daily noise.
Weekly: Trend remains firmly positive (above a rising 30-week EMA). The pattern looks like a high-level consolidation after a strong run—bullish as long as support holds, but sensitive to failed breakouts near resistance.
IWM
Daily: IWM was the strongest of the three (+1.6%), pushing back into/through a key zone near ~250. It still faces overhead supply in the mid-250s, but the ability to reclaim that level quickly is a positive read for broad participation.
Weekly: Also in a positive long-term trend, and importantly, the small-cap chart suggests “catch-up” potential if the market mood stays constructive—this often aligns with improving breadth.
Takeaway: All three indexes remain bullish on the weekly view, and Monday’s action supports a “risk-on, but still near resistance” interpretation—exactly the environment where breadth confirmation matters.
Market breadth (Jan 5 close) — what changed vs. the prior update (Jan 2)
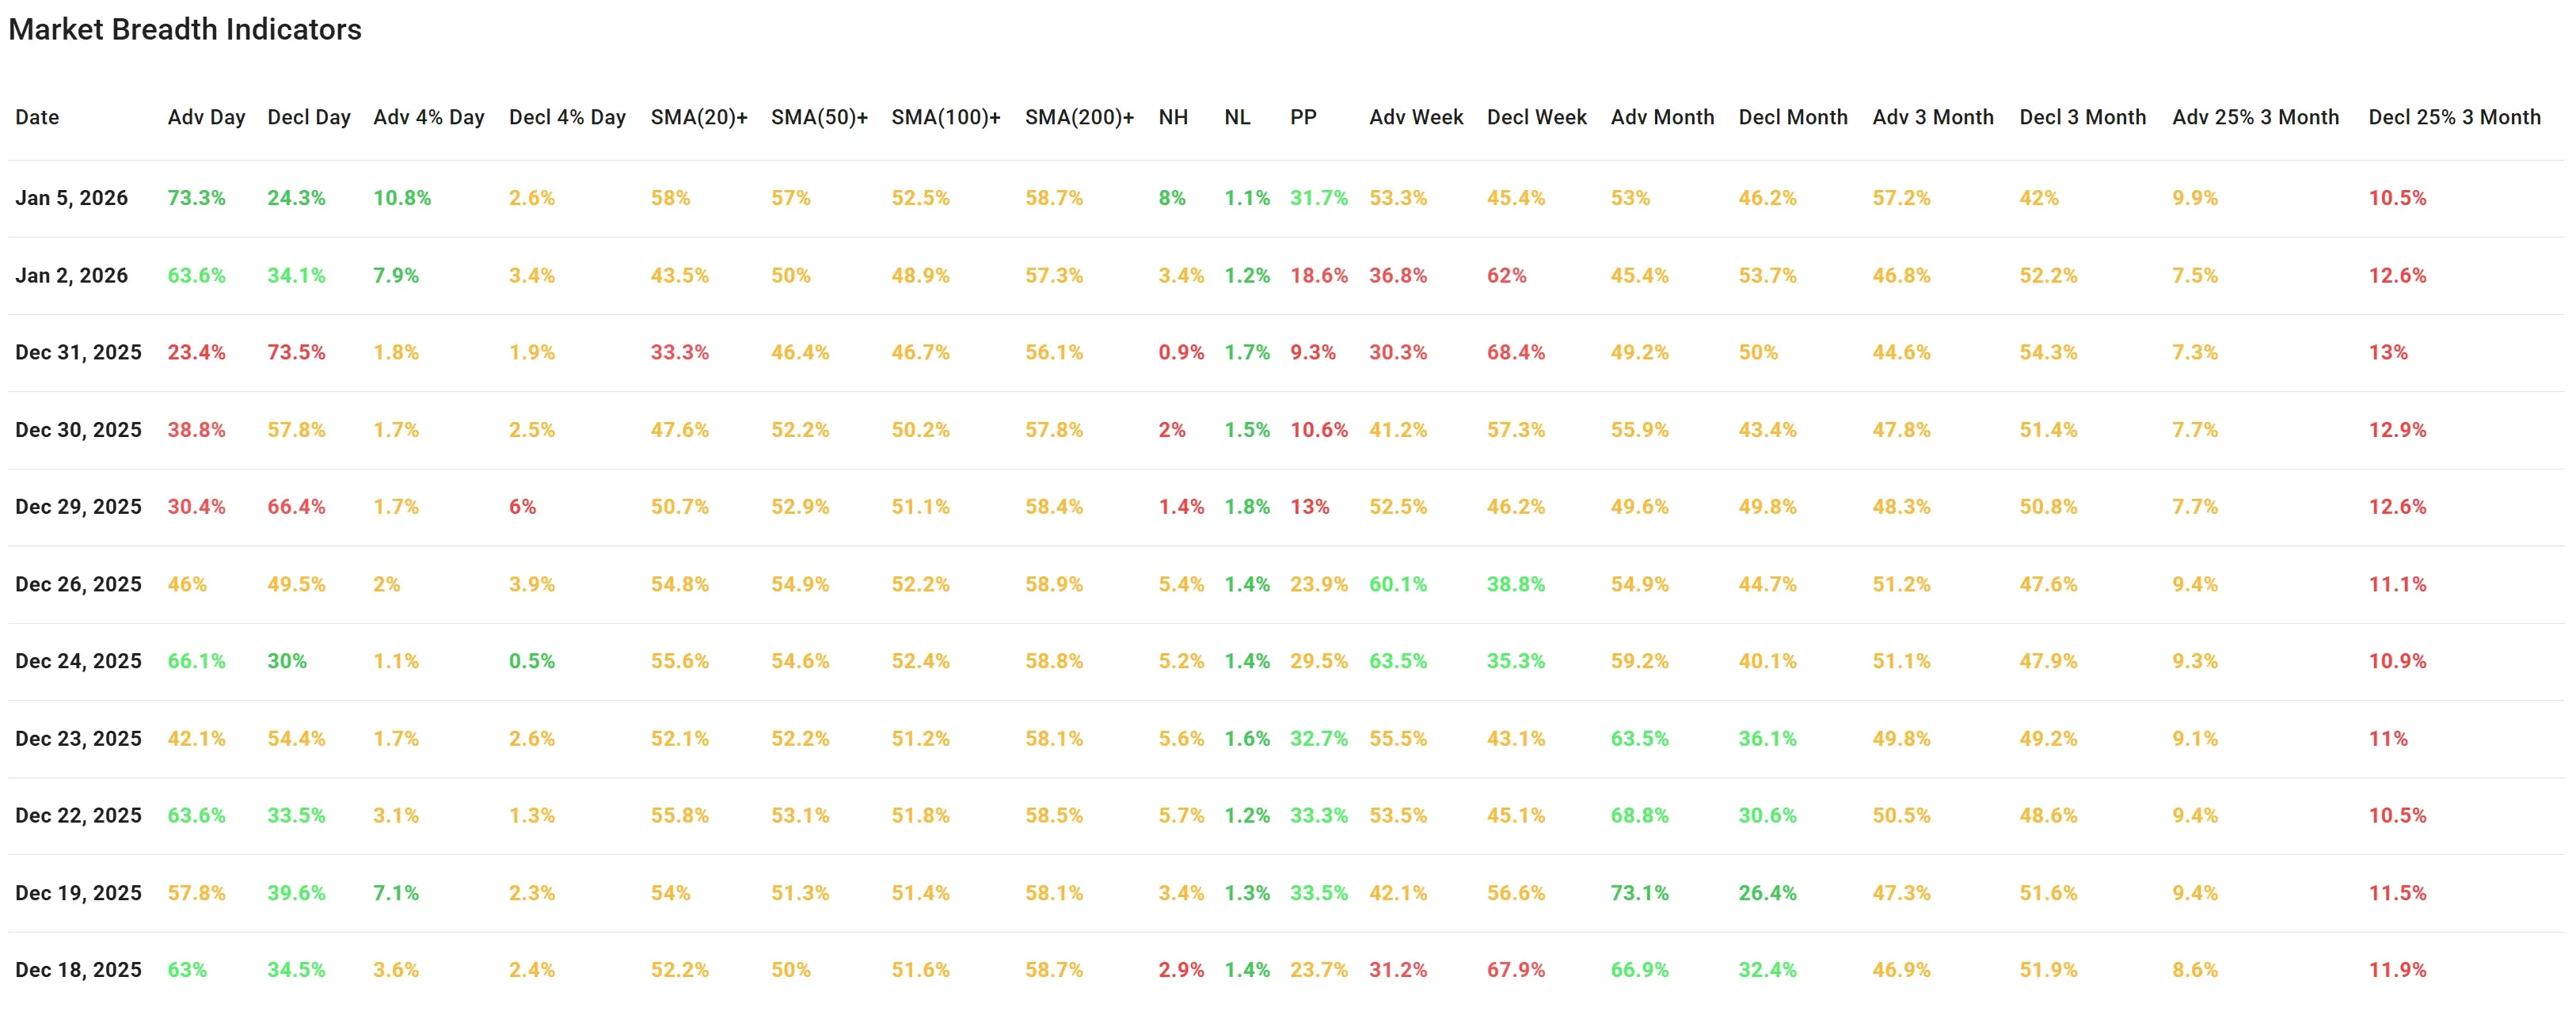
The day’s participation improved a lot
- Advancing stocks: 73.3% vs declining 24.3% → a strong positive skew.
- Big movers expanded on the upside: Adv +4%: 10.8% vs Decl -4%: 2.6%
That’s a meaningful shift toward upside momentum (and away from “air pockets”).
Why this matters: In the prior session (Jan 2), breadth was positive, but not this decisive. Monday’s surge is the kind of “breadth thrust” behavior you want to see when indexes are leaning into resistance.
Short-term trend participation snapped back
- % above SMA(20): 58% (up from 43.5% on Jan 2)
This is one of the most important improvements in today’s table: it suggests the late-December wobble is being repaired quickly across the list, not just in a handful of mega-caps.
The broader trend stack remains supportive too:
-
% above SMA(50): 57%
-
% above SMA(100): 52.5%
-
% above SMA(200): 58.7%
Interpretation: The market is not just “up today,” it’s rebuilding breadth above key moving averages, which tends to increase the odds that pullbacks stay buyable rather than turning into sustained damage.
New highs expanded (a constructive confirmation)
- New Highs (NH): 8% vs New Lows (NL): 1.1%
Compared with Jan 2 (NH 3.4%), this is a notable expansion in leaders pushing to fresh highs. When new highs broaden while new lows stay contained, it usually supports trend continuation, especially with SPY/QQQ already near their ceilings.
Weekly breadth flipped back to positive
- Adv Week: 53.3% vs Decl Week: 45.4%
On Jan 2, the weekly view was clearly negative (Decl Week 62%). That reversal matters: it suggests last week’s weakness didn’t “stick” and participation is stabilizing again.
##" Medium-term breadth is improving, but not perfectly clean
-
Adv Month: 53% vs Decl Month: 46.2% (slightly positive)
-
Adv 3-Month: 57.2% vs Decl 3-Month: 42% (clearly positive)
However, the “damage vs. strength” tails remain close:
-
Adv +25% (3M): 9.9%
-
Decl -25% (3M): 10.5%
Interpretation: The market is improving, but there are still pockets of meaningful drawdowns under the surface. That fits an environment where indexes can grind higher while leadership rotates and weaker groups lag.
What to watch next
Follow-through: The most important “tell” is whether SMA(20)+ stays above ~50% and whether NH stays elevated. Those are the metrics that usually separate a one-day pop from a durable push.
Resistance tests: SPY/QQQ are still pressing into overhead supply. If they fail those zones, breadth can cool quickly. If they break through with NH staying strong, odds tilt toward continuation.
Breadth trend rating
Rating: Positive
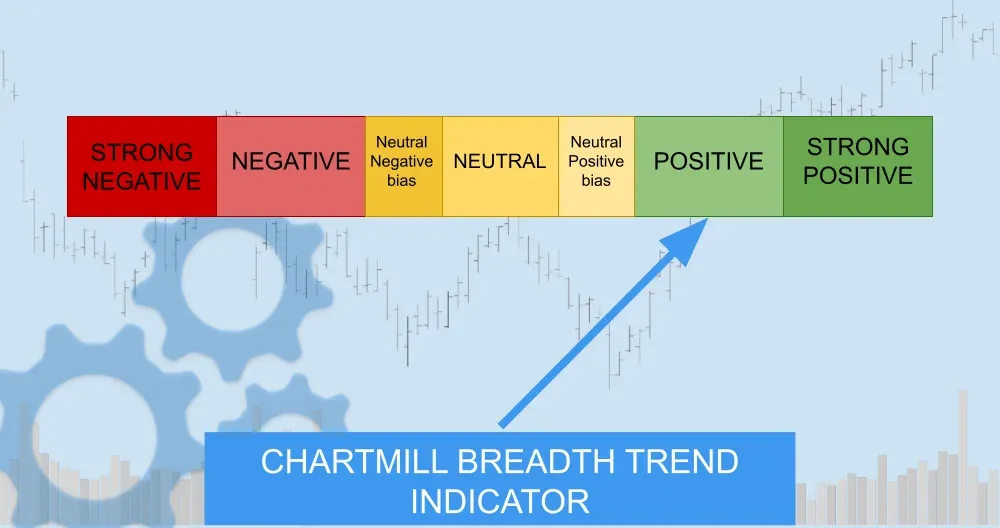
Participation strengthened sharply (especially the jump in SMA(20)+ and the expansion in new highs), and weekly breadth flipped back to the right side. The only reason this isn’t a “very positive” is that the market is still operating near clear resistance bands and the 3-month “tail” measures remain slightly mixed, so we want to see follow-through rather than assume it.
Kristoff
Next to read: Dow Flirts With 49K as Venezuela Shock Supercharges Energy