
U.S. indexes ended Monday higher and remain structurally bullish on the weekly timeframe, while breadth improved sharply versus Friday. The key change is participation: more stocks advanced, more pushed above short-term trend measures, and new highs expanded meaningfully, a constructive start to the new week, with the usual caveat that indexes are still pressing into nearby resistance zones.
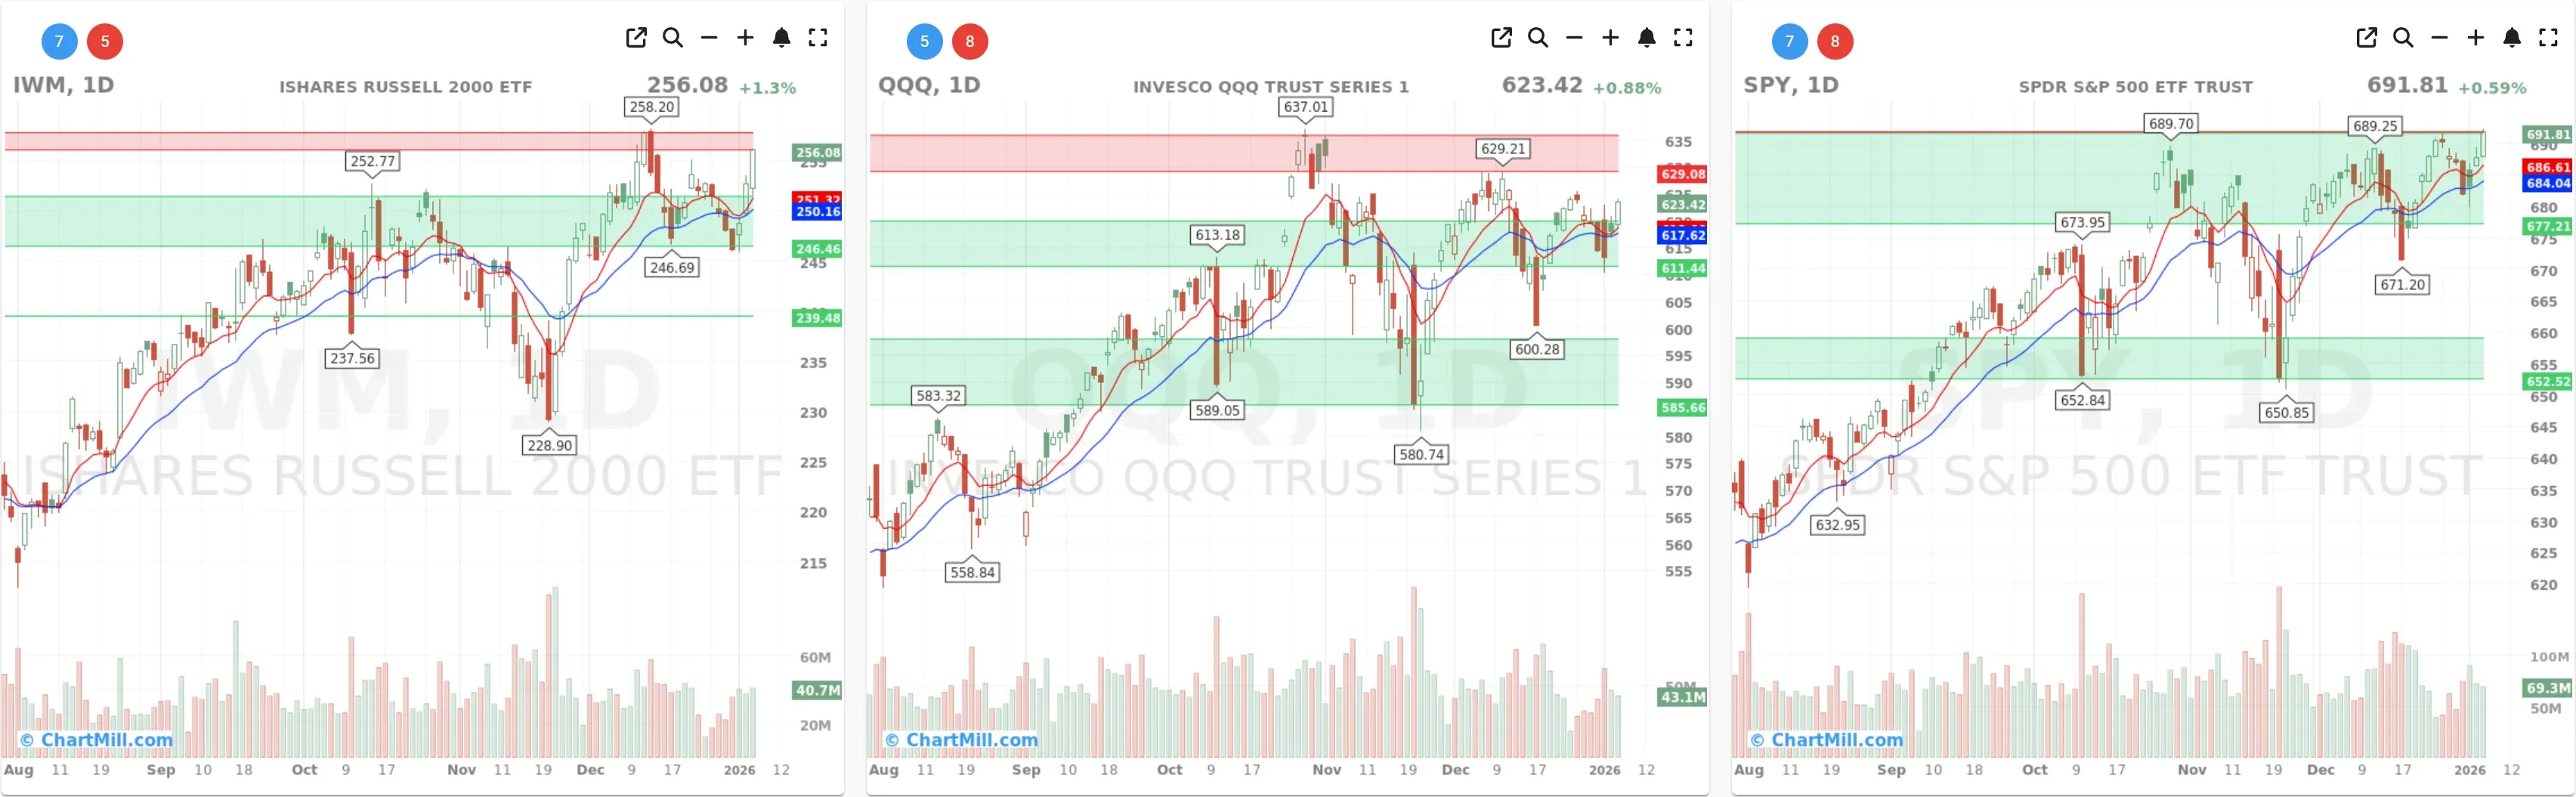
Index overview (SPY, QQQ, IWM)
Short Term (Daily)
Long Term (Weekly)

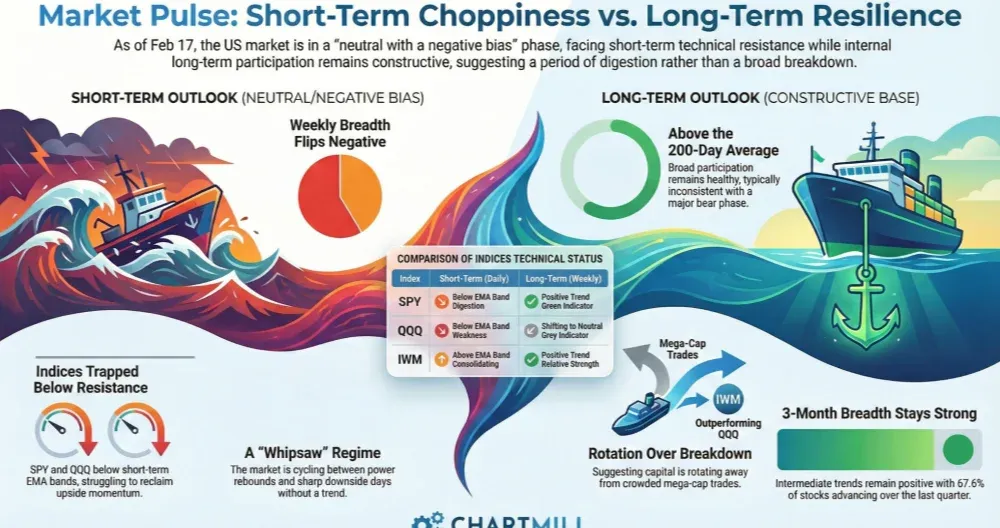
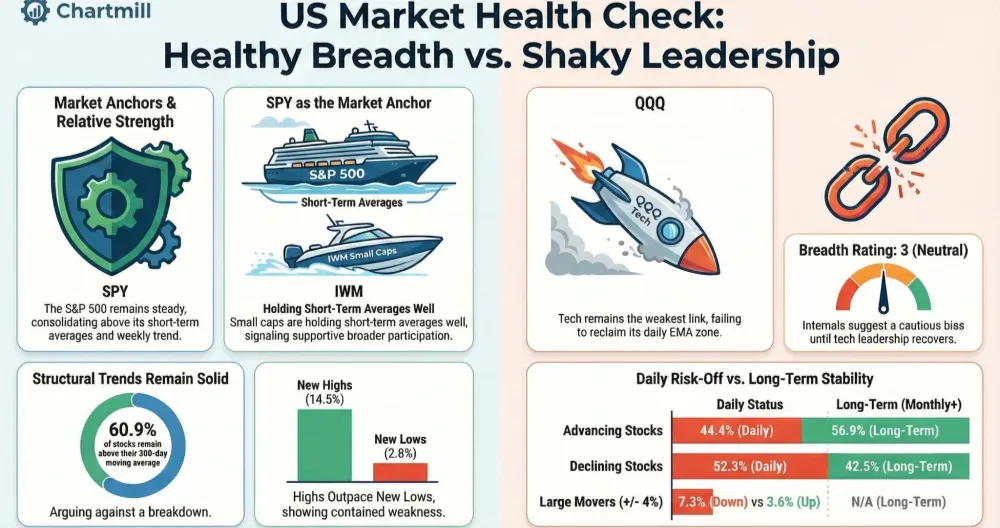
SPY
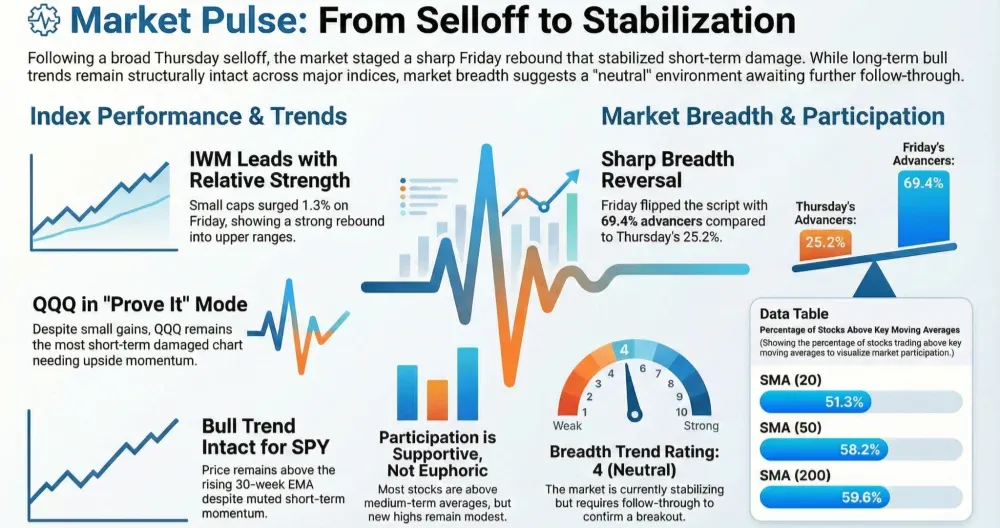
Daily: SPY closed higher again (+0.59%) and is holding the upper part of its range near recent highs. The EMA9/EMA21 structure remains constructive, with pullbacks continuing to find support quickly, classic “buy-the-dip” behavior in an uptrend.
Weekly: The broader picture stays clearly bullish: price is riding above a rising 30-week EMA, and the ChartMill Trend Indicator remains green, signaling a persistent long-term uptrend.
Takeaway: SPY continues to behave like a market in “trend continuation mode”, even if the next phase is more sideways than vertical.
QQQ
Daily: QQQ added +0.88%, stabilizing after recent chop. The chart still shows overhead supply / resistance in the ~629–637 area, and price is working through that zone rather than cleanly launching away from it.
Weekly: The long-term trend is still intact (above a rising 30-week EMA), but QQQ looks like it’s digesting gains rather than leading aggressively.
Takeaway: Tech is participating, but it’s not the “all-clear, risk-on rocket” yet. It’s more of a controlled grind.
IWM
Daily: IWM was the standout (+1.3%) and continues to push into a known resistance area near the prior highs (~258 zone). EMAs have tightened and are curling up again, typical of a market attempting to resolve higher.
Weekly: IWM gained +2.9% on the week view and remains aligned with a rising 30-week EMA (Trend Indicator green).
Takeaway: Small caps are acting as a breadth tailwind. If IWM can clear resistance with follow-through, breadth typically benefits.
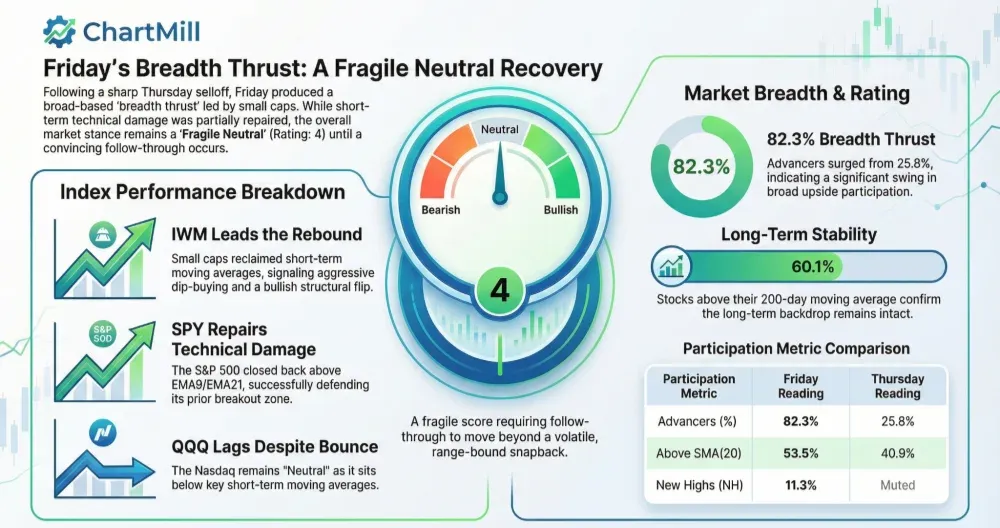
Breadth dashboard (what changed vs. Monday)
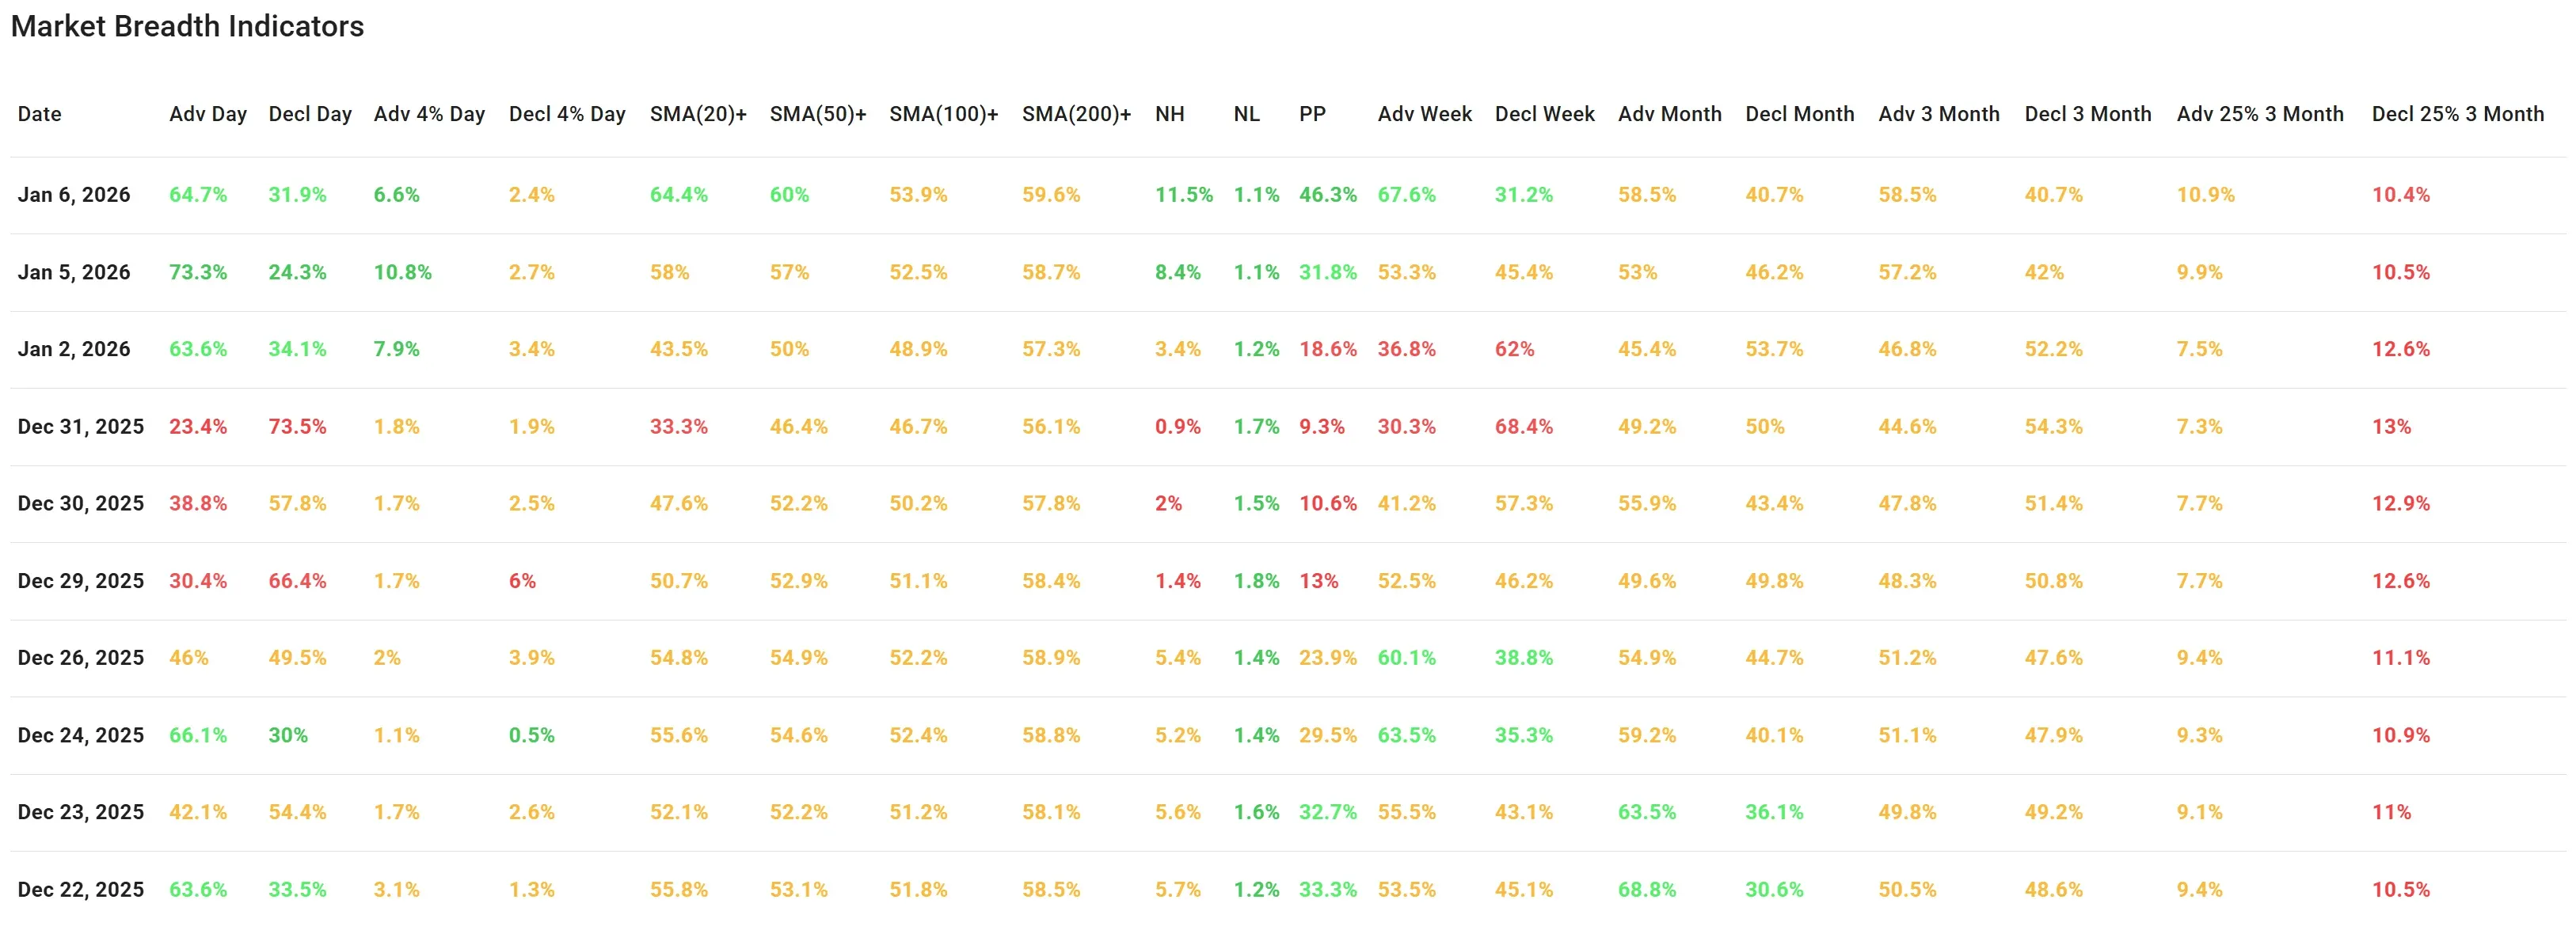
Daily breadth: still positive, just less “one-way”
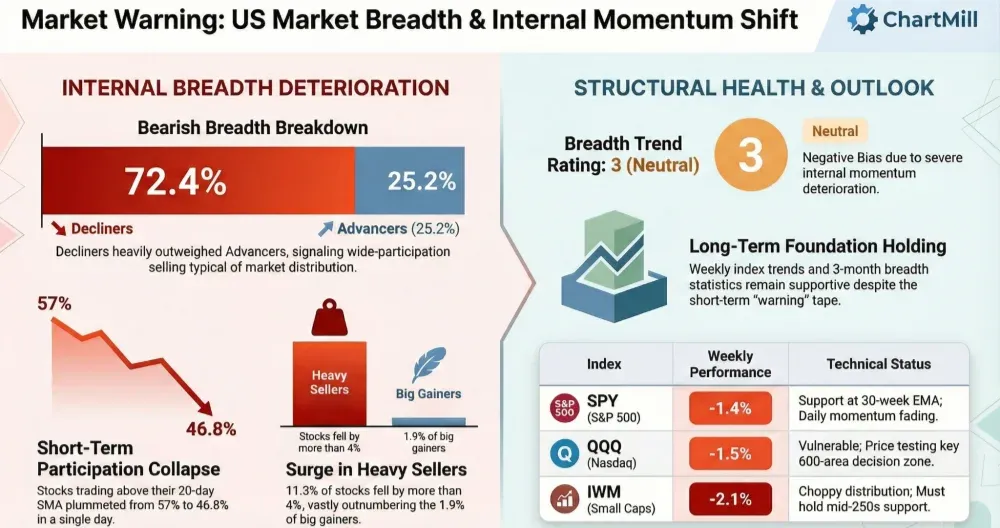
- Advancers (Day): 64.7% vs Decliners: 31.9%
That’s a solid positive skew, though less extreme than Monday (which was a stronger “thrust” day).
- Big movers: Adv +4%: 6.6% vs Decl -4%: 2.4%
Upside expansion continues to beat downside expansion, important because this is where momentum usually shows up first.
Interpretation: Monday looked like a breadth surge. Tuesday looks like follow-through with some digestion—healthy if the internals keep improving.
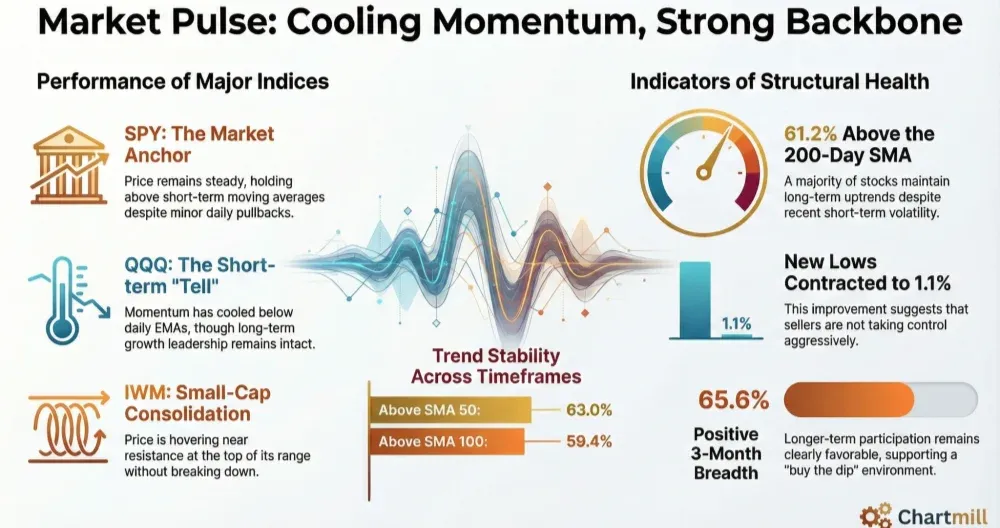
Participation improved meaningfully (a key “under the hood” confirmation)
The “% of stocks above moving averages” improved across the board:
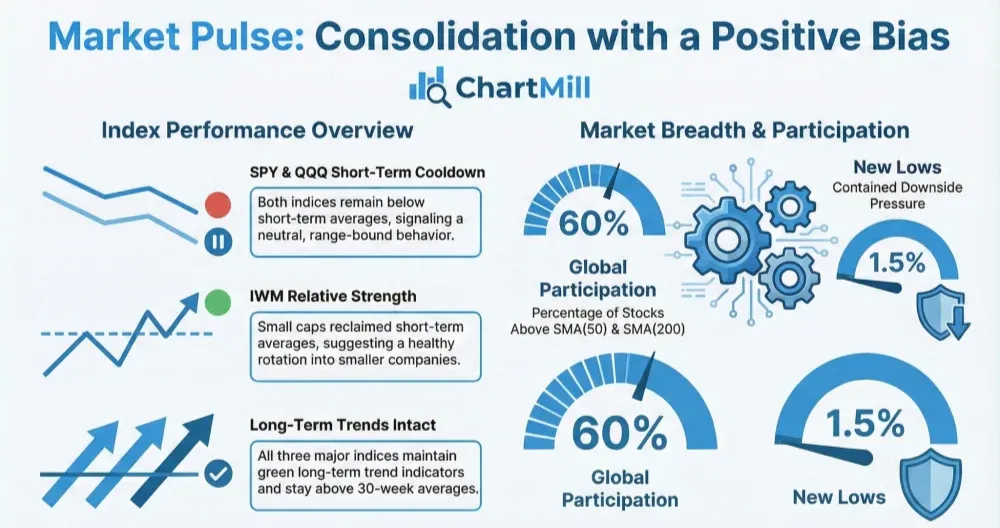
- Above SMA(20): 64.4% (up from 58% Monday)
- Above SMA(50): 60% (up from 57%)
- Above SMA(100): 53.9% (up from 52.5%)
- Above SMA(200): 59.6% (up from 58.7%)
Interpretation: Even though the daily adv/dec ratio cooled, more stocks are reclaiming trend structure. That’s typically what you want to see in a sustainable rebound.
New Highs vs New Lows: strong asymmetry
- NH: 11.5% vs NL: 1.1%
Interpretation: This is one of the cleanest “risk appetite” tells in your table. New lows remain contained while new highs expand, another confirmation that the market is leaning toward offense, not defense.
The big shift: weekly breadth flipped hard in favor of advancers
- Adv Week: 67.6% vs Decl Week: 31.2%
That’s a notable improvement from Monday’s weekly mix and supports the idea that the recent bounce is gaining traction.
Interpretation: This is the kind of rotation that often shows up when rebounds stop being “index-only” and start becoming broader.
Linking it to Monday (what continued vs what changed)
Continued: Higher prices in all three index ETFs + improving internals (more stocks back above key moving averages) + expanding new highs.
Changed: Monday’s daily breadth thrust (very strong adv/dec) normalized on Tuesday, but without damaging the broader internal trend. In fact, the participation metrics improved.
Bottom line: The market looks like it’s transitioning from “rebound attempt” to “rebound with structure,” with small caps helping and tech still working through resistance.
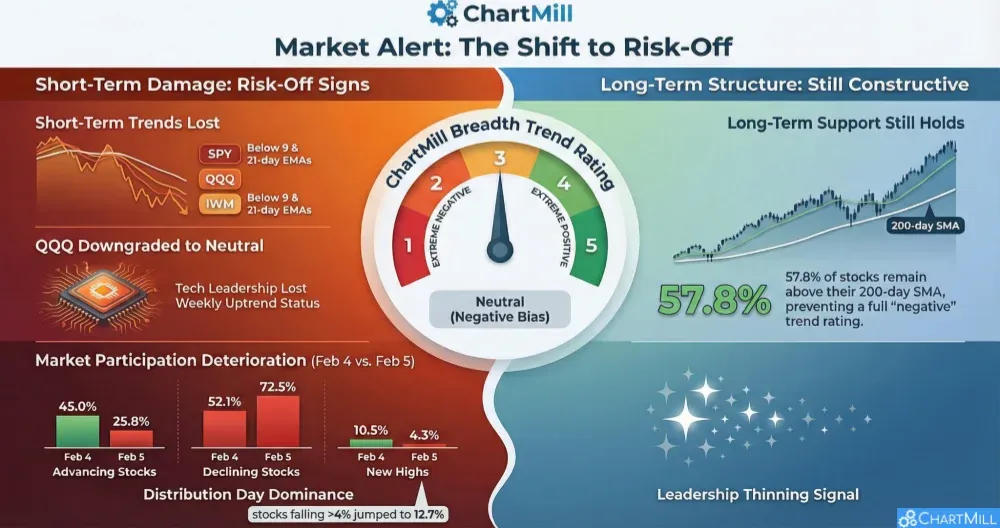
Breadth trend rating
Rating: Positive
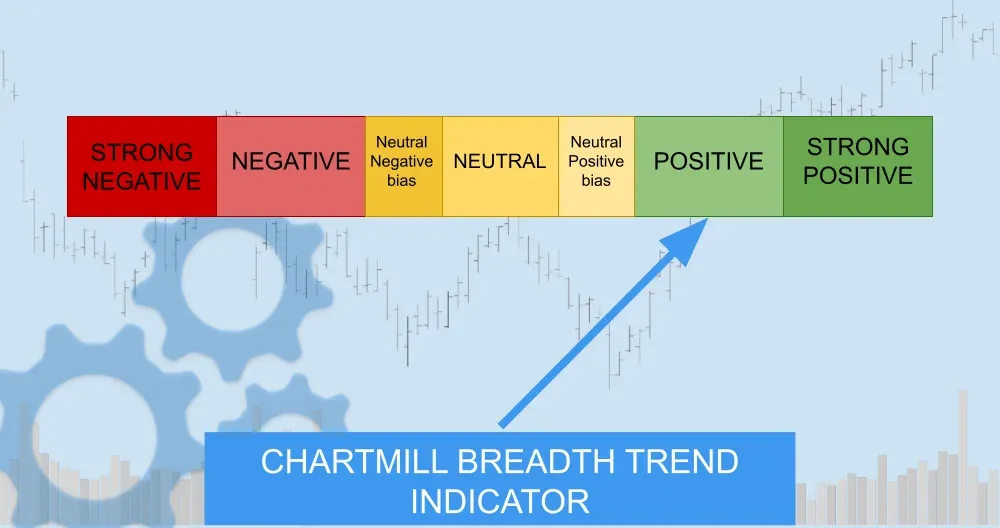
Breadth is improving across multiple timeframes, new highs are expanding while new lows stay muted, and participation is rising across short-, medium-, and long-term moving averages. The only restraint is that some leadership (QQQ) still appears to be digesting near resistance rather than breaking cleanly—so “very positive” would be premature.
Kristoff
Next to read: Dow Clears 49,000 as AI’s “Data Deluge” Ignites a Memory-Stock Melt-Up